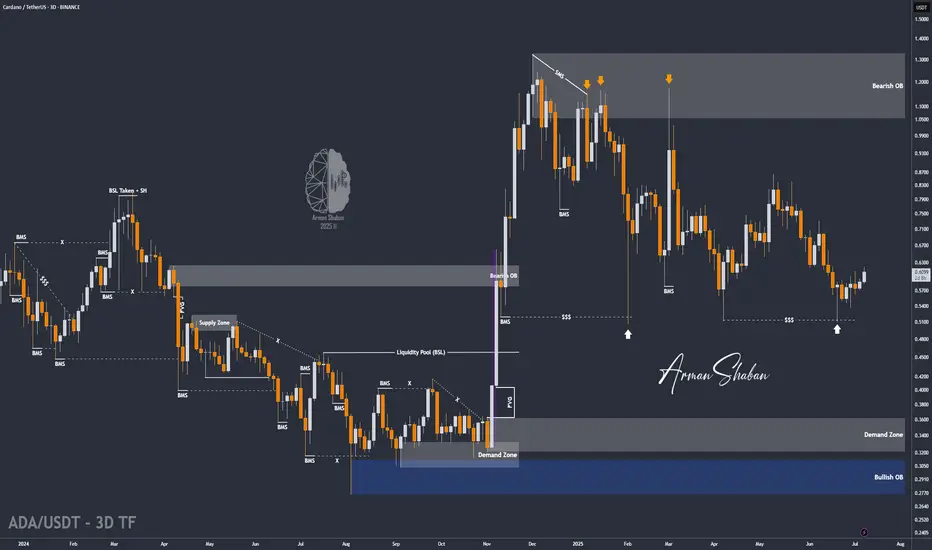
ADA/USDT : ADA Rally in Motion – Over 20% Gain and More to Come?By analyzing the Cardano (ADA) chart on the 3-day timeframe, we can see that after revisiting the $0.57 zone, the price once again followed the previous analysis and encountered strong buying pressure—rallying up to $0.61 so far.
The return from the previous entry has now exceeded 8%, and the overall gain from the full move stands above 20%.
The next bullish targets are $0.76, $0.93, $1.05, and $1.33.
(A deeper and more detailed analysis is recommended for long-term investment decisions.)
THE MAIN ANALYSIS :
Crypto
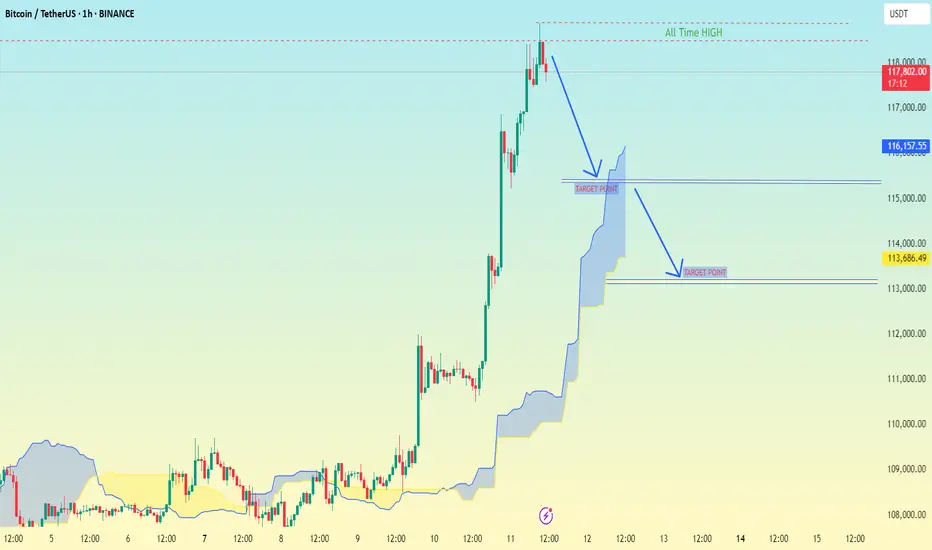
Bitcoin (BTC/USDT) on the 1-hour timeframeBitcoin (BTC/USDT) on the 1-hour timeframe:
🔽 Bearish Target Points (Downside Levels):
First Target: ~116,157.55 USDT
This level is close to the upper edge of the Ichimoku Cloud (Kumo), which can act as initial support.
Second Target: ~113,686.49 USDT
This is the deeper pullback level, marked clearly as the main "Target Point" on the chart. It aligns with historical structure and is near the lower part of the cloud.
🧠 Summary:
The chart suggests a potential pullback from the recent all-time high (~118,110 USDT).
If price breaks below 116k, the next major support is ~113.6k.
Traders might look for buy entries at these levels if price action confirms support.
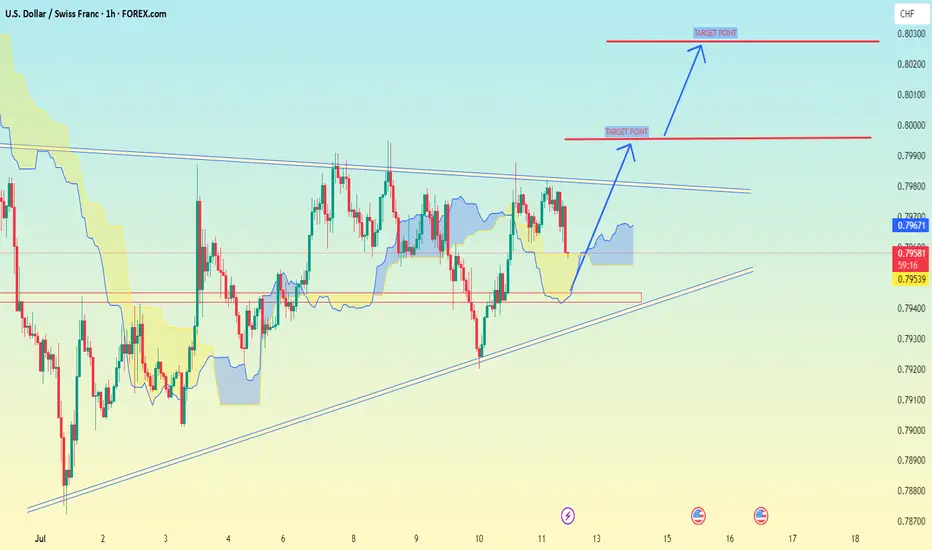
USD/CHF (1-hour timeframe)USD/CHF (1-hour timeframe), the analysis appears to include:
Ascending triangle pattern (with higher lows and a horizontal resistance).
Ichimoku Cloud for trend analysis.
Two marked target levels with projected breakout potential.
Identified Targets:
1. First Target:
🔹 Around 0.80000
This is just above the current resistance zone and seems to be the initial breakout target if price breaks the horizontal resistance.
2. Second Target (Final Target):
🔹 Around 0.80300 – 0.80350
This is the next higher resistance or profit-taking zone based on projected move from the triangle breakout.
---
Summary:
If the price breaks and closes above the horizontal resistance (approx. 0.79850), your potential targets are:
🎯 Target 1: 0.80000
🎯 Target 2: 0.80300–0.80350
Keep an eye on price action and volume confirmation before entry. Let me know if you want stop-loss suggestions or a risk/reward breakdown.
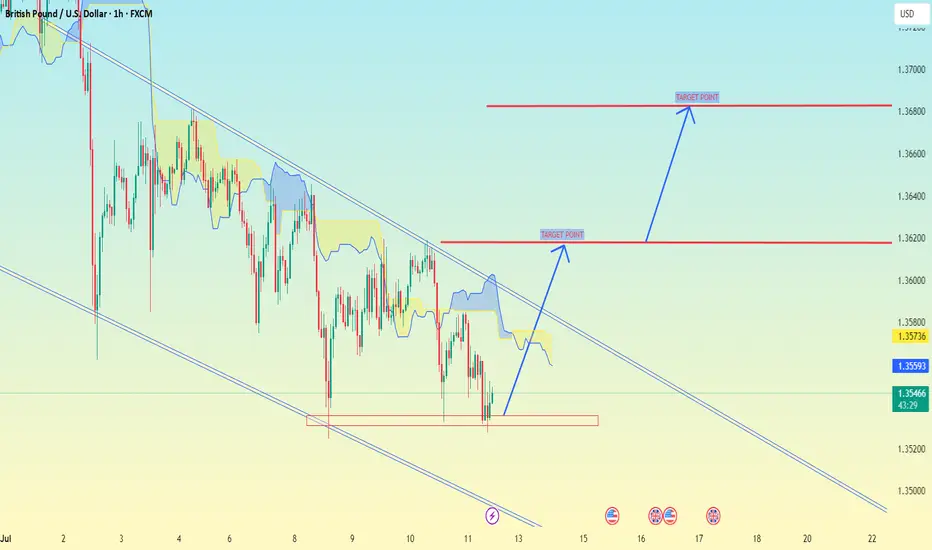
GBP/USD chart (1H timeframe)GBP/USD chart (1H timeframe), potential breakout from a descending channel, supported by the Ichimoku Cloud and marked target levels.
📈 Current Analysis Highlights:
Price is near the lower end of the descending channel.
A bullish reversal setup is forming.
I'm drawn two Target Points indicating a breakout and continuation.
---
🎯 Target Levels (as per your chart):
1. First Target Point:
🔹 1.36200 — This is the initial resistance level or TP1 if price breaks above the Ichimoku cloud and mid-channel resistance.
2. Final Target Point:
🔹 1.36800 — This is the upper resistance zone and aligns with the top of the descending channel, a likely TP2 area if bullish momentum continues.
---
✅ Summary:
Entry idea: After confirmation of a breakout above the cloud (~1.35600).
TP1: 1.36200
TP2: 1.36800
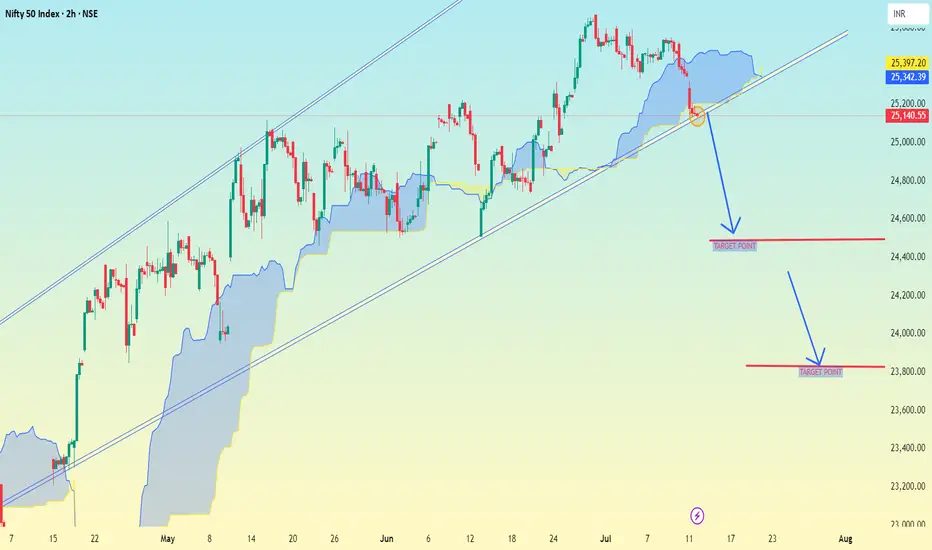
Nifty 50 Index (2h time frame)Nifty 50 Index (2h time frame), here is the analysis and potential target levels:
🔍 Technical Breakdown:
Trendline Break: The chart shows a rising trendline which has been broken to the downside.
Ichimoku Cloud: Price has moved below the cloud, indicating bearish momentum.
Arrows & Levels: Two downward arrows suggest potential drop zones.
🎯 Target Levels (as marked on chart):
1. First Target Zone:
📍 Around 24,400
Likely first support zone / take-profit level after breakdown.
2. Second Target Zone:
📍 Around 23,800
Deeper correction zone based on prior support and structure.
✅ Summary:
If the breakdown sustains below the trendline and cloud:
Immediate target: 24,400
Extended target: 23,800
Let me know if you want stop-loss ideas or a risk/reward plan for this trade.
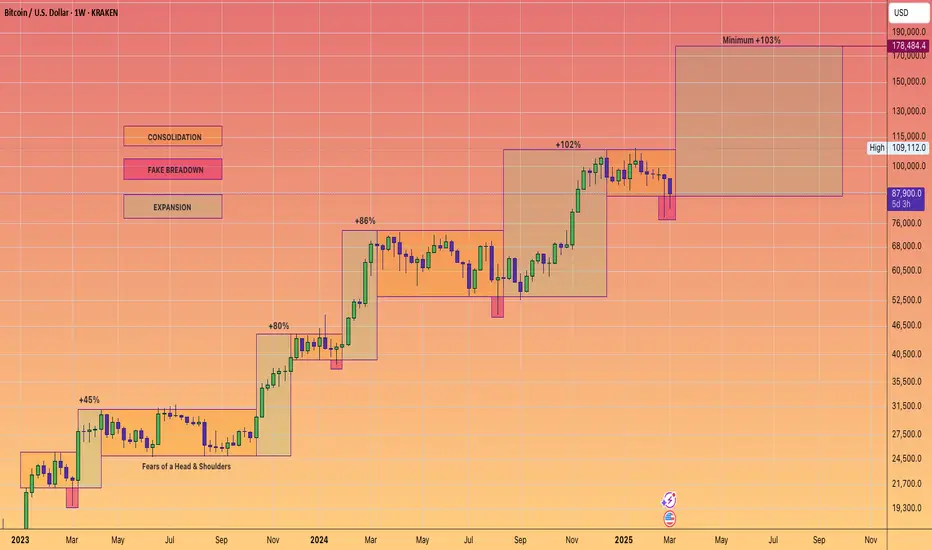
BITCOIN's PUMPs are Getting LARGER this Bull Market...However, it may take a bit longer to realize those expansionary moves.
If Bitcoin adheres to the established cycle pattern, we can anticipate a minimum surge of 103% that should carry us into the fourth quarter of this year.
Consolidation ----> Fake breakdown ----> then expansion.
Are you ready?
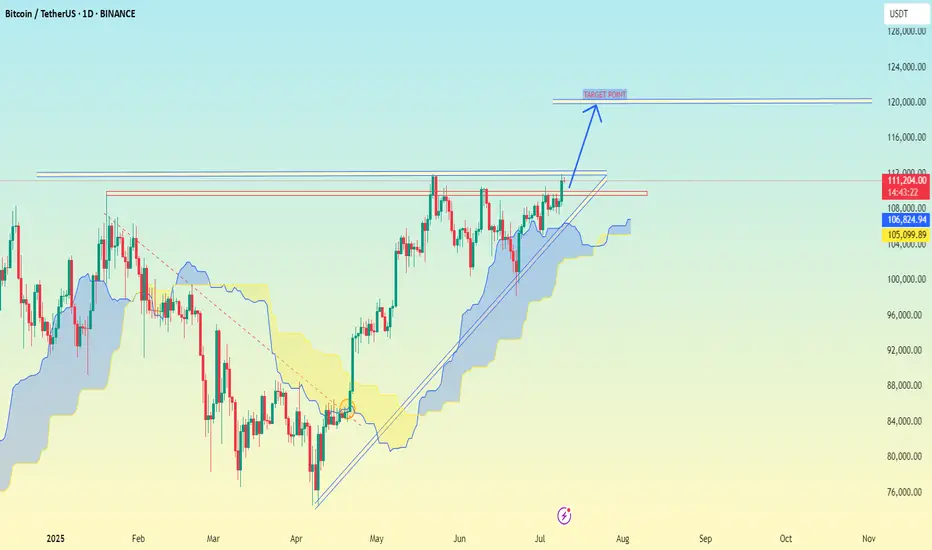
(BTC/USDT) appears to be around $120,000.(BTC/USDT) appears to be around $120,000.
Here's a quick analysis of what the chart suggests:
Timeframe: 1D (Daily)
Current price: ~$111,150
Technical Indicators:
Ascending triangle breakout is indicated.
Ichimoku Cloud shows bullish momentum (price above the cloud).
The breakout is targeting a horizontal resistance zone around $120,000.
✅ Target Zone:
Target Point (based on breakout projection): $120,000 – $124,000
This target aligns with previous resistance levels and technical breakout patterns.
Let me know if you want a more detailed technical breakdown (e.g., support/resistance zones, volume analysis, RSI, etc.).
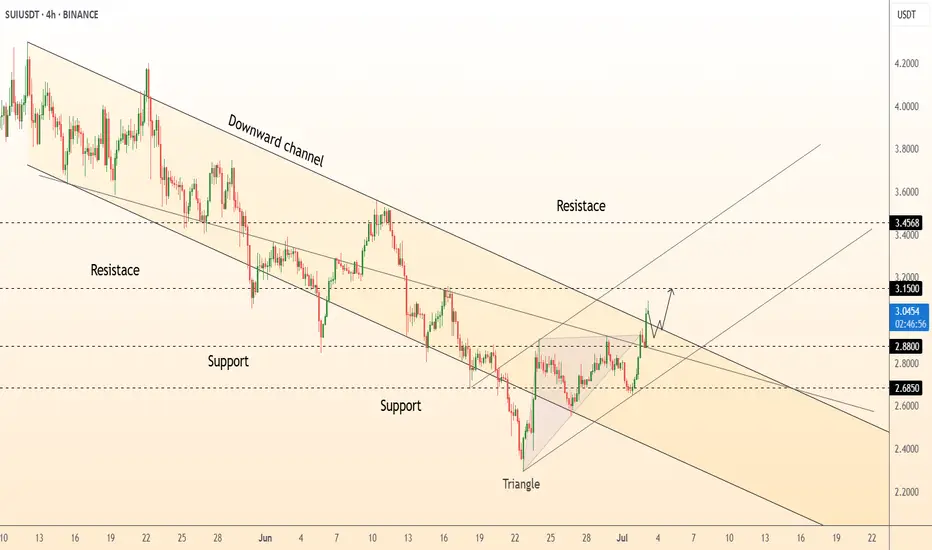
DeGRAM | SUIUSD got out of the channel📊 Technical Analysis
● Price pierced the four-week falling-channel roof and the apex of a contracting triangle, turning 2.88 support into a launchpad and carving a sequence of higher lows.
● Breakout measured move and channel mid-band converge at 3.15; a close above there exposes the next horizontal barrier and channel top at 3.46. Risk is framed by the former triangle base at 2.88 and major swing floor 2.69.
💡 Fundamental Analysis
● Sui’s on-chain TVL has climbed >15 % since 25 Jun after zkLogin main-net rollout and Mysten Labs’ new developer grants, underpinning demand despite broad market lethargy.
✨ Summary
Long 2.90-3.05; hold above 3.15 targets 3.46. Invalidate on a 4 h close below 2.88.
-------------------
Share your opinion in the comments and support the idea with a like. Thanks for your support!
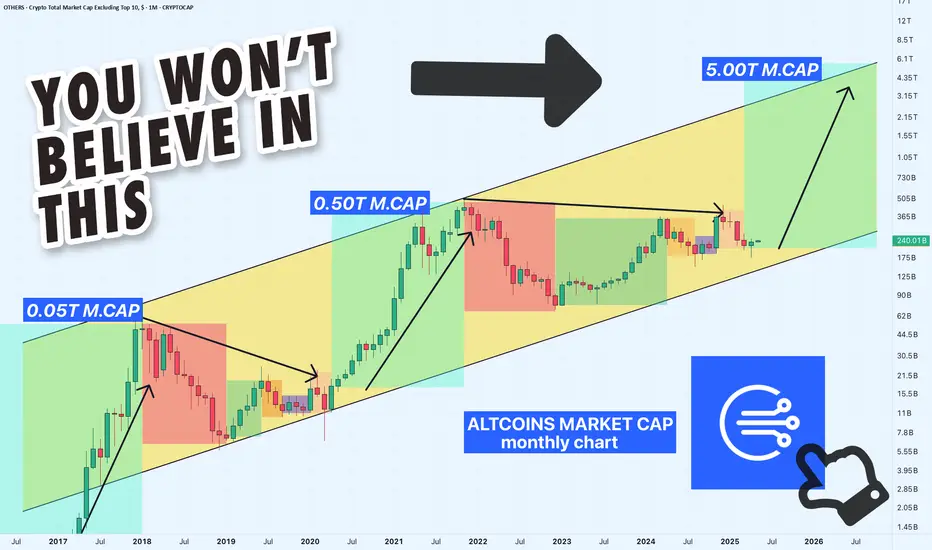
Altcoins Market Cap: We on the Verge of a 5T Exposion!Hey crypto traders! Let’s dive into this monthly chart of the Altcoins Market Cap. You won’t believe what’s brewing!
We’re currently approaching a critical channel support at 200B, a level that might act as a springboard for massive rally — check out the jumps from channel support in 2019 and 2023! Each time the market cap hit this support, it skyrocketed, and now we’re at that pivotal moment again.
The chart projects a jaw-dropping target of $5T within the next 24 months if history repeats itself!
The price action shows we’re testing the lower boundary of this ascending channel, with the market cap sitting around 239.65B. A bounce here could send altcoins on a parabolic run, potentially hitting 5T by mid-2026. But if support fails, we might see a dip toward 100B — let’s keep an eye out!
Key Levels to Watch:
Support: 175B (channel support)
Resistance: 1.55T, 5T (projected target)
Breakdown Risk: 100B
Are altcoins about to explode to 5T, or will we see a deeper correction? Drop your thoughts below!
PS take a look at others vs. btc price action here:
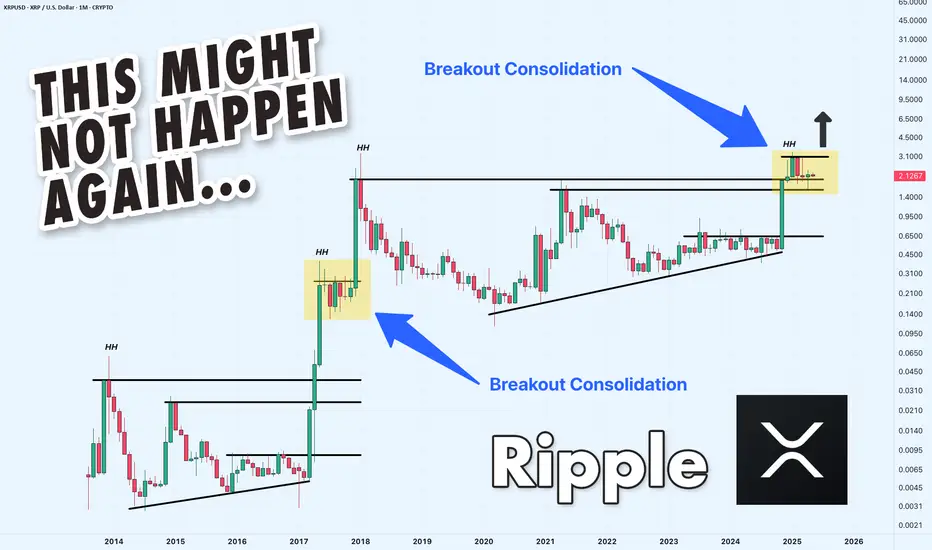
XRP/USDT Monthly Chart: History Repeating Itself?Hey traders! Let’s dive into this monthly XRP/USDT chart. I’ll be honest — I’m skeptical about this outcome, but let’s break it down because it could actually happen!
The chart screams déjà vu, with XRP’s price action mirroring the 2014-2018 period. Back then, XRP broke out from its 2014 ATH in 2017, leading to a massive rally. Fast forward to now, and we’re seeing a similar setup, but with a twist. XRP is struggling to break through the 2018 ATH resistance zone around $3.31, which reminds me of the Breakout Consolidation phase we saw in 2017. Historically, this consolidation led to a breakout, and the chart hints at a potential repeat!
If XRP breaks out soon, we could see a parabolic move, potentially targeting much higher levels. However, the current resistance is a tough hurdle, and if it fails, we might see a pullback to lower supports.
Key Levels to Watch:
Resistance: $3.31 (2018 ATH)
Support: $1.643 (previous consolidation low)
Breakout Target: To be determined (potentially parabolic)
Breakdown Risk: $0.650
I’m not fully convinced, but the setup is intriguing — could this be XRP’s moment to shine? What do you think? Let’s discuss below!
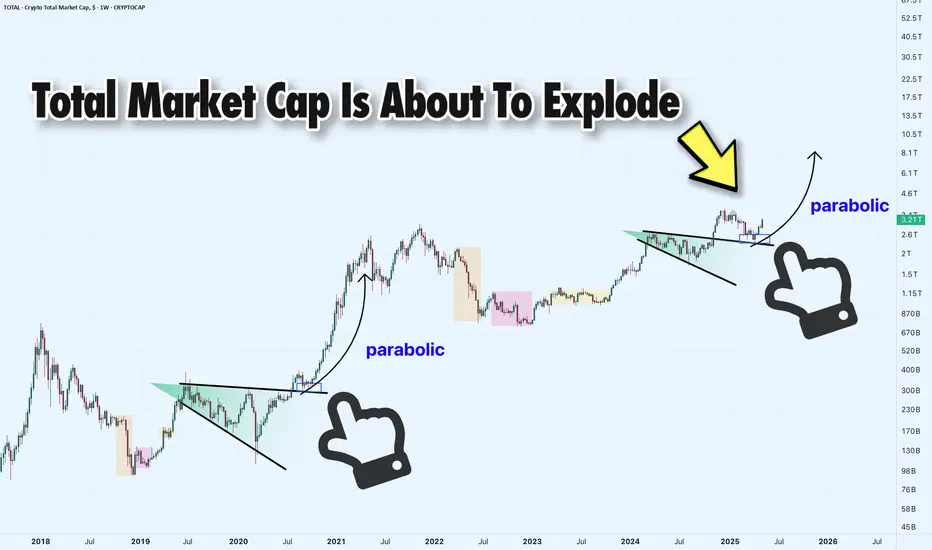
Total Market Cap Weekly Chart: Ready to Explode?Hey traders! Let’s dive into this weekly TOTAL Crypto Market Cap chart. The headline says it all— Total Market Cap Is About to Explode , and we’re here to break it down!
We’re seeing a massive expanding triangle formation, with the market cap currently at 3.21T , right at retest of triangle resistance. Historically, these patterns have led to parabolic moves — check out the 2019 - 2020 breakout! If history repeats, a breakout could send the market cap soaring toward 8.0T or even higher!
However, if the breakout fails, we might see a pullback to the previous level of support around 2T .
Key Levels to Watch:
Resistance: 3.66T (ATH)
Support: 2T
Breakout Target: 8.1T+
Breakdown Risk: 1.20T (latest strong resistance below 2.6T)
Is the market cap about to go parabolic, or are we in for a fakeout? Let’s hear your thoughts below!
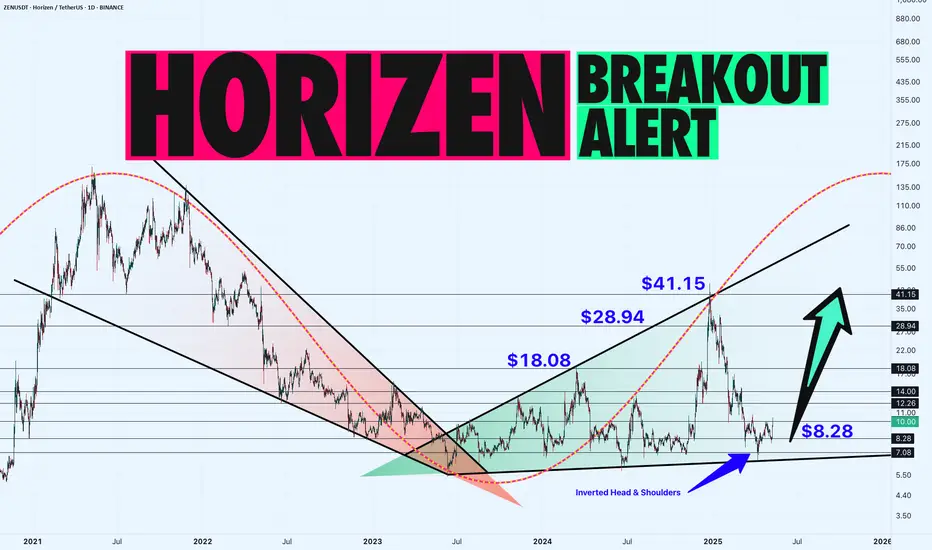
ZEN/USDT Daily Chart: Accumulation Before the Big Move? Hey traders! Let’s dive into this daily ZENUSDT chart. Horizon is in a sideways accumulation phase, forming an Expanding Wedge right after a massive bullish Falling Wedge breakout.
We’re also seeing a small inverted head and shoulders at the bottom support range of $7.08-$10.08 , with the neckline at $10.08 . ZEN recently revisited this level, and a confirmed breakout could propel it toward $18.08-$28.94 , with a major target at $41.15 .
If the breakout fails, we might see a pullback to the neckline at $10.08 or the shoulder support at $8.28 .
Key Levels to Watch:
Resistance: $18.08, $28.94, $41.15
Support: $8.28
Breakout Target: $41.15
Breakdown Risk: $8.28
Is ZEN about to skyrocket, or will this breakout fail? Let’s hear your thoughts below!
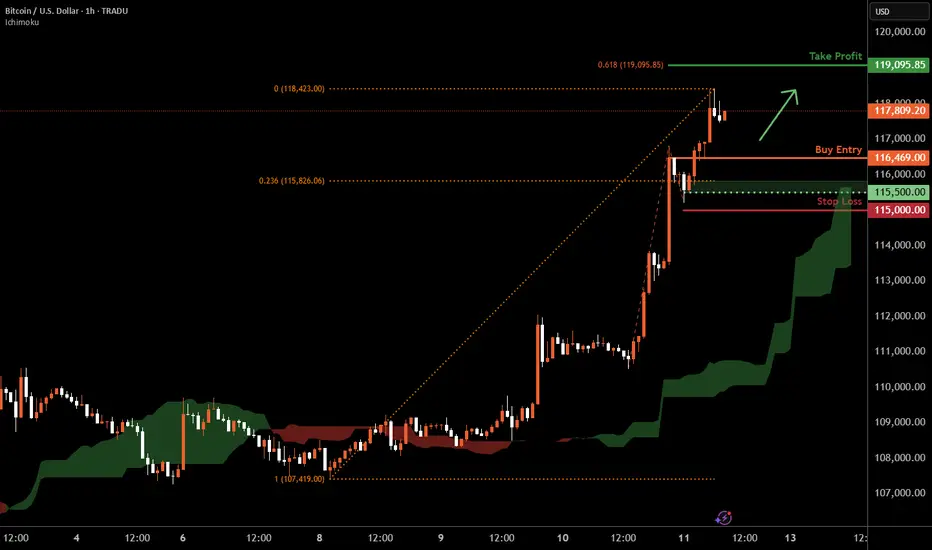
Bitcoin H1 | Bullish uptrend to extend higher?Bitcoin (BTC/USD) could fall towards a pullback support and potentially bounce off this level to climb higher.
Buy entry is at 116,469.00 which is a pullback support.
Stop loss is at 115,000.00 which is a level that lies underneath a swing-low support and the 23.6% Fibonacci retracement.
Take profit is at 119,095.85 which is a resistance that aligns with the 61.8% Fibonacci projection.
High Risk Investment Warning
Trading Forex/CFDs on margin carries a high level of risk and may not be suitable for all investors. Leverage can work against you.
Stratos Markets Limited (tradu.com ):
CFDs are complex instruments and come with a high risk of losing money rapidly due to leverage. 63% of retail investor accounts lose money when trading CFDs with this provider. You should consider whether you understand how CFDs work and whether you can afford to take the high risk of losing your money.
Stratos Europe Ltd (tradu.com ):
CFDs are complex instruments and come with a high risk of losing money rapidly due to leverage. 63% of retail investor accounts lose money when trading CFDs with this provider. You should consider whether you understand how CFDs work and whether you can afford to take the high risk of losing your money.
Stratos Global LLC (tradu.com ):
Losses can exceed deposits.
Please be advised that the information presented on TradingView is provided to Tradu (‘Company’, ‘we’) by a third-party provider (‘TFA Global Pte Ltd’). Please be reminded that you are solely responsible for the trading decisions on your account. There is a very high degree of risk involved in trading. Any information and/or content is intended entirely for research, educational and informational purposes only and does not constitute investment or consultation advice or investment strategy. The information is not tailored to the investment needs of any specific person and therefore does not involve a consideration of any of the investment objectives, financial situation or needs of any viewer that may receive it. Kindly also note that past performance is not a reliable indicator of future results. Actual results may differ materially from those anticipated in forward-looking or past performance statements. We assume no liability as to the accuracy or completeness of any of the information and/or content provided herein and the Company cannot be held responsible for any omission, mistake nor for any loss or damage including without limitation to any loss of profit which may arise from reliance on any information supplied by TFA Global Pte Ltd.
The speaker(s) is neither an employee, agent nor representative of Tradu and is therefore acting independently. The opinions given are their own, constitute general market commentary, and do not constitute the opinion or advice of Tradu or any form of personal or investment advice. Tradu neither endorses nor guarantees offerings of third-party speakers, nor is Tradu responsible for the content, veracity or opinions of third-party speakers, presenters or participants.
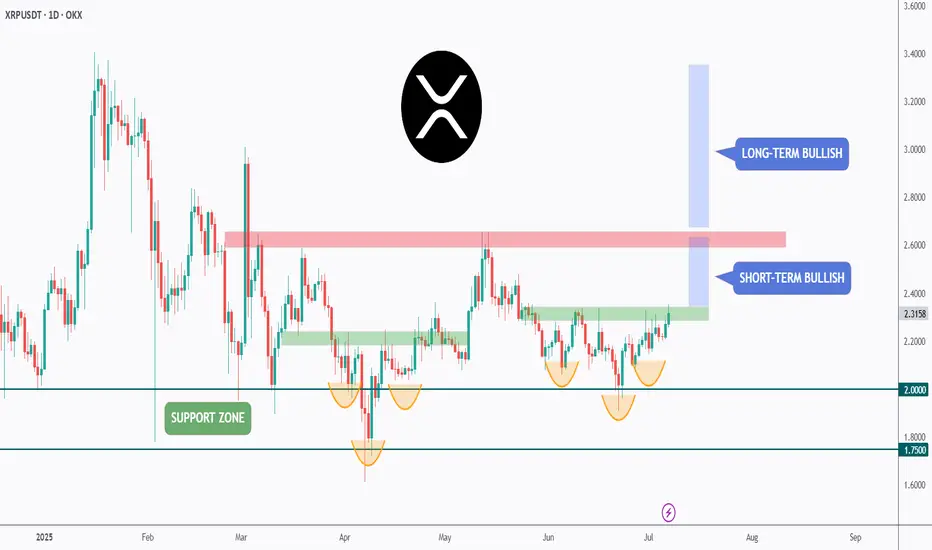
XRP - Wait For It!Hello TradingView Family / Fellow Traders. This is Richard, also known as theSignalyst.
📈 Is history repeating itself? 🤔
XRP is now back at the $1.75–$2 support zone and forming a fresh inverse head and shoulders pattern.
As long as this support holds, we’ll be on the lookout for new long opportunities. 🟢
For the bulls to take over in the short term, a break above the green neckline is needed.
And for long-term control, a break above the red structure is essential. 🔺
For now, we wait patiently! ⏳
📚 Always follow your trading plan regarding entry, risk management, and trade management.
Good luck!
All Strategies Are Good; If Managed Properly!
~Rich
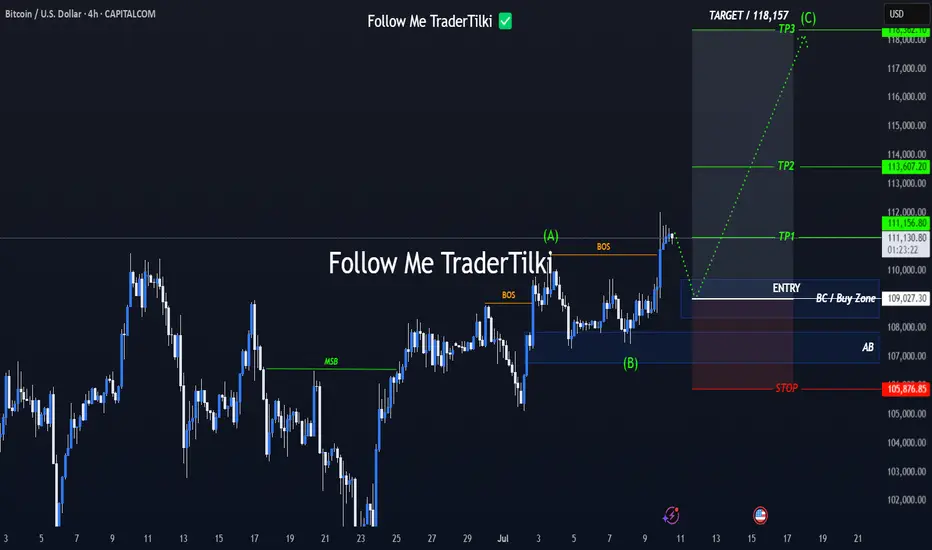
109K Launch Zone? Bitcoin Update Now LiveHey everyone,
Here's my latest Bitcoin analysis for you. The current price action is unfolding within an ABC corrective wave.
🔍 I've identified the optimal buy zone between 108,349 and 109,682.
📉 Once the price pulls back into this range, my limit orders will be triggered and the position will open.
🎯 In this scenario, my target level is 118,157.
Below are the exact levels for my entry, targets, and stop-loss:
- 🟩 Entry Level: 109,027
- 🟥 Stop-Loss: 105,876
- 🎯 TP1: 111,156
- 🎯 TP2: 113,607
- 🎯 TP3: 118,362
- ⚖️ Risk/Reward Ratio: 3.00
(This is based on a swing trade model, so reaching this level may take some time)
--------
Your likes and support are what keep me motivated to share these analyses consistently.
Huge thanks to everyone who shows love and appreciation! 🙏
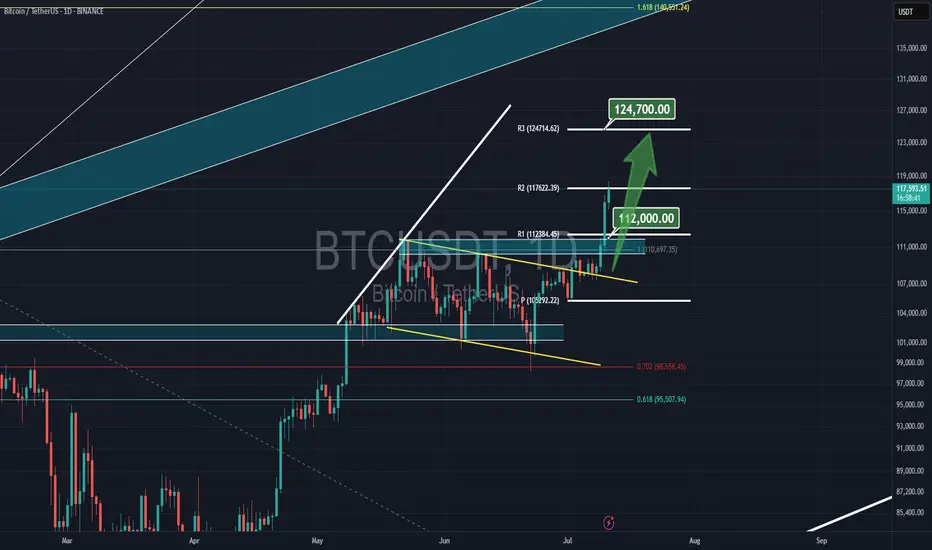
Bitcoin & new rallyBitcoin surpassed its previous all-time high of $112,000 and is now approaching $124,700, the third resistance level for July's pivot.
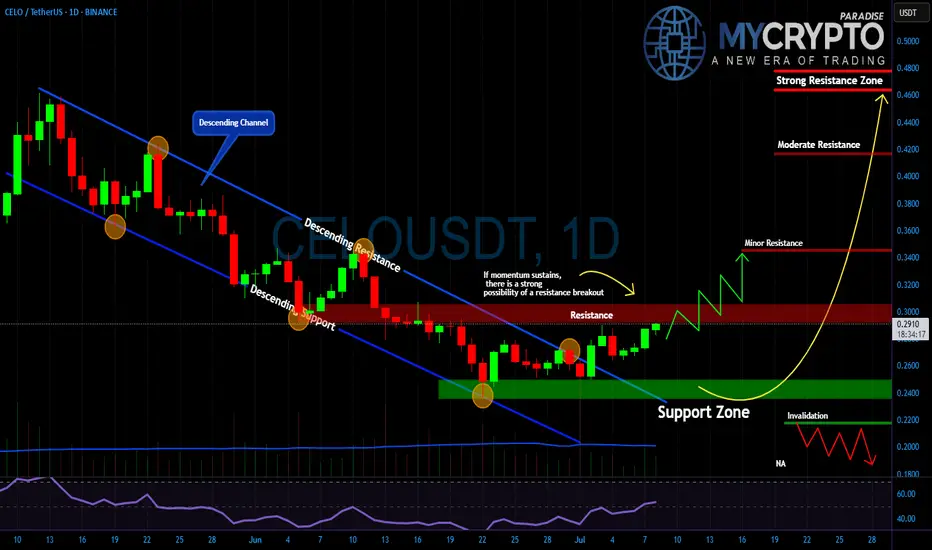
CELO About to Explode or Fakeout Incoming?Yello, Paradisers! Is this the breakout we’ve been patiently waiting for or just another trap to liquidate late buyers?
💎After weeks of grinding lower inside a clear descending channel, #CELO/USDT has finally broken out to the upside. That breakout alone isn’t enough, but it’s a critical first signal that sellers are losing control. Price is now pushing right into the key resistance zone at $0.29–$0.30, and what happens here will decide the next major move.
💎If momentum holds and price reclaims this level with conviction, we could see an explosive move toward $0.34 and potentially even the stronger resistance zones at $0.41 and $0.47 in the coming weeks. But if buyers fail to defend this push, and price rolls over, then the bullish setup quickly falls apart.
💎What gives us more confidence? The support zone at $0.24–$0.25 held beautifully buyers stepped in hard, and the market reversed cleanly from there. But if #CELO drops back below $0.22, the setup is invalidated and we'll wait patiently again for the next high-probability entry.
This is where most retail traders get trapped, they chase the move too late or panic-sell too early. Don’t be that trader. Stay focused. Be precise.
MyCryptoParadise
iFeel the success🌴
Shiba Inu Still Early Massive Wave yet Bullish —1,558% PPThe blue pattern on the chart is an analog of the purple pattern but bigger.
It is still early for Shiba Inu (SHIBUSDT) because the action is happening below MA200. The long-term bullish bias is only confirmed once the action moves and closes above this level.
This shouldn't be considered bearish because we have a clear higher low based on the two different consolidation patterns. The purple one produced the main low and the blue one the higher low. Multiple higher lows.
Lows—support confirmed—in August 2024, April & June this year. And that's it. This weekly candle is now full green and everything is about to turn positive crazy. Shiba Inu has been bearish since March 2024.
There was some bullish action in November 2024 but it ended as a lower high, what a bummer. All this time with no new highs, no major growth. This cycle is coming to an end. The null cycle, the boring cycle, the little-to-no-profits cycle is over... That's awesome. What does Shiba Inu has in store for us?
A new all-time high to start. Maximum growth. Euphoria, higher prices; growth. It will be awesome.
I am giving you all of the targets for Shiba Inu (SHIBUSDT). The highest one is 0.000220491. Total profits potential reach 1,558% from current price.
There are two resistance levels of interest below the previous ATH: 0.000067612 & 0.000057511.
Minimum new 2025 all-time high we will go for 0.000103188 for 676%.
You can find more numbers and targets by doing a close-up on the chart.
I hope you find this information useful.
Your support is appreciated.
Namaste.

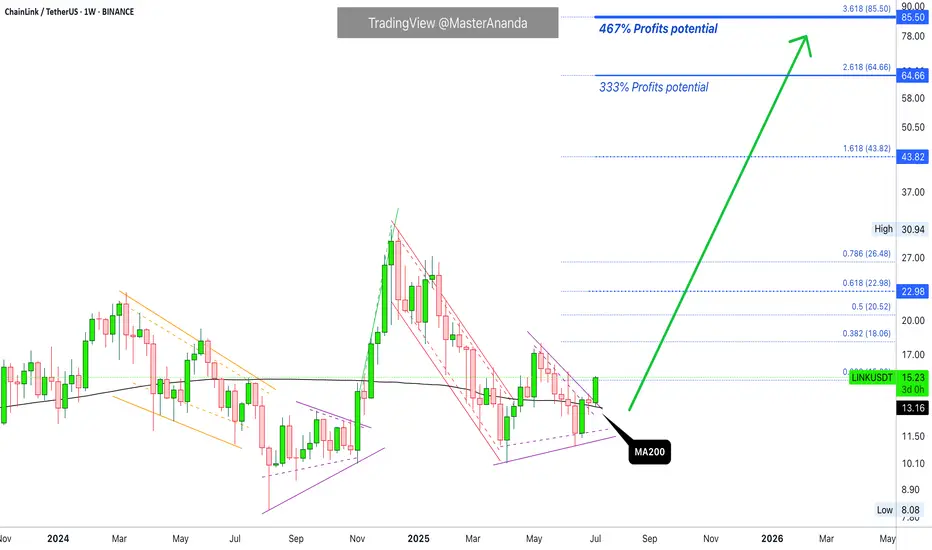
Chainlink Grows Above MA200, The Path is Clear To $65 (333% PP)Yes LINKUSDT broke a minor consolidation pattern but that's not all. The action this week is happening right above MA200. This level being conquered last week.
Good evening my fellow Cryptocurrency trader, how are you feeling in this wonderful day?
Chainlink is bullish now and has been bullish for months. Bullish doesn't necessarily means rising prices but potential for growth. Bullish happens at the bottom, when prices are low. Chainlink is bullish now and ready to grow.
For some people it might still be too early. "Anything can happen." "The bull market is not confirmed." "Wait for confirmation." "How do you know?"
I know because of the signals coming from the charts. I know based on marketwide action, Bitcoin's halving, the broader cycle, related markets, intuition, experience, astrology and so on. There are so many signals that it is impossible to mention them all. All these signals and systems point to the exact same thing, the same conclusion; Crypto is bullish, Bitcoin is bullish and Chainlink is set to grow next, now.
Now is the time for growth, it cannot go in any other way. Nothing else is possible, we are going up. It is still early. Not early for confirmation or certainty, early because we will have really strong growth.
It is still early because LINKUSDT is set to hit $44 followed by $65 in the coming months.
Just imagine the energy, the feeling, the euphoria, the market sentiment, your portfolio... Just try and visualize the market six months into the future. What do you see?
Maybe it is hard to feel for sure what is going to be like, but you can be certain that prices will increase. If you are holding Crypto, you will be happy with the results.
You deserve everything that will come to you because you were in when others were gone.
You deserve success and profits because you earned it by making the right choice.
You trusted Crypto, you trusted the market and now you will reap the reward.
Thanks a lot for your continued support.
Namaste.
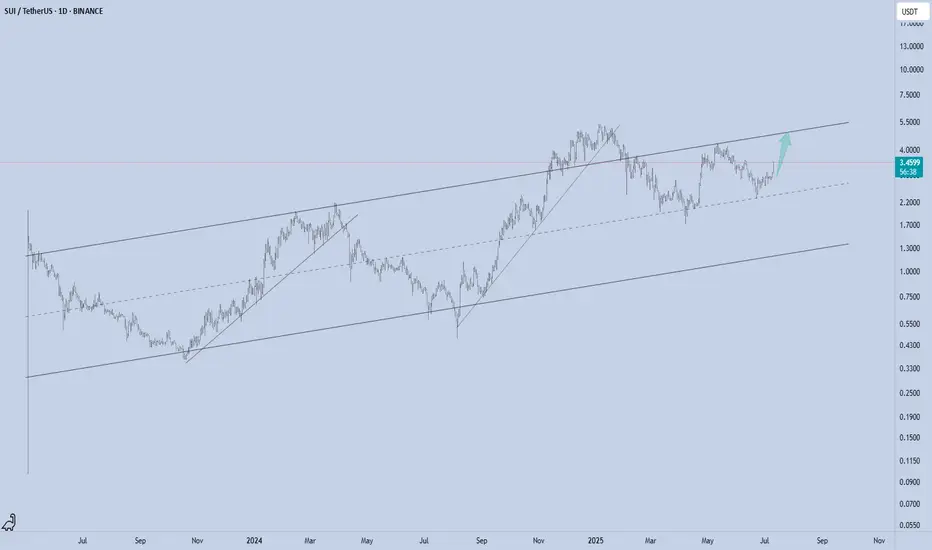
SUI - Channel Structure
SUI just printed a powerful +12.95% daily move, bouncing cleanly from the mid-range of its long-term ascending channel. This structure has been respected since mid-2023, guiding both impulse legs and corrective phases with precision.
Now trading around $3.47, the next logical magnet is the channel top near $5, especially if momentum persists and market sentiment remains risk-on.
Technical Structure:
Bullish trend within a well-defined ascending channel
Clean reaction from dynamic support (midline)
Clear higher low + breakout structure in play
Upside Target:
$5 (channel resistance)
As long as SUI holds above the rising midline (~$2.80 area), this setup remains valid for trend continuation toward the upper range.
📌 Risk Management:
Break below the midline flips the bias short-term. Until then, trend = friend.
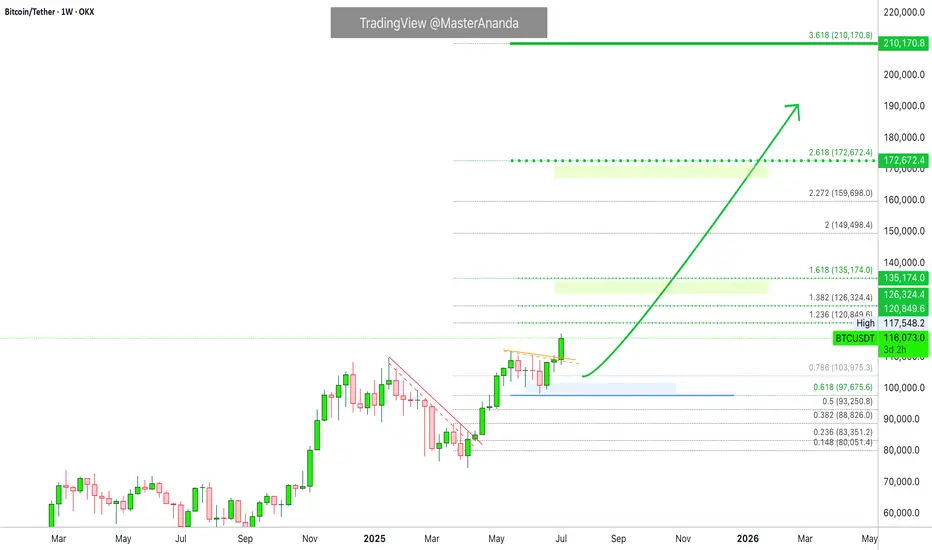
Bitcoin's Next Target Based on a 210 Days Long ConsolidationAfter each 210 days long consolidation phase Bitcoin advanced 137% on average, from bottom to top, since the November 2022 bear market low. Such an advance would put Bitcoin at a price of $170,000 next.
Now, the 137% is just the average. In one occasion Bitcoin rose 83% while in another occasion total growth amounted to more than 200%. We are counting the rise from the consolidation phase lowest point.
Let's look at some numbers:
» An 83% rise would put Bitcoin just above $135,000.
» A 128% rise would put Bitcoin right at $170,000.
» A 202% rise would put Bitcoin at a price of around $225,000.
~200% is how much Bitcoin grew between late 2023 and early 2024.
How much will Bitcoin grow exactly? We don't know. What we can know for sure is that there is plenty of room available for growth.
We are aiming for at least 100% growth starting from 100K, that is, a target of $200,000. Can be $180,000 just as it can be $220,000. That's the cycle top.
Do you agree with this target?
Leave a comment with your number.
Thank you for reading.
Namaste.
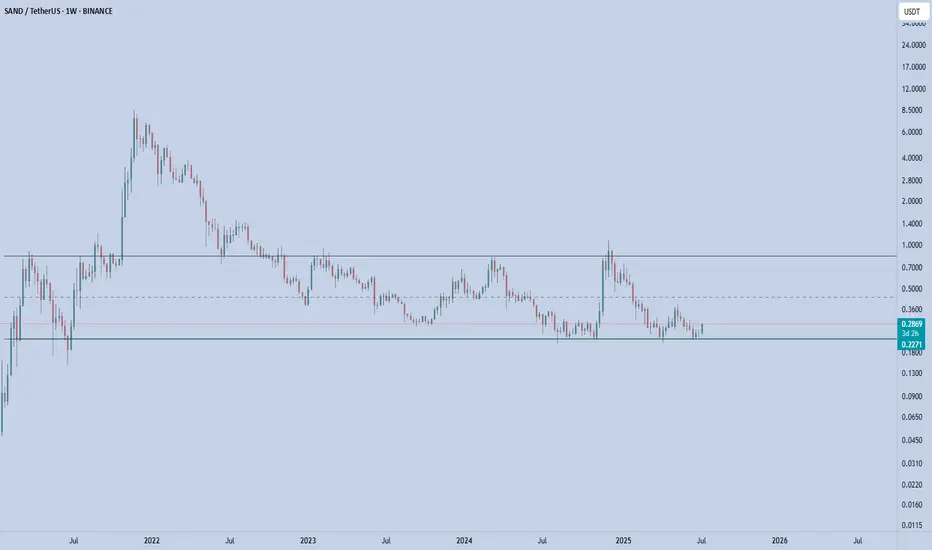
SAND – Rotation in PlaySAND is showing early signs of strength off the long-term demand zone near $0.23–0.24, where it's been accumulating for several months. Price just printed a strong weekly bounce, up +16%, reclaiming the bottom of the range.
This area has acted as a key base since mid-2023 — with each touch producing a notable reaction. Now trading at $0.286, SAND is attempting to rotate toward the top of the established range.
Key Levels
Support (Range Low): $0.23–0.24 (strong demand zone)
Resistance (Mid-Range): $0.43
Range High: $0.85
A clean flip of the mid-range ($0.43) could open the door to test $0.70+.
📌 Risk management: A break and weekly close below $0.23 invalidates this setup. As long as it holds, the upside potential is attractive from a risk/reward standpoint.
This is a classic accumulation > reclaim > expansion structure. Let the chart speak if the range holds, the rotation is in play.
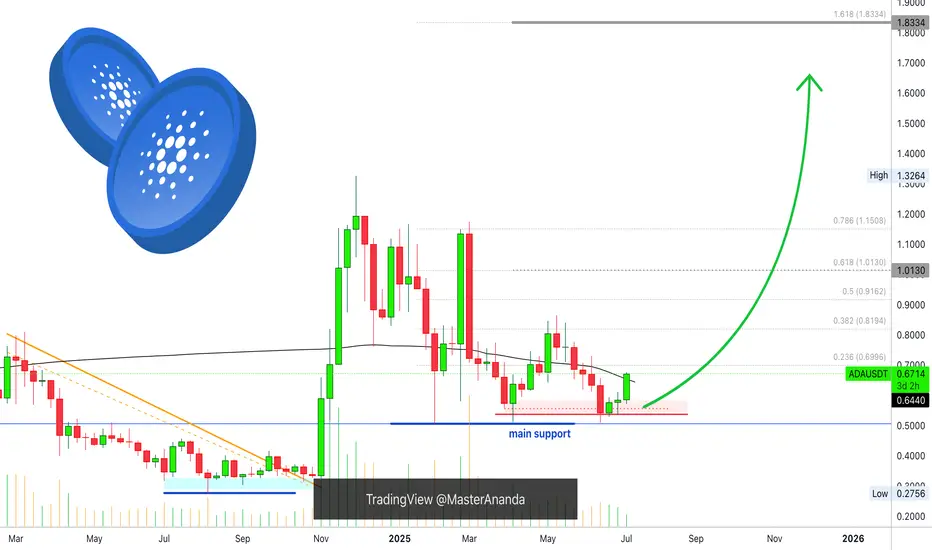
Cardano Ultra Bullish Confirmed, $1.83 Next (Easy) TargetThis is it. This is the signal you've been waiting for and the strongest possible signal across the Cryptocurrency market. Cardano is now moving above MA200 on the weekly timeframe, on a full green candle, as Bitcoin produces a very strong new all-time high. Simply put, this is the best ever.
Cardano has been testing the same low since early February, for five months. Five months and this support held nicely and now the action is turning green. The correction is over; consolidation is over, now comes the resumption of the bullish wave.
The bullish wave will produce a major, major, higher high compared to early December 2024, a target of $1.83 in the coming months and this is not all. This is not the end of the bull market nor the bullish wave, this is just the start, mid-portion, we are set to experience growth long-term.
You can go all-in now. The altcoins bull market is already confirmed. Bullish momentum will start to grow. Feel free to buy and hold.
Thanks a lot for your continued support.
Namaste.