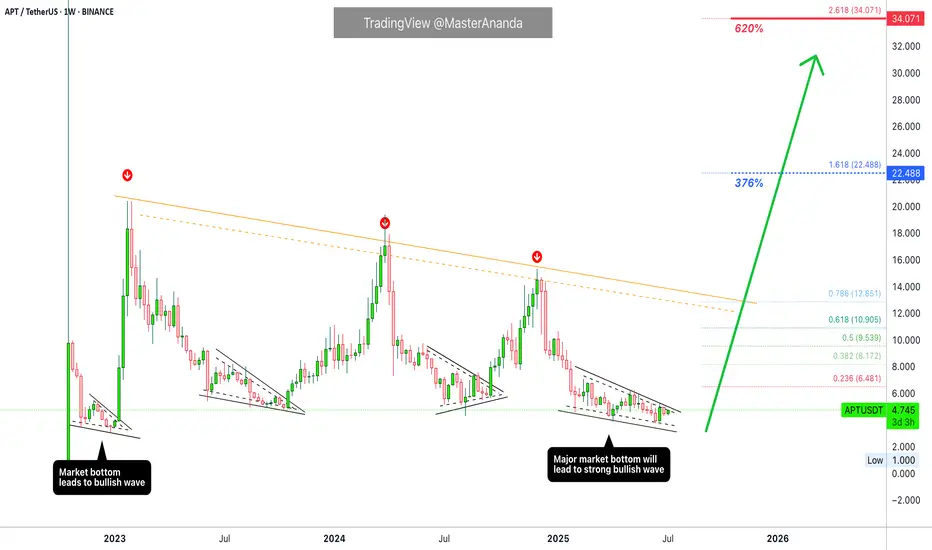
Aptos $45 Target Mapped, Ready To Boom! (PP: 867%)A market bottom leads to a bullish wave. Back in late 2022 Aptos (APTUSDT) produced a small market bottom and this led to a small bullish wave. This bottom lasted only one month in the making.
"Small" but this wave was more than 560% strong. Some 20 years holding a conventional index fund all happened here within 28 days. Cryptocurrency, it is certainly different compared to dinasourian investment products.
Present day the market bottom is a big one, it has been going for five months. This in exchange will lead to a very strong bullish wave, 3-5 times bigger than the previous one because the bottom is 3-5 times wider.
We have mainly two targets on the chart. These are easy targets and the market can definitely move higher in late 2025.
The first target is $22.5 for a nice 376%. The second target stands at $34 for a massive 620%. You can aim higher of course and if you do, you aren't likely to miss because the all-time high is $100 set on day one.
After these two targets we have $45 and this one is also mapped on the chart. 867% profits potential. You can scroll up to find it.
Remember to do your own planning. We tend to sell portions at each target on the way up. If in doubt, you don't have to be 100% right. You can sell 5%, 10% and then continue to hold. If prices rise too much and you feel uncertain, "should I hold or should I sell?" You don't have to be 100% right, again. You can sell tiny bits and you continue this process through the entire bullish wave. There are other ways to approach the market, buy and hold long-term. When prices are really high, close the position and move on.
Make sure to be you, do you and do great.
Thanks a lot for your continued support.
Namaste.
Crypto
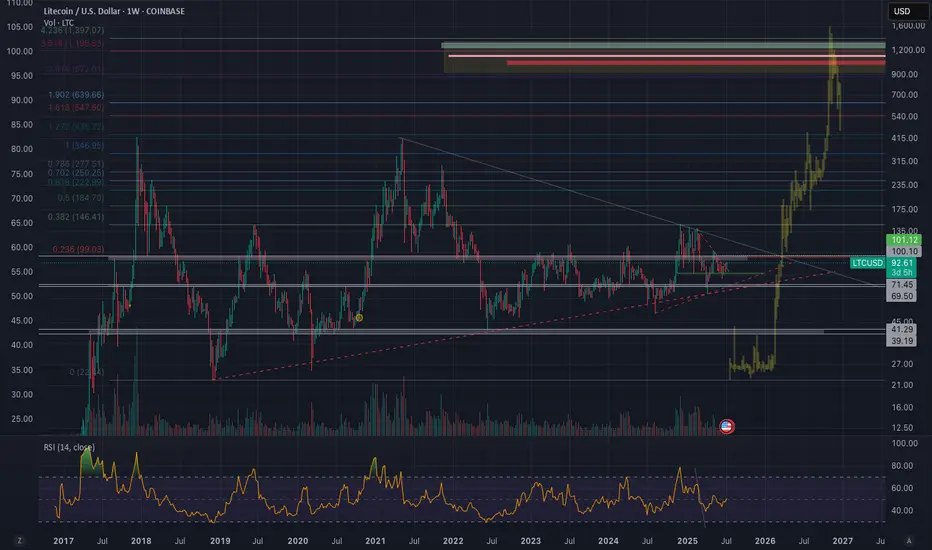
Litecoin to $1100 (12X) In This Coming AltseasonBased on tried and true fractals, multi-fib confluences, and historical price action, Litecoin is poised to hit prices between $900-1500 this cycle. The multi-fib confluences are pointing to $1100-1200 range as the most likely target. This is expected over the next 6-12 months if things continue to play out how I am expecting. As of today SEC approval of a LTC ETF is imminent but yet to be actualized.
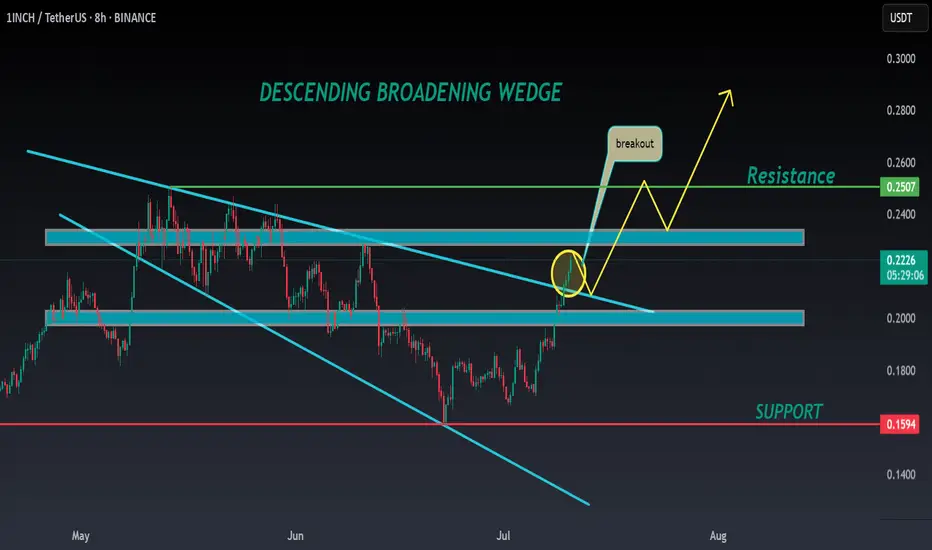
1INCH ANALYSIS🔮 #1INCH Analysis 🚀🚀
💲💲 #1INCH was trading in a Descending Broadening Wedge Pattern, give a perfect breakout and will retests the levels. If the price of #1INCH sustains the breakout then we will see a bullish move. 📈📈
💸Current Price -- $0.2220
📈Target Price -- $0.2510
⁉️ What to do?
- We have marked crucial levels in the chart . We can trade according to the chart and make some profits. 🚀💸
🏷Remember, the crypto market is dynamic in nature and changes rapidly, so always use stop loss and take proper knowledge before investments.
#1INCH #Cryptocurrency #Breakout #DYOR
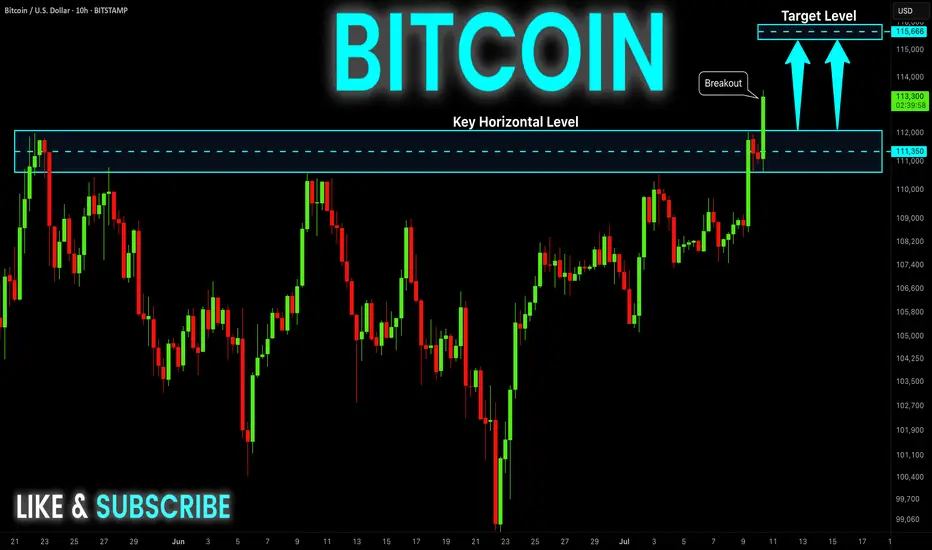
BITCOIN Epic Breakout! Buy!
Hello,Traders!
BITCOIN is trading in an
Uptrend and the coin made
An epic bullish breakout
Of an ATH level of 112k$
Which reinforces our bullish
Bias and we will be expecting
A further bullish move up
Buy!
Comment and subscribe to help us grow!
Check out other forecasts below too!
Disclosure: I am part of Trade Nation's Influencer program and receive a monthly fee for using their TradingView charts in my analysis.
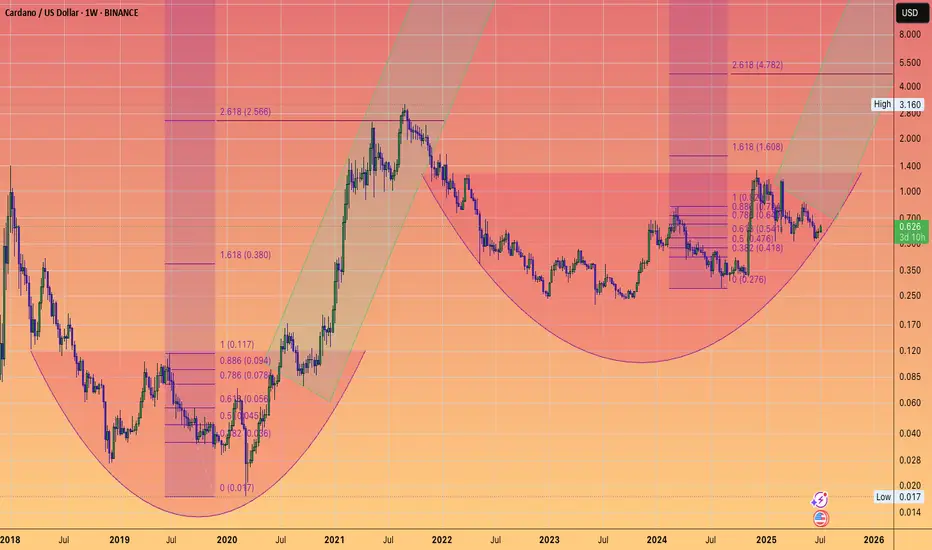
Could Cardano become a crypto unicorn?And make a 3rd new all time high in subsequent cycles.
One fib extension certainly suggests that is possible pointing towards around $4.80
Let's see ... things can mover very fast during altseason.
If you bought Kadena last cycle...you have to be DCA'ing in this zone, to give yourself a chance to exit with some gains in the upcoming pump.

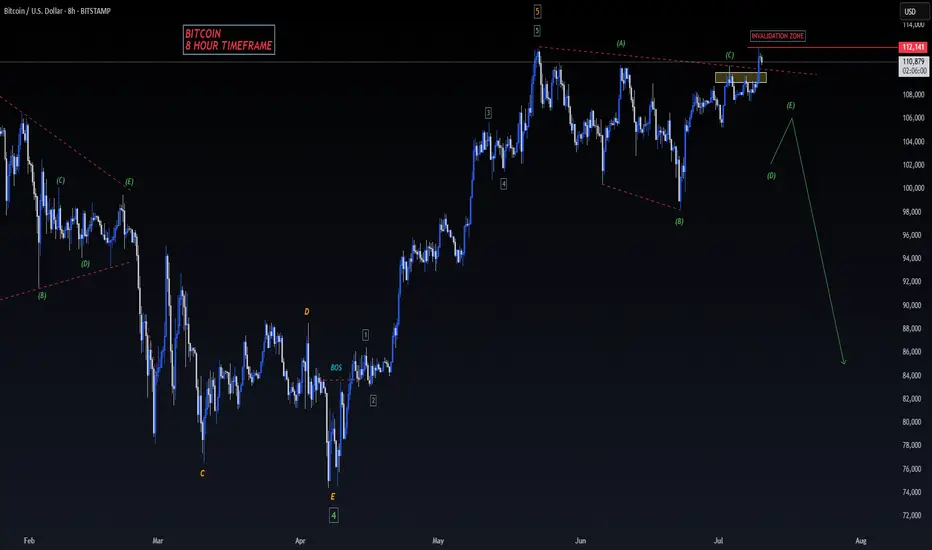
BITCOIN - SELL TO $86,000 (8H UPDATE)Bitcoin spiked up last night, but just about missed our 'Invalidation Zone' of $112,140 by a few pips. As long as this level can hold & sellers move back down, this sell analysis is still valid.
A lot of whipsaw price action in the markets right now, so use stick risk management.
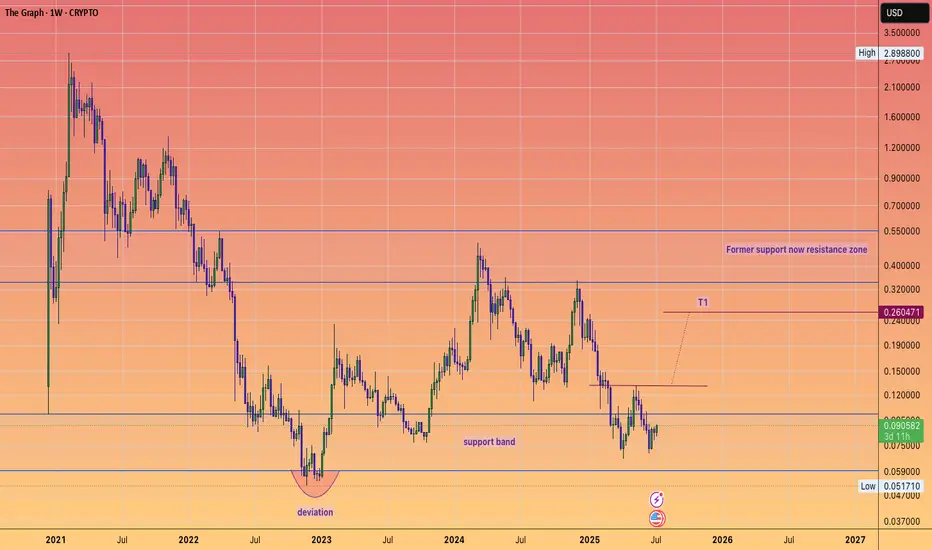
Can the Graph chart a recovery rally into resistance?Quite a few multiples if it can!
Entires in the support band represent low risk entries
(compared to last cycles elevated valuation's)
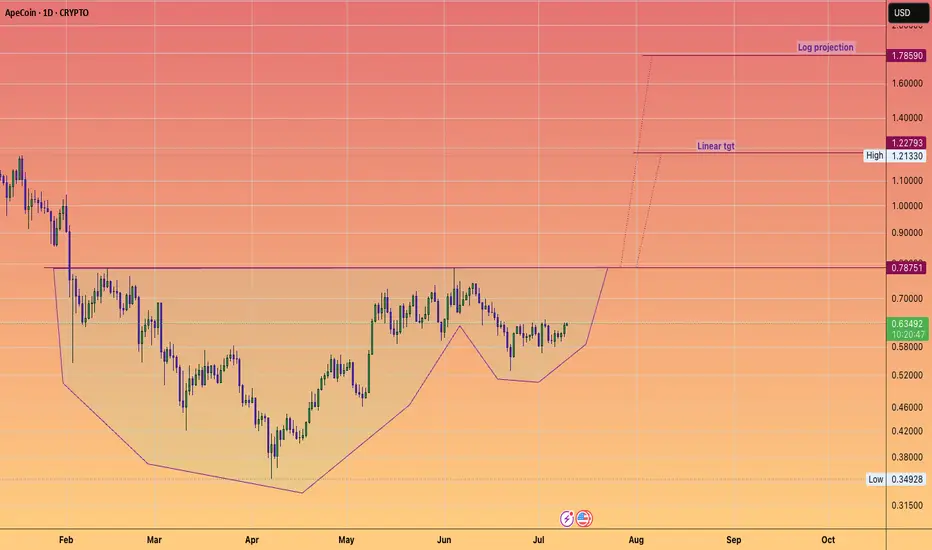
APE coin cup & Handle. This chart shows good potential as the #Alts start to take back center stage form #BTC
neckline around 79c
could be a triple if Alts can sustain an uptrend.
it's been a while
but the time is now
if it is to be the case.
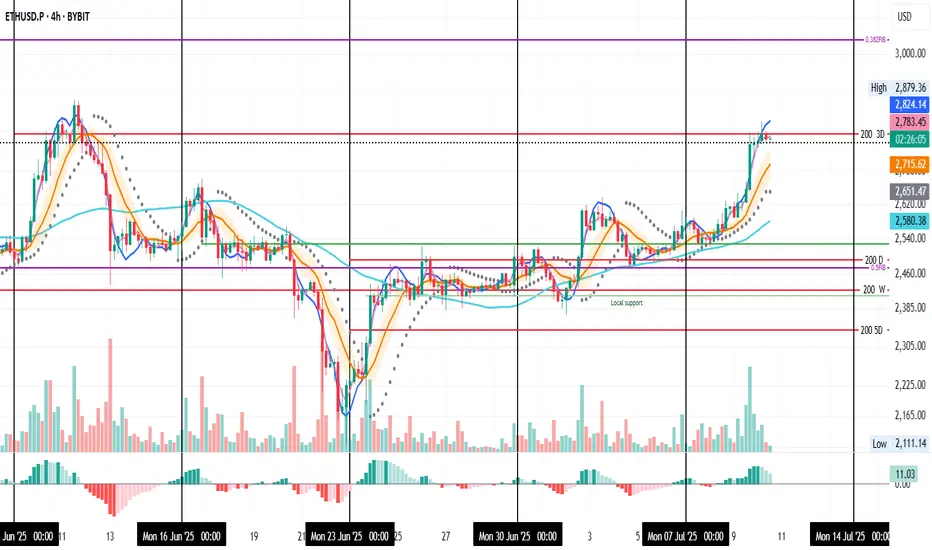
ETH Not Taking Profits Yet – System Still Long
ETH on the 4H is pausing right at the 3D 200MA, picture perfect, actually.
Now we wait to see if this resistance flips into support.
If that happens, price could go for the 0.382 Fib level around $3,040.
Of course, that’s the ideal scenario, but the market could easily contradict me, so keep that in mind.
Personally, it’s not time to take profits yet.
Both my 4H and 1D systems are still in long positions.
For extra safety, you could set a partial take-profit just under the second-to-last PSAR dot.
Always take profits and manage risk.
Interaction is welcome.
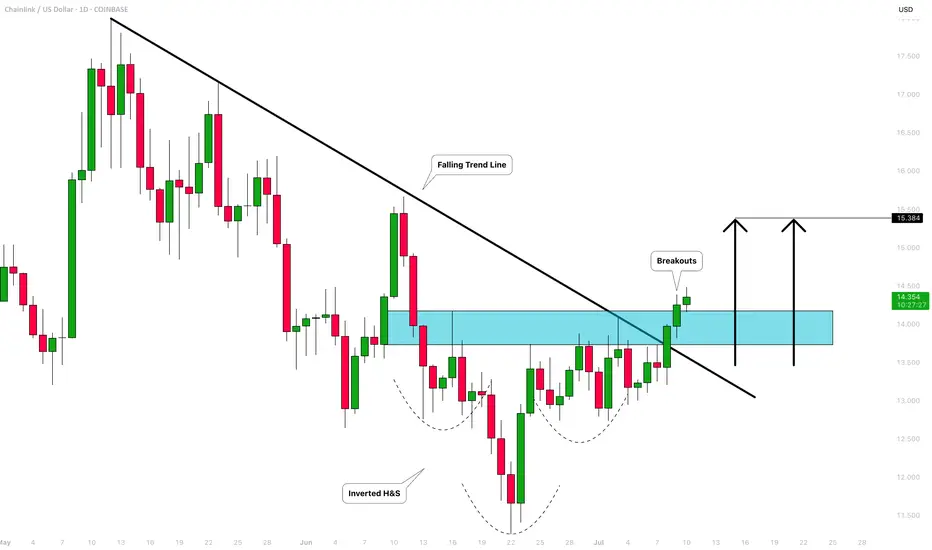
CHAINLINK (LINKUSD): Very Bullish Outlook
I see 2 strong bullish confirmations on LinkUSD on a daily time frame.
The price violated 2 significant structures: a vertical falling resistance - a trend line
and a neckline of an inverted head & shoulders pattern.
With a high probability, the market will rise more.
Next resistance - 15.38
❤️Please, support my work with like, thank you!❤️
Ethereum & monthly 20MAEthereum is gaining strength and will likely break above the monthly 20 MA. Will it maintain this momentum by month's end and remain bullish in the coming months?
Good luck HODLRS ✌️🤞

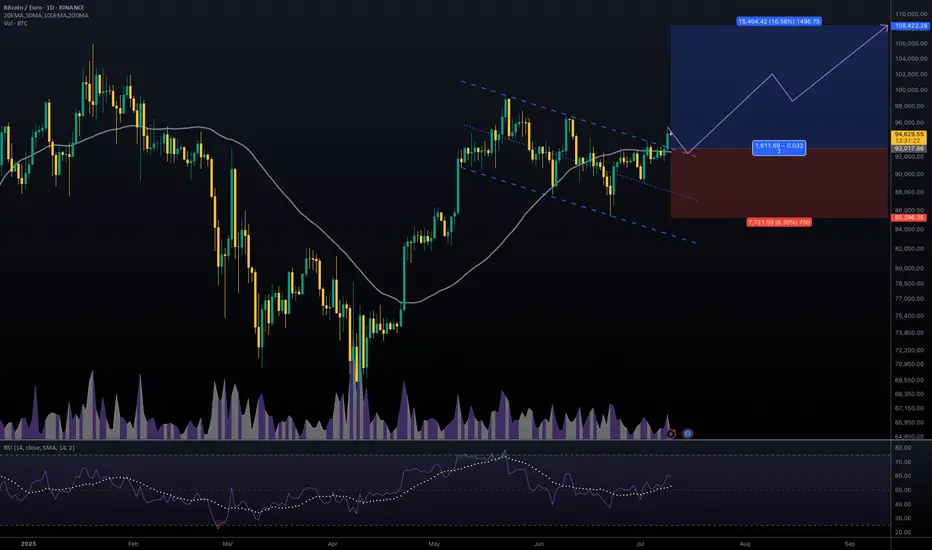
#BTCEUR #1D (Binance) Bull-flag breakout and retestBitcoin looks very good for bullish continuation after regaining 50MA support on daily, against the Euro.
⚡️⚡️ #BTC/EUR ⚡️⚡️
Exchanges: Binance
Signal Type: Regular (Long)
Amount: 12.0%
Entry Targets:
1) 93017.86
Take-Profit Targets:
1) 108422.28
Stop Targets:
1) 85296.36
Published By: @Zblaba
CRYPTOCAP:BTC BINANCE:BTCEUR #Bitcoin #PoW bitcoin.org
Risk/Reward= 1:2.0
Expected Profit= +16.6%
Possible Loss= -8.3%
Estimated Gaintime= 1-2 months
HolderStat┆BTCUSD fixed above the triangleBINANCE:BTCUSDT is rebounding from a consolidation base at $106,000 with strong bullish structure. The triangle breakout and recent higher lows point toward a move to $115,000–$120,000 if momentum continues.

HolderStat┆ETHUSD retest of the resistance lineBINANCE:ETHUSDT has exited a falling wedge and is forming a bullish continuation pattern. With price action building above $2,500, a breakout toward $2,800 is in play, targeting the supply zone around $3,000. Structure favors bulls.

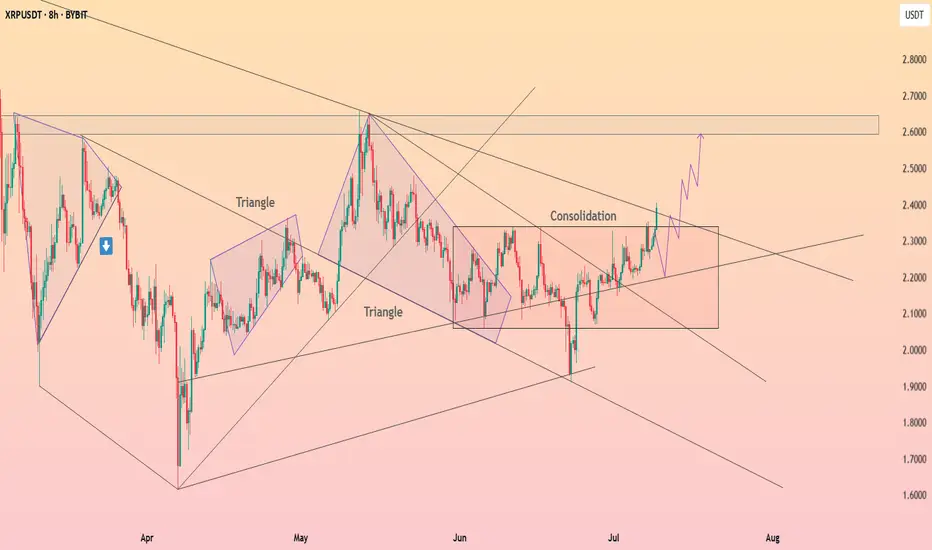
HolderStat┆XRPUSD got out of the consolidation areaBYBIT:XRPUSDT is building strength within a wide consolidation range after multiple triangle breakouts. Price is eyeing the 2.60 level, and structure suggests bulls are preparing for the next push.
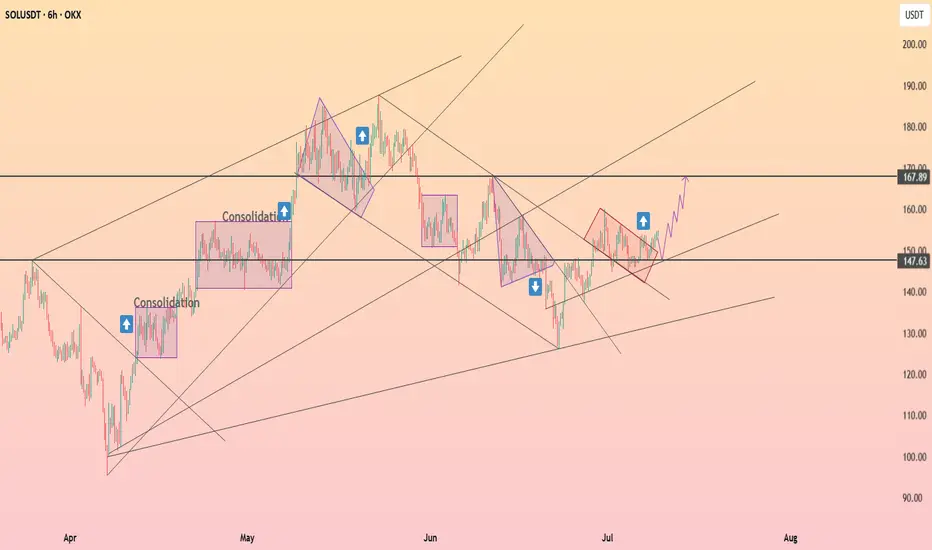
HolderStat┆SOLUSD held the support lineOKX:SOLUSDT is consolidating above 147.63 inside a rising channel. Bullish continuation is likely, with 167.89 acting as the next key resistance. Historical patterns suggest a breakout is forming.
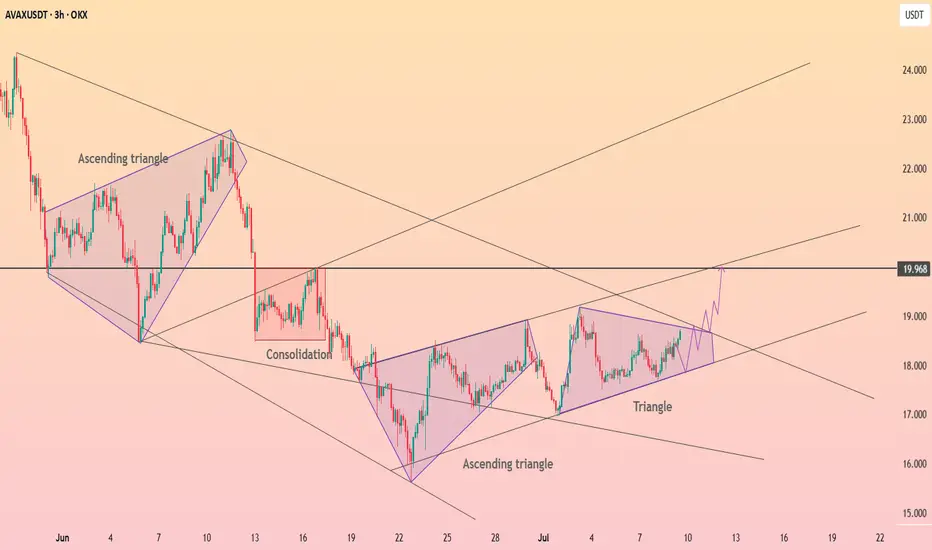
HolderStat┆AVAXUSD seeks to the $20OKX:AVAXUSDT is coiling inside an ascending triangle with resistance at 19.96. If this level is broken, price may rally toward 21.00 and beyond, supported by strong structure and repeated bullish formations.
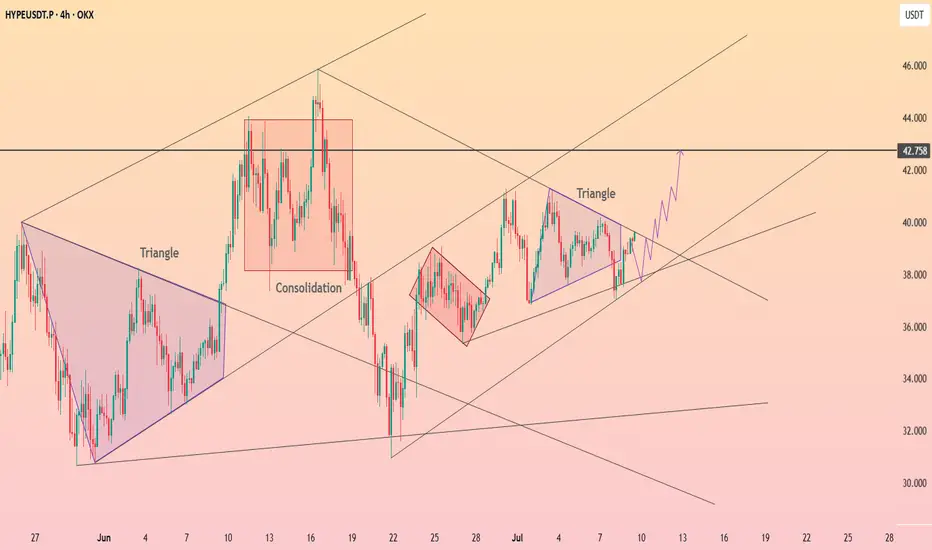
HolderStat┆HYPEUSD back to the trend line$OKX:HYPEUSDT is breaking out of a triangle formation, continuing a sequence of bullish consolidation and triangle patterns. Price is targeting the upper channel line near 42.75, with the structure supporting continued upside momentum.
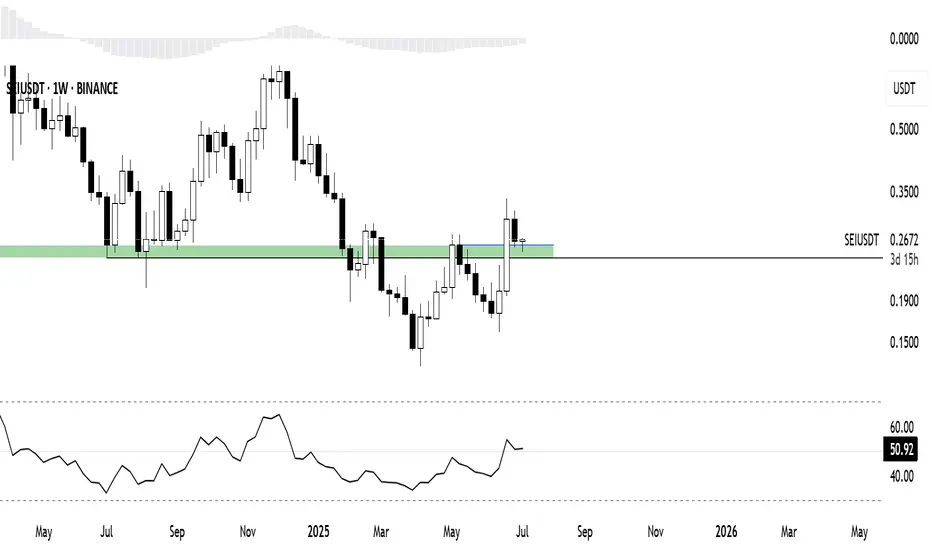
Recently Circle launched native USDC & CCTP on $SEIThis enables fast, low-cost stablecoin transfers on the efficient L1 blockchain, boosting liquidity and institutional adoption
This news made me curious about the chart
The price itself is reclaiming and holding a critical HTF level while breaking the bearish structure
The RSI above the 50 level is signaling a regaining of the bullish momentum
Perfect alignment to grab some for the longterm portfolio
EUR/USD (Euro / U.S. Dollar) 2-hour chart analysis.EUR/USD (Euro / U.S. Dollar) 2-hour chart analysis, here's the breakdown:
---
📈 Chart Setup Observations:
The pair is showing a bullish breakout from a descending triangle or falling wedge pattern.
Price is above the Ichimoku Cloud, suggesting a potential shift to bullish momentum.
There are two clearly marked target points on your chart.
---
🎯 Target Levels:
1. Target Point 1 (TP1): Approximately 1.78000
2. Target Point 2 (TP2): Approximately 1.18300
---
🔰 Support Zone / Potential Stop-Loss:
Around 1.17200, where recent consolidation and trendline support can be seen.
---
✅ Summary:
If the bullish breakout holds and momentum continues, the pair could reach:
TP1: ~1.78000 (short-term target)
TP2: ~1.18300 (medium-term target)

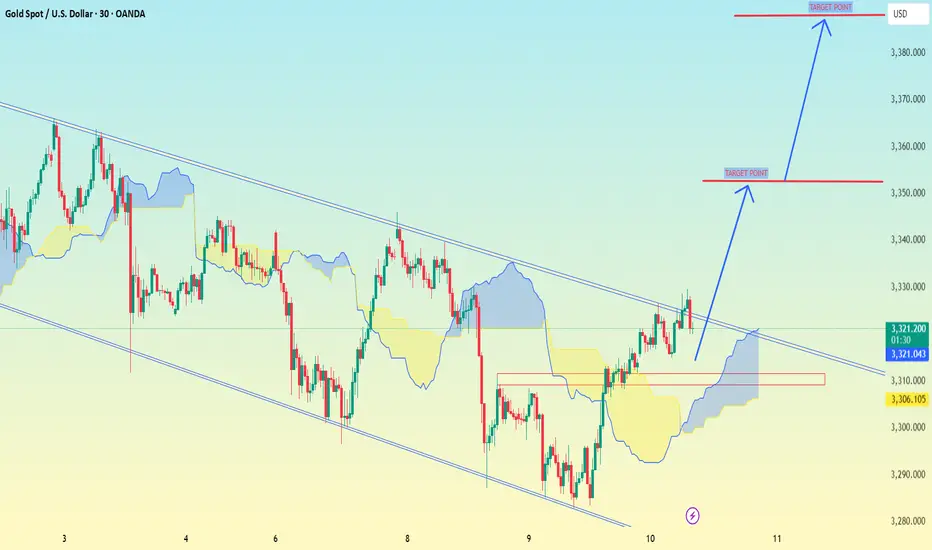
XAUUSD (Gold Spot / U.S. Dollar) on the 30-minute timeframe.XAUUSD (Gold Spot / U.S. Dollar) on the 30-minute timeframe,
📈 Key Observations:
The price has broken out of a descending channel to the upside.
There is Ichimoku Cloud support below the breakout, indicating potential bullish momentum.
Two bullish target levels are marked with arrows and horizontal red lines.
🎯 Target Levels:
1. First Target (TP1): Around 3,350.000
2. Second Target (TP2): Around 3,390.000
These targets are based on the visual structure and the projected breakout move.
🛡 Support Zone (Possible Stop-Loss):
Near the 3,300.000 level — this is the last consolidation area before the breakout, and it's also aligned with the lower Ichimoku Cloud boundary.
---
⚠ Note:
Always manage your risk and consider fundamentals or major news events, especially with commodities like gold.
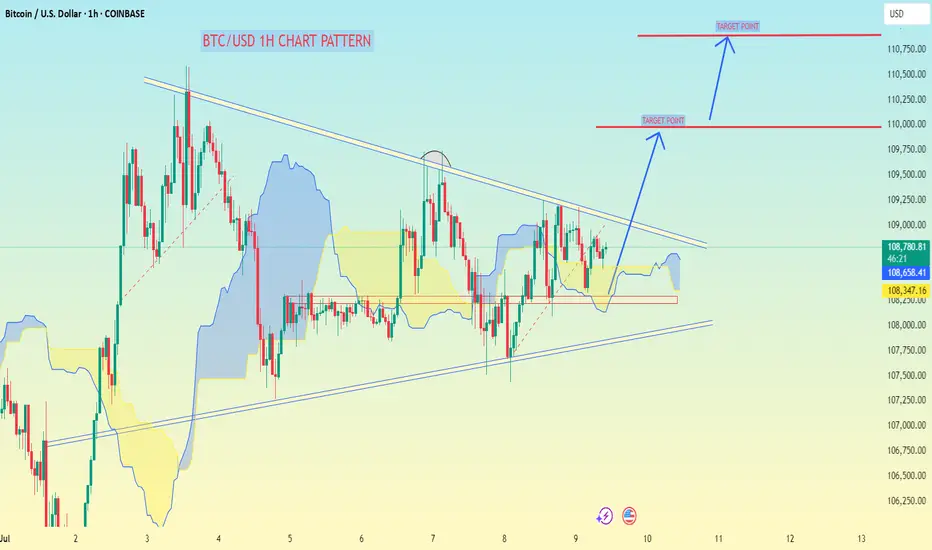
BTC/USD 1H chart Pattern.BTC/USD 1H chart I shared, the chart shows a bullish breakout pattern forming (likely a symmetrical triangle breakout).
Target Points Identified:
1. First Target:
📍 109,750 USD
2. Second Target:
📍 110,750 USD
---
Key Notes:
Breakout above the descending trendline signals a bullish move.
Ichimoku cloud is thinning, suggesting possible momentum if price breaks upward.
Make sure to confirm the breakout with strong volume.
Let me know if you want stop-loss levels or a detailed trade setup.