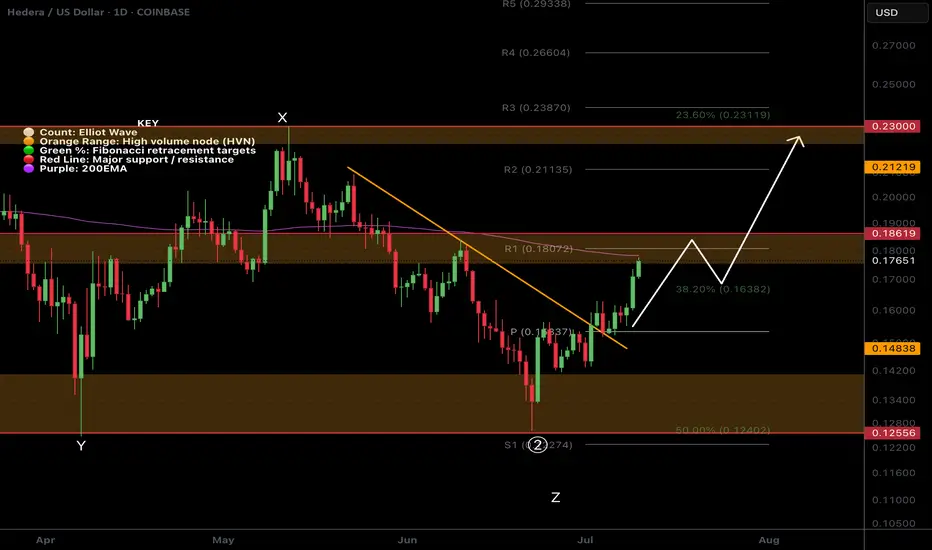
$HBAR Resistance at daily 200EMA!CRYPTOCAP:HBAR analysis continues to play out but should consolidate for a while before moving to the next target at $0.22.
This area should be tough resistance as its the daily 200EMA and major High Volume Node resistance and R1 daily pivot.
The CRYPTOCAP:HBAR signal has now hit take profit #1 from my Trade Signals Substack posted last week.
Safe trading
Crypto
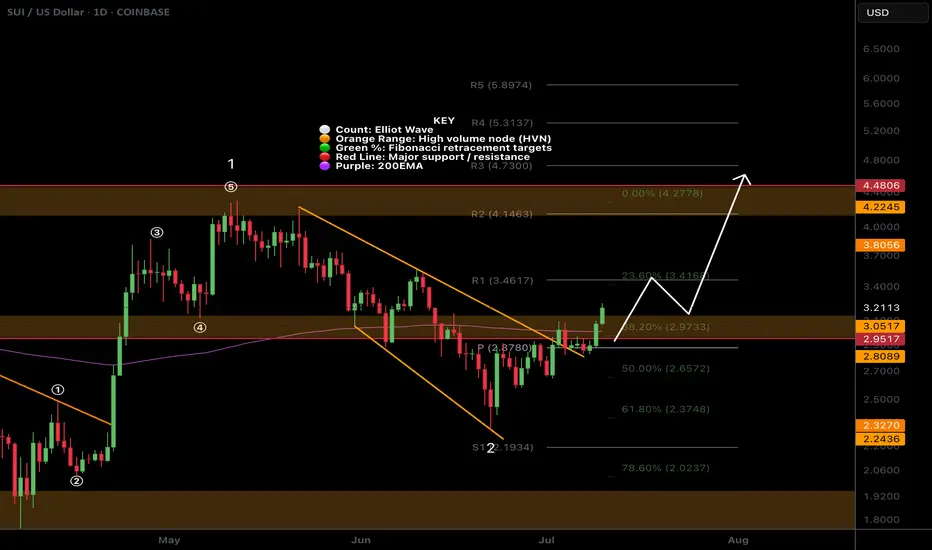
$SUI Big Breakout Happening?CRYPTOCAP:SUI is smashing above triple resistance: a major High Volume Node , daily 200EMA and the daily pivot. The signal I posted in my trading signals Substack is now live, and the HBAR one is about to hit take profit 1.
Target for this rally remains $4.2 High Volume Node near the swing high.
Analysis is invalidated below the daily pivot at $2.8
Safe trading
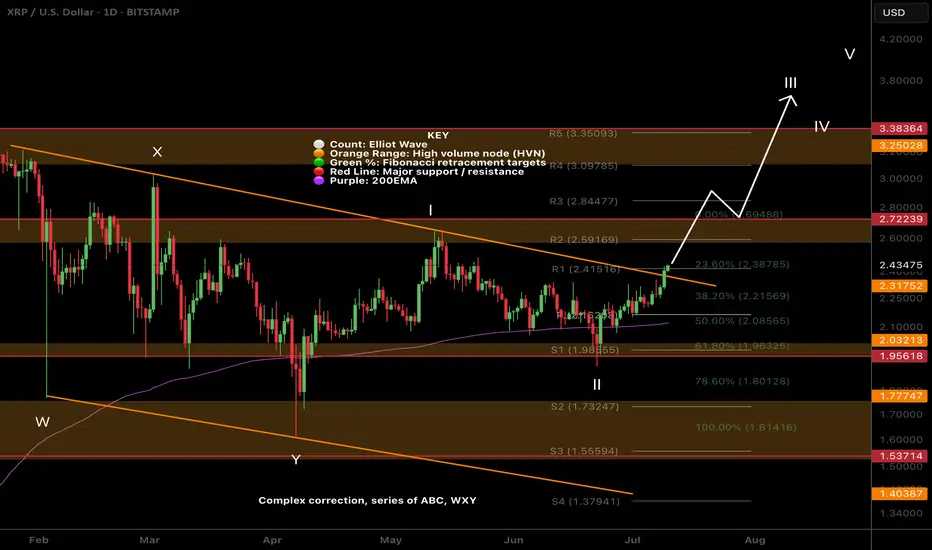
$XRP Bias Change: Bullish Elliot Wave CountCRYPTOCAP:XRP is breaking out the descending resistance causing me to take another look at my WXYXZ corrective Eliot Wave count expecting lower. I have adjusted the count to WXY and a 1-2 new motif wave with a target of $3.8
Price is well above the daily 200EMA and daily pivot after testing both as support including the High Volume Node. Closing above the descending resistance today will be a bullish signal but a retest of that resistance as support before continuing onwards its what to look out for.
Analysis is invalidated below $1.8
Safe Trading
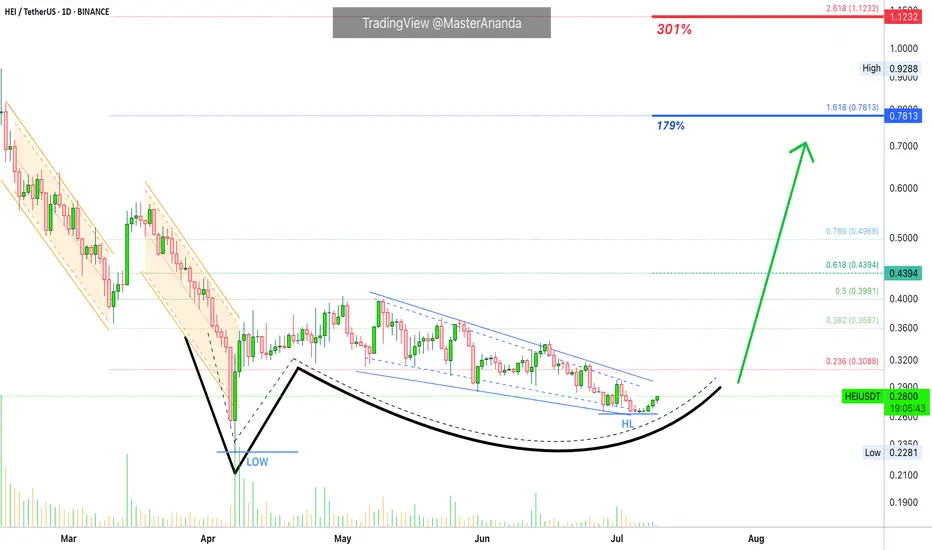
Heima Bullish Breakout, Easy 179% PP Short-Term (L-HL)The chart isn't giving us much so I will not go into technical analysis; but this is a bullish setup, one that has the potential to break-up just as Hyperlane did. If you are unaware, HYPERUSDT just grew ~200% in a matter of hours... The altcoins market is starting to heat up.
Here we have Heima, a new project.
There is a big A&E bottom formation. The 7-April low is very pronounced. There is also the classic L vs HL. The ending diagonal is a bullish pattern as well and the action is reaching the apex, a breakout can happen anytime.
179% profits potential short-term.
Try to avoid using your rent money to trade, it can lead to disaster. Just a friendly reminder. Use only money that you can afford to lose.
This chart setup is low risk. Everything spot is very low risk. The risk is only as much as you define or allow. You can cap it at 5%, 10%, 20% or any amount you want. Easy buy and hold. The expectation is for a fast-strong move. Buy, sell, collect profits move on to the next trade. That's what we mean by short-term.
Loses are inevitable. Wins as well.
Win big, lose small. It will lead to success.
Follow a plan. Develop the habit of winning. If you can win, win, win. Win small; eventually you will win big. Step by step. Persistence and consistency.
Thank you for reading.
Namaste.
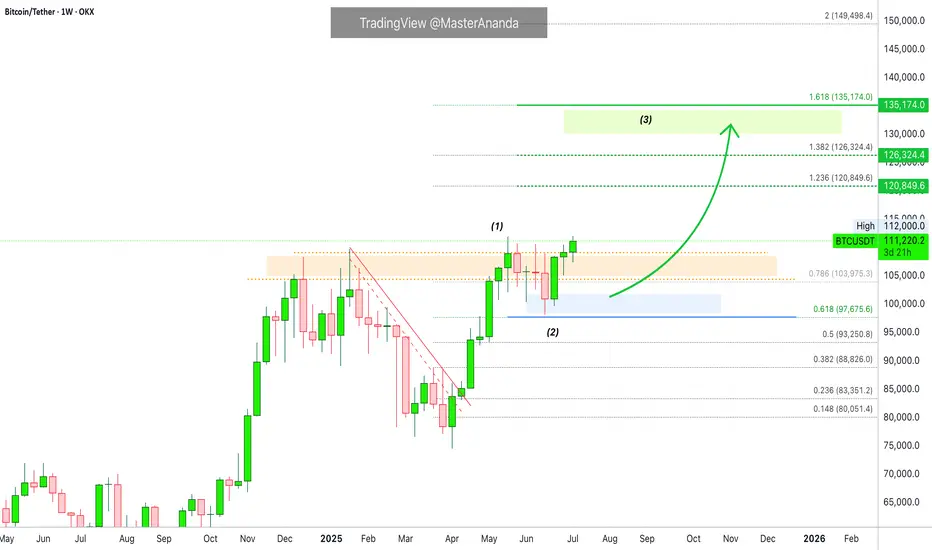
Bitcoin's New All-Time High = Altcoins Market Bull MarketThe shy new all-time high is in and it is good to be Bitcoin today. It is good to be Bitcoin, to be in Bitcoin and profit while trading Bitcoin but the bears got rekt and that's oookkkk. We accept their loss and it is their loss they earned it by being short when the market is good, bullish and strong. Who would short Bitcoin right before a new all-time high? I don't know.
A new all-time high was hit today, the price $112,000 but this is not the end. Not even close. This is the beginning of the next bullish wave.
I know what you are thinking, or might be thinking; Wait, but what about a drop? What about the correction? Will it go lower? Can I buy Bitcoin at 90K? I told you to buy when prices were low... "You would look like a genius for buying below 80K," 100K is already gone. No, no correction! Bitcoin is going up.
When resistance breaks it means higher. When prices move higher it means higher. When a new all-time high hits it means the bulls win. Now that the bulls won, the battle for the rise or the drop, we can expect higher prices. If you have any doubts, look at the altcoins. The altcoins market says we are entering a period of long-term growth.
Bitcoin will continue to hold strong. It will continue to rise surely, slowly, or fast, but long-term. It doesn't matter the speed; Bitcoin for the whales, altcoins for retail.
A small capital will grow faster with the altcoins because they have higher room for growth. The projects being smaller, more volatile makes for a good trading experience. Higher risk but also a higher opportunity to grow in the short- and mid-term. Bitcoin is good to retire now. Bitcoin is great to hold value, to support the market as it continues to grow.
For me and for you, welcome to the altcoins market bull market.
Thanks a lot for your continued support.
Namaste.
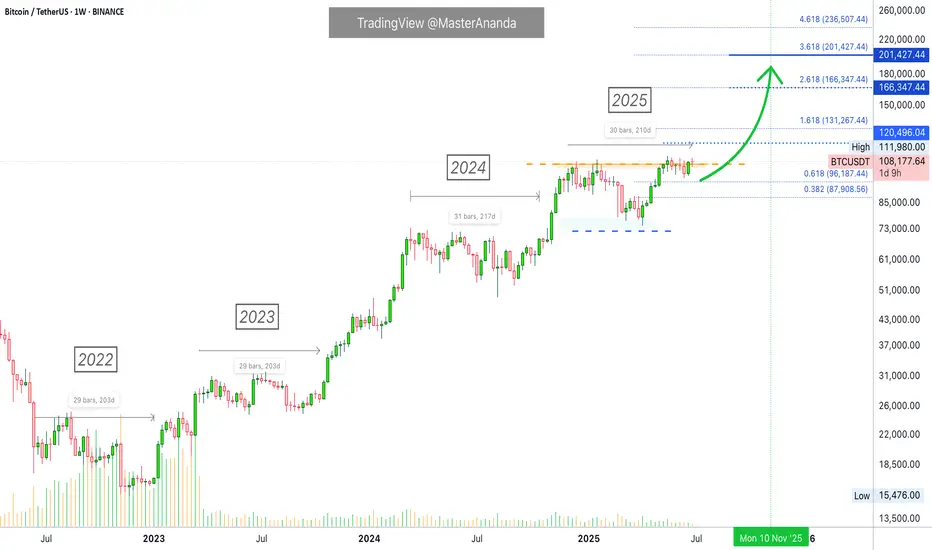
Bitcoin's Consolidation Almost Over —200-220 DaysBitcoin's consolidation period before a bullish breakout tends to last some 200-220 days on average. We have four instances of this pattern since the 2022 bear market counting 2025. Let's look at those. This proves that Bitcoin is set to grow in a matter of days. Continue reading below and make sure to boost. When you reach the end of the article leave a comment with your opinion about this issue. Do you agree? Do you disagree? Can you see what I mean?
» Back in 2022 Bitcoin consolidated for 203 days before a bullish breakout.
» Back in 2023 Bitcoin consolidated for 203 days before a bullish breakout.
» Back in 2024, last year, Bitcoin consolidated for 217 days before a bullish breakout.
It really depends on where you start counting for the total days but it all adds up to 200-220 days. With 220 being the maximum.
» Currently, in 2025, Bitcoin has been consolidating for 210 days. Looking at previous patterns, this means that only a few days are left before Bitcoin produces a bullish continuation.
We also saw that once Bitcoin breaks out of a this long-term consolidation range/period/phase, it never moves back to the lows of the consolidation range. That is, Bitcoin will never trade below 80K nor 90K once it resumes growing.
I am estimating that the next jump can start as early as next week. The entire move can take months to develop. After a peak is reached, Bitcoin will then start a new consolidation phase with a bearish bias first. This bearish bias produces a low after several months yet a strong higher low compared to the previous consolidation period which is current prices. After this low, more consolidation and then a new bullish jump.
If we take into consideration a bear market, then the dynamics can be different. Bear markets only happen once every four years. Seeing how different market conditions are now, the next bear market will be interesting because it won't be anything like the bear markets of the past. Bitcoin will remain much stronger but that is an analysis for another time.
Summary
Bitcoin is going up. It is very close now. When Bitcoin breaks up and hits a new all-time high, just to continue growing, the altcoins market will explode. You've been warned.
Now you can leave your comment.
Share your opinion on the comments section below. I know you have something to say. You've been trading Cryptocurrencies for years, buying and selling, making profits so... Are you ready for the 2025 bull market?
Thank you for reading.
Namaste.
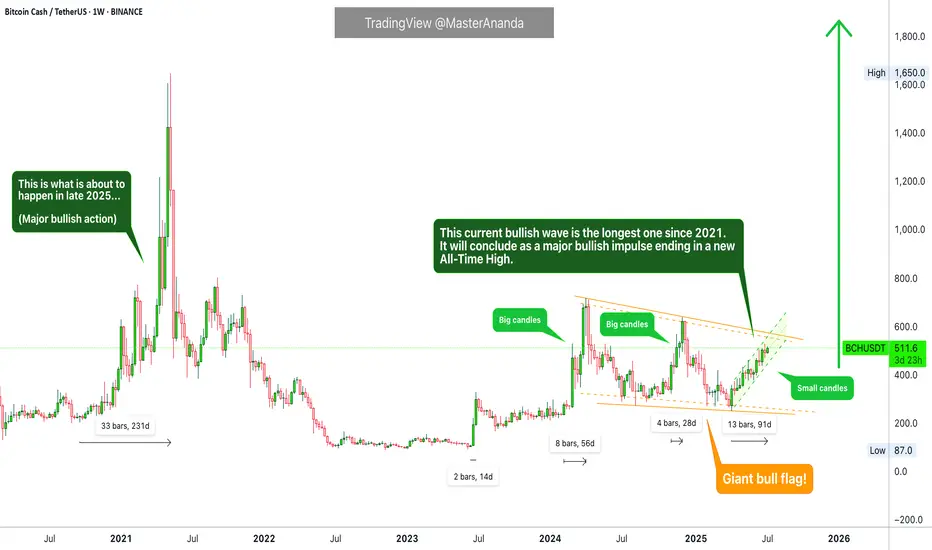
Bull Market Action Exposed—Bitcoin Cash Growing 91 Days Non-StopWhat we are seeing now is very different compared to the past. If you look at early 2024 the rise was composed of strong big candles, always fast as if in a hurry. Very strong growth. If we go further and consider late 2024, we got a lower high but still very big candles. Fast forward to present day 2025, and we have a perfect uptrend, prices rising week after week after week with relatively small candles, some medium-sized but not as big as before. This is bull market action.
In the past, the candles were really big because the bullish action was soon to end, it wasn't expected to last a long time and thus everything needs to be accomplished fast. Things are different now. The fact that we have slow and steady growth is good news. Since the market is going to be growing for a prolonged period of time, the candles are smaller.
Don't be fooled by current price action, it all ends up in a major bull-run. While the candles are small now you can take it as bullish consolidation. Prices are growing but this is still a sort of accumulation/build-up phase. Everything is building up to a very strong climax with new all-time highs all-across and then some more.
Bitcoin Cash has been growing straight up for 91 days. In June 2023, Bitcoin Cash produced only two weeks green. Back in late 2024 all the growth happened in 28 days. Early 2024 56 days was all that was needed and then the market turned red. This is the longest stretch of continued growth since 2021... Yes, the previous bull market. You are witnessing bull market action.
Thanks a lot for your continued support.
Namaste.
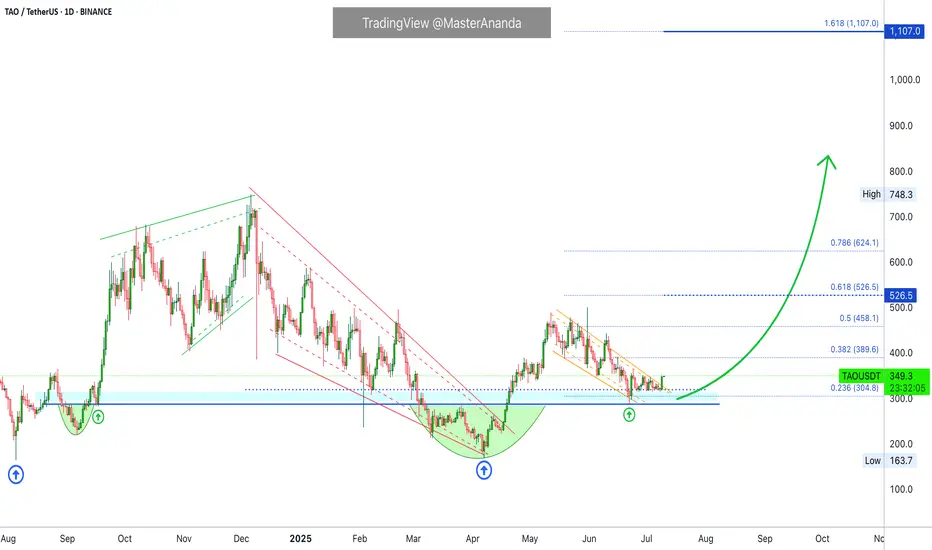
Bittensor Goes Bullish · $1,107 Price Target Within 6 MonthsHere is a very interesting piece of information. The same 22-June low worked as support back in September 2024. Needless to say, the test of this level propelled a major bullish phase. Conditions are similar now, not the same but similar. Bittensor is stronger now compared to late 2024, so we can expect the bullish wave that follows also to be stronger and thus a $1,107 price target mid- to long-term. Within 3 to 6 months.
Today we have a bullish breakout from the current structure with confirmation of long-term support and the higher low. TAOUSDT is now entering a new wave of growth. This is a long-term event, this wave should last all through 2025 and possibly beyond.
You can find additional details on the chart.
Leave a comment if you have any questions. Follow if you enjoy the content and would like to see more.
Namaste.
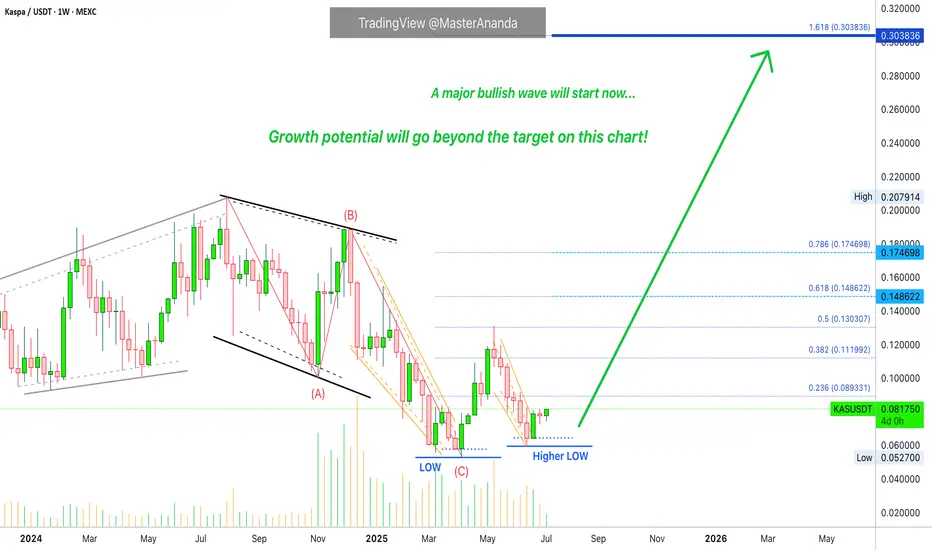
Kaspa Bullish · The Wait is Over · Ready to GrowWe have a very interesting situation here with the Kaspa chart, KASUSDT. There is no going back. Once the bottom is in, you know the next logical step is a change of trend. It can take some time before the low settles; the low is process not a one-day event. But here it settled already and this is all we need to know that the bullish bias is fully confirmed. You can now enter KASUSDT with lev while resting easy.
Good evening my fellow Cryptocurrency trader, I hope you are having a wonderful day.
The first low happened 10-March and then a lower and final low 7-April, also a technical double-bottom. Here Kaspa produces a small reaction and grows 150%. Notice that growing 150% in 30 days is small in the Crypto-world. If you were trading conventional markets, you would have to wait 10 years to get 70% growth.
Anyway, the initial bullish reaction to confirm the end of the correction goes into retrace and 16-June (the week), 22-June specifically, the market produces a higher low. This is the final retrace before maximum growth. I mean, there will be retraces and corrections in the future but the wave that is about to start now will not be 150%, it can be much bigger and last a lot longer, this is the 2025 bull market bullish phase. It will be a major wave.
This is just a friendly reminder to let you know, you can go all-in.
Thanks a lot for your continued support.
You will be happy with the results.
Namaste.
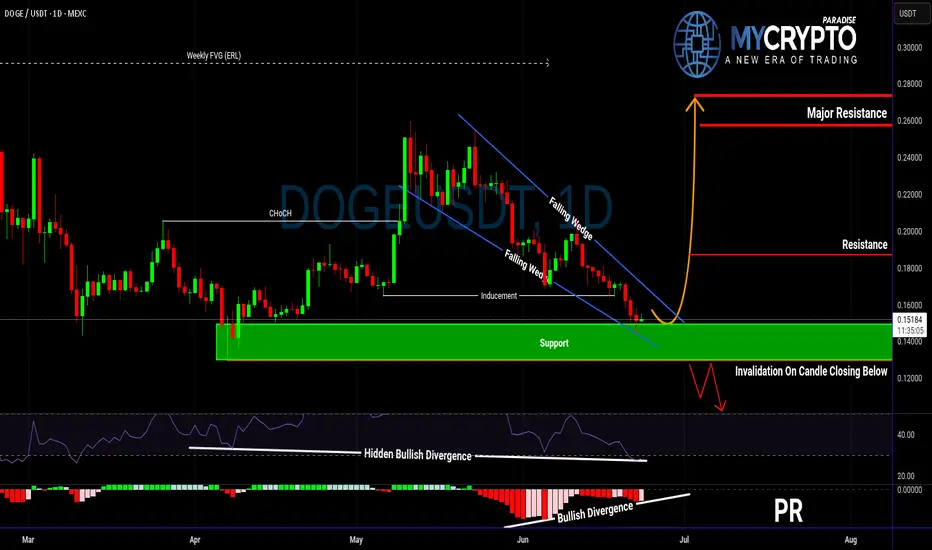
Is DOGE About to Explode or Collapse?Yello Paradisers! Are you ready for what could be DOGE’s most explosive move in weeks? DOGEUSDT is currently developing a very interesting bullish setup that deserves attention.
💎The pair has formed a falling wedge — a pattern that often precedes a breakout to the upside. This comes right after a confirmed bullish Change of Character (CHoCH), indicating that buyers are quietly stepping back in.
💎Even more important, we’ve seen a classic inducement grab, meaning early liquidity has been taken out, clearing the way for a potential real move. On top of that, there’s hidden bullish divergence on the RSI and clear bullish divergence on the MACD. This combination of signals significantly increases the probability of a bullish reversal from the current support zone.
💎If DOGE prints a convincing bullish candlestick pattern at these levels, it could offer a high-probability long opportunity with a strong risk-to-reward ratio. But be careful — if the price breaksdown and closes candle below this key support, the bullish scenario becomes invalid, and it’s better to wait for a more favorable structure to develop.
Strive for consistency, not quick profits. Treat the market as a businessman, not as a gambler. This is the only way you will make it far in your crypto trading journey. Be a PRO.
MyCryptoParadise
iFeel the success🌴
BTC makes new all time highs!Crypto has been soaring today.
Ethereum and BTC pumping liquidity!
Fed minutes came out today around 2pm, indicating rate cuts at next meeting and throughout the rest of the year and crypto absolutely loved that.
Crypto thrives in a cheap liquidity environment, rallying in potential rate cuts.
We took profits on IBIT calls - still holding longs in the BTC market expecting higher price.

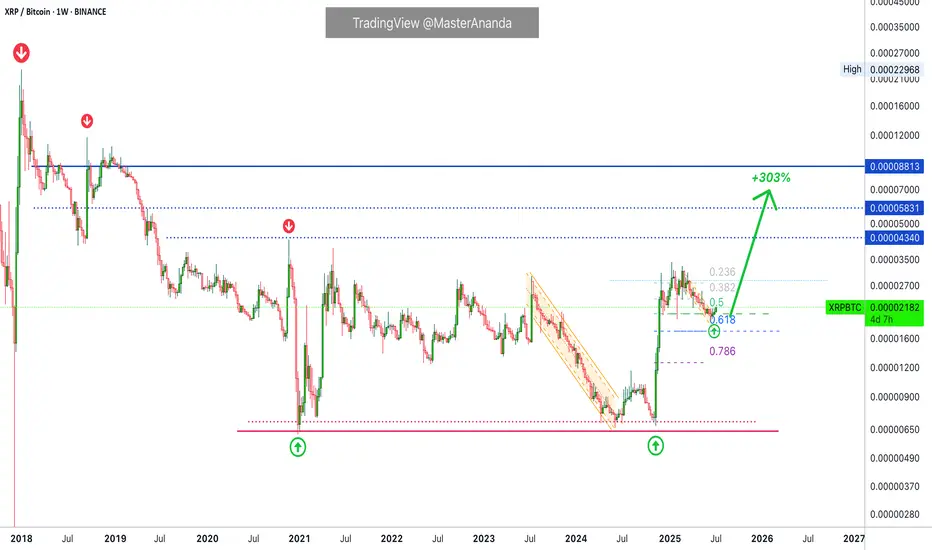
XRPBTC 303% Bullish Wave in the Making (Or Higher)One of the most unique charts in the entire Cryptocurrency market, XRPBTC produced very little retrace after its major late 2024 bullish breakout and recovery. This small retrace is a signal of strength. When prices produce a strong advance but fail to move deep once the advance is over—consolidation happening at high prices—this is one of the strongest signals the market can offer.
XRPBTC started at a low of 674 satoshis in mid-November 2024. The peak happened two months later at 3419 satoshis. Mid January 2025. Now, the retrace lowest point in June was 1928 satoshis. This is 185% higher compared to the November 2024 low, that's what I mean by strength.
The fact that there wasn't strong selling pressure after a 400% bullish wave, signals that participants are ready to hold long-term. And this is a great choice, people are smart. They are holding because they know XRP will continue to grow.
When it comes to Fibonacci retracements, the correction found support right at 0.5. When the market is weak, it tends to move below 0.618 and reach 0.786 or lower before recovering.
The rounded bottom is already in and the candles are starting to curve. Three weeks green, we can expect XRPBTC to produce a new wave of growth. The targets can be found on the chart.
Namaste.
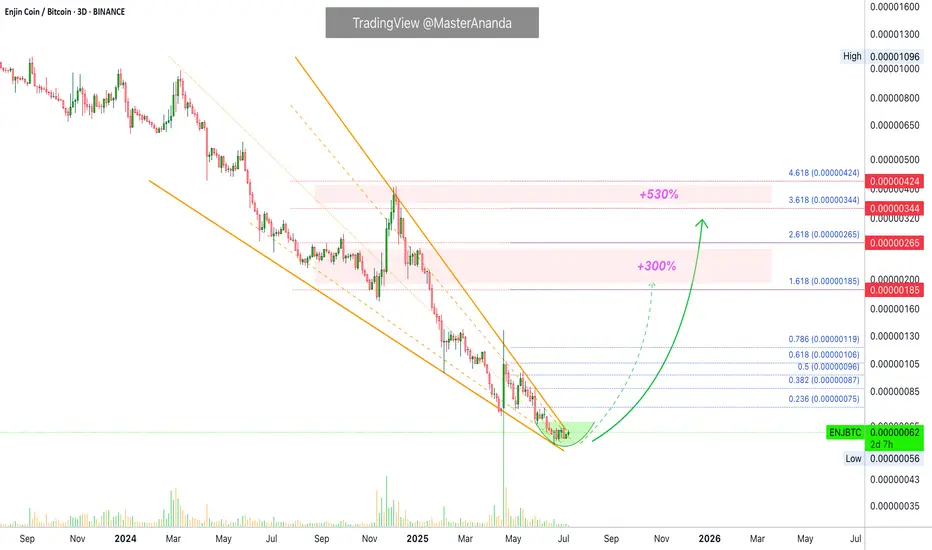
ENJBTC 2017, 2019, 2021 & 2025 (530% Easy Target)This is another interesting BTC trading pair—ENJBTC. I am only showing a portion of the chart, the bottom and falling wedge pattern but the decline has been happening since November 2021.
There have been three bull markets on this pair: Late 2017, 2019 and 2021.
» In late 2017 ENJBTC grew 1,622% in 68 days.
» In the 2019 bull market, ENJBTC grew 1,199% in 206 days. The meat of the move happened in 116 days.
» In 2021, the most astonishing Cryptocurrency bull market ever, until 2025 that is, ENJBTC grew 1,756% in 96 days. It took an additional 231 days for a double-top and the final all-time high. From bottom to top the 2021 bull market produced 2,180% growth in 327 days.
Now we are looking at a completely different situation. The longest bear market ever and a true all-time low are now present on the chart. The mapped targets are super easy, 300% and 530%, ENJBTC can grow so much more in the coming months. You can aim for 1,000% or higher.
This is just a friendly reminder, so that you can enjoy great timing and entry prices.
Thank you for reading.
Namaste.
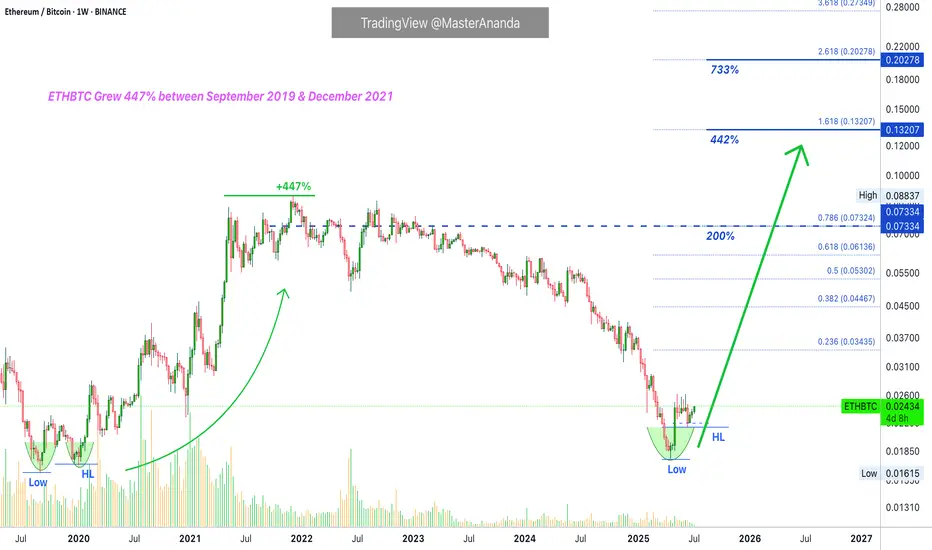
ETHBTC Opportunity Buy: Major 2025 AltcoinSeason & Bull MarketThis is the big one and the good one. ETHBTC was bearish since December 2021 but this cycle finally came to an end in April this year. After the initial bullish breakout and higher low we can clearly see some bullish action developing; three consecutive weeks green. The bullish bias is now confirmed. It is still early.
We are looking at 200% potential. The "back to baseline" target. This is a price range where ETHBTC traded sideways as part of a distribution phase for more than two years. This is a must-to-be-tested resistance zone and thus opens up a sure 200% profits potential for this newly developing bullish wave.
Ethereum's ETFs are coming, Bitcoin already has its ETFs. This can mean Ethereum outperforming Bitcoin, and many altcoins, in so many ways. This also opens up the potential for a new all-time high on this pair.
The same sequence of 'low-higher low' happened in the last bull market. ETHBTC hit bottom in September 2019 then produced a higher low and this signaled the start of a major, long-term 447% rise. The conditions are similar now but the rise will be faster.
We have two main targets for the all-time high in late 2025 or early 2026.
1) 0.13207. With 442% profits potential from current price.
2) 0.20278. With 733% profits potential.
The entire bullish cycle for this pair can unravel within 4-6 months. If it becomes extended, it can last one year or longer. Both scenarios are possible.
It is 100% certain that ETHBTC will go on a major bullish cycle together with the rest of the altcoins market. Bitcoin will also grow.
Thanks a lot for your continued support.
If you are bullish on Crypto, comment below.
Namaste.
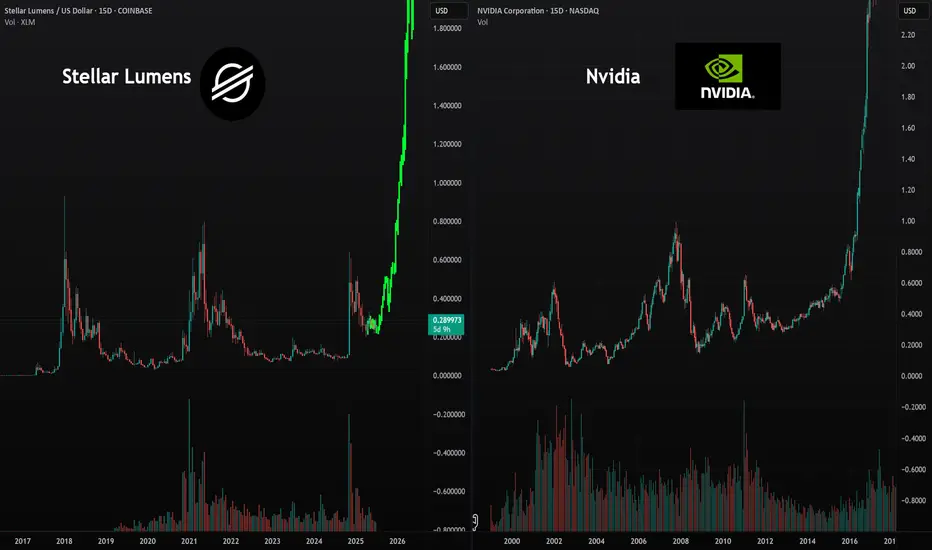
Stellar Lumens Looks Ready for Blast-Off!There is a very similar trend happening with the technology of the internet and computing as what we’re seeing now with AI and crypto. The early accumulation cycle for Nvidia would have shaken out many investors simply because of how long it took before going parabolic. Stellar Lumens is showing the same pattern—but the wait could be over. I see a large parabolic run coming for Stellar Lumens very soon, one that could take us to new all-time highs and spark a mass adoption cycle similar to what happened with internet and computing technology.
As always, stay profitable.
- Dalin Anderson
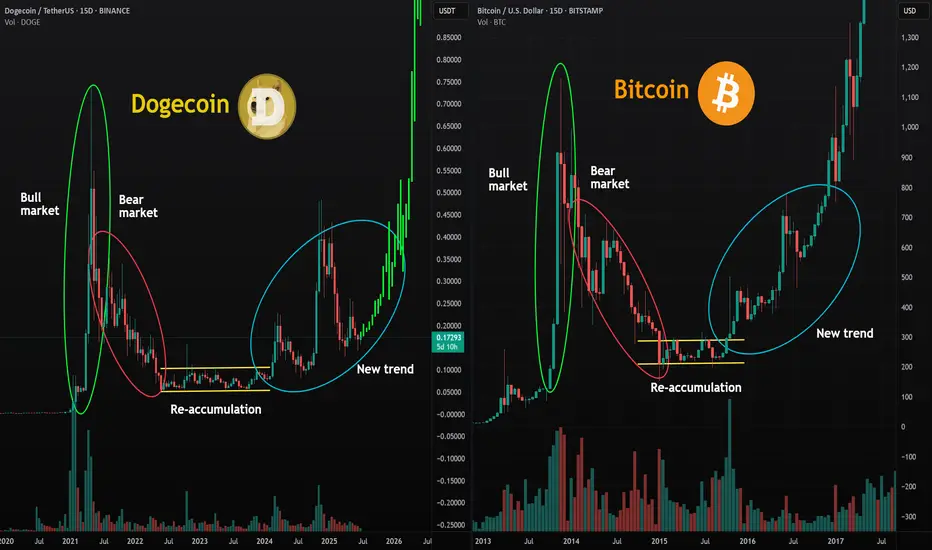
Dogecoin Will Shock Investors With Its Next Move!Today I’m doing an in-depth analysis of Dogecoin and its market cycle in comparison to the early Bitcoin cycles. As you can see, the same human psychology and emotions are playing out in the Dogecoin market that we previously saw with Bitcoin. With mass adoption coming to the cryptocurrency markets, it’s very possible we’ll see a parabolic run on Dogecoin similar to what we saw with Bitcoin in 2016 and 2017. This could lead us to a new all-time high.
Because markets are fractal in nature, we see similar patterns appearing over and over again. If you can learn to understand and identify these cycles and patterns, you can position yourself for maximum profit. I see Dogecoin running very bullish through the rest of 2025, and it could also continue into 2026 as mass adoption drives increasing demand for cryptocurrencies. In fact, we could see the entire crypto market run all the way into 2029, as the stock market is also primed for a large parabolic move in its own cycle.
Stocks and crypto are heavily correlated since both are tied to the global economy. Contrary to popular belief, the world economy may actually be set up for a massive run in value—almost like a “Roaring 20s 2.0.” This means buying Dogecoin today could be like buying Bitcoin in early 2016—the opportunity for profit is enormous.
As always, stay profitable.
- Dalin Anderson
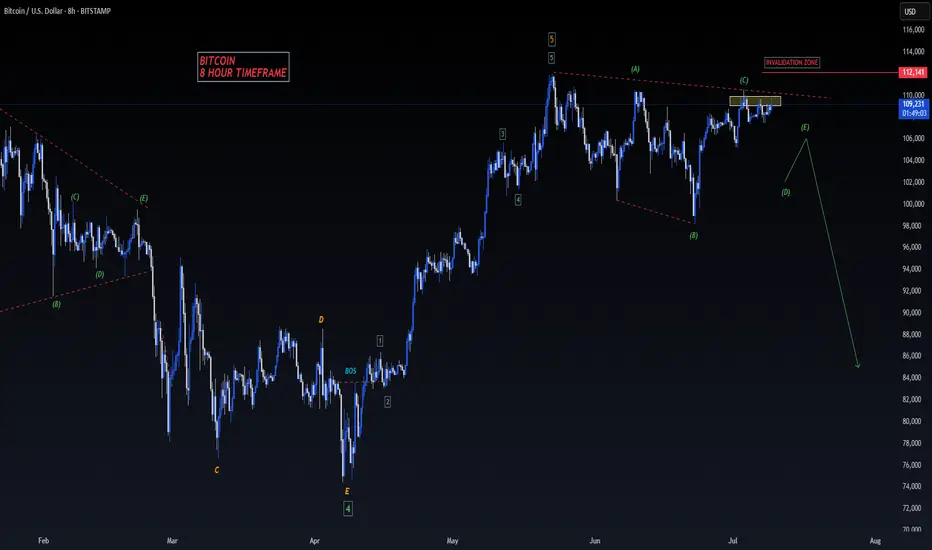
BITCOIN - SELL TO $86,000 (8H VIEW)I see selling opportunities right now for Bitcoin.
⭕️LQ Swiped Above Previous Wave 3 High ($109,000).
⭕️Wave 4 Complex Correction Complete (5 Sub-Waves).
⭕️(Wave 5 Impulse Bullish Move Complete (5 Sub-Waves of 1,2,3,4,5).
❌Invalidation Zone Above Wave 5 High ($112,140).
High risk trade as BTC could still head high for Wave 5 around $120- $130,000. Use strict risk management.
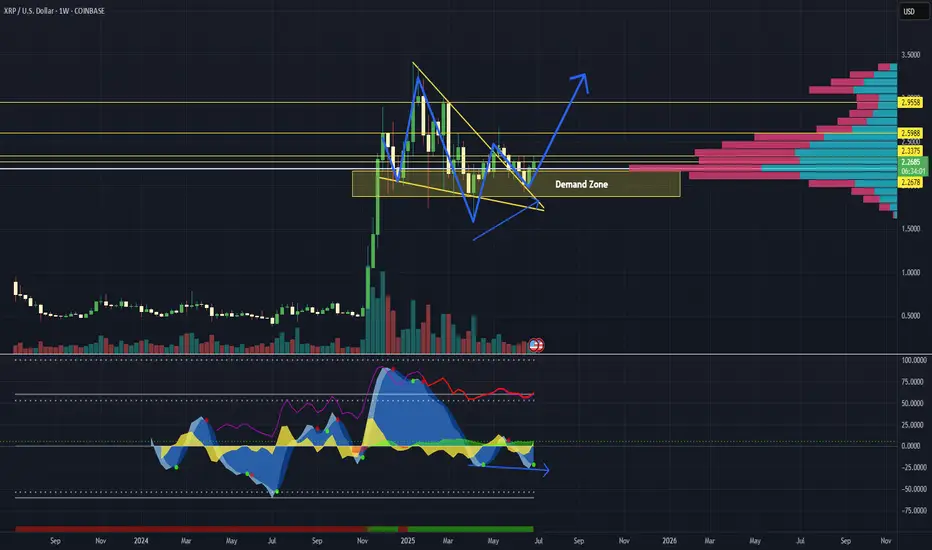
XRP: Ripple Ready to Unleash a Tsunami?Ripple (XRP) is coiling like a spring—ready to explode. After five clean re-tests of a powerful demand zone, buyers have repeatedly stepped in to defend key levels, launching 40–75% swings each time. Is this the moment it unleashes the wave?
🔍 Technical Breakdown:
✅ Demand Zone Strength
XRP is bouncing from a long-tested demand zone (5+ re-tests). Each bounce led to substantial upside momentum.
✅ Bull Flag Retest
XRP previously broke out of a large bull flag and has been holding the flag’s top trendline for over 40 days—acting as strong support.
✅ Higher Low Structure
Price formed a higher low (H/L) and has climbed steadily for two weeks—building bullish structure.
✅ Volume Profile
Price reclaimed ground above the high-volume node, signaling accumulation strength.
✅ Market Cipher B Divergence
A weekly hidden bullish divergence is present—not massive, but notable—hinting at momentum shift.
⚠️ What to Watch:
Volume is key: Current consolidation shows a decline in volume—a surge could ignite the breakout.
Confirmation for conservative traders: Wait for a break and hold above $2.33 with volume, or a retest of that level.
If past demand zone reactions repeat, a breakout could be imminent.
What do you think?
📈 As always—this is not financial advice. Do your own research.
🧭 Happy Hunting!
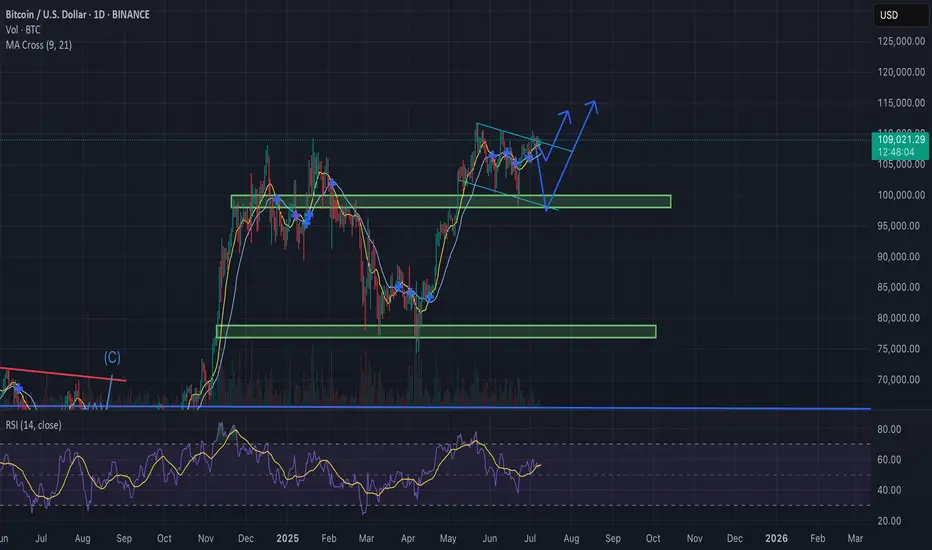
Bitcoin Update – Bullish Falling Wedge in Play?BTC/USD is currently trading near $108.8K, compressing within a falling wedge formation — historically a bullish continuation pattern, especially after a strong uptrend.
Why the Bias Remains Bullish:
Bullish MA Cross: Short-term MAs (9/21) are aligned for upside momentum.
Falling Wedge: Price compressing with lower highs and lows, coiling for a breakout.
RSI Strength: RSI (purple) remains elevated, supporting continued upside pressure.
Fundamental Catalysts:
Trump delays trade war announcements, reducing global uncertainty.
FOMC meeting in late July: Trump pushes for rate cuts, potentially bullish for risk assets like BTC.
If BTC breaks out above the wedge resistance with convincing volume:
Retest likely at ~$110K
Targets : $115K → $120K+
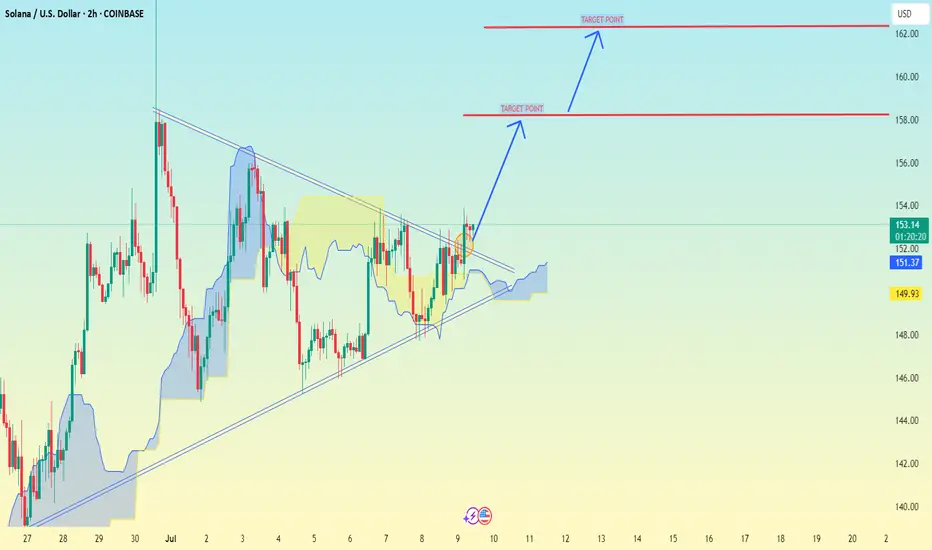
SOL/USD 2H chart PATTERN.SOL/USD 2H chart, the price is forming a bullish ascending triangle breakout, and it's approaching the upper resistance trendline. If it breaks out with volume, a strong move upward is expected.
📈 Bullish Target Points:
1. First Target:
✅ $157.80 — This is the first horizontal resistance and initial breakout target.
2. Second Target:
✅ $162.00 — A higher resistance level based on previous highs and projected breakout momentum.
---
🔎 Additional Notes:
Support Level: Around $149.90 — also near the ascending trendline.
A confirmed breakout above the triangle with a daily candle close and strong volume would validate these targets.
Consider using a stop-loss below $149.00 if you're trading this setup.
Let me know if you want a trade entry suggestion or risk management strategy.
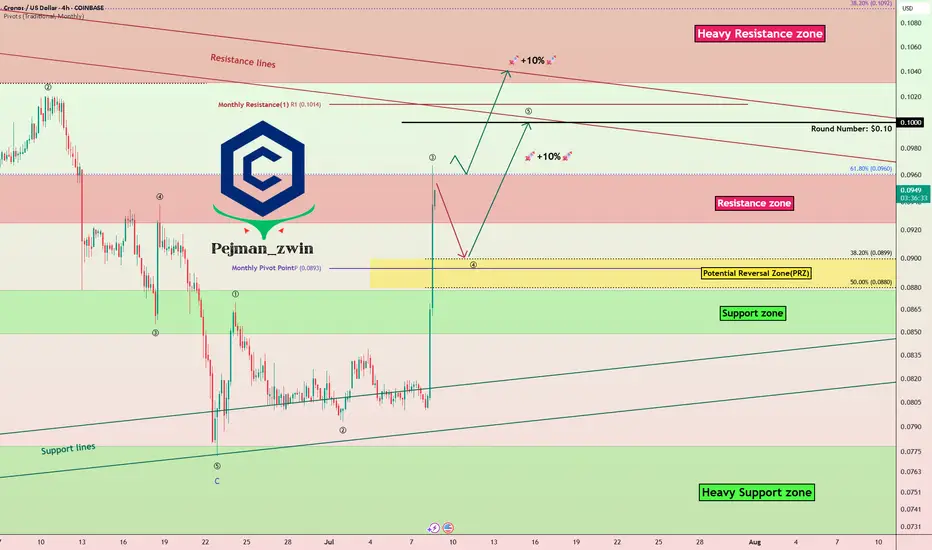
Cronos (CRO) Soars +20% – Can the Rally Push to $0.10?Over the past 24 hours , the Cronos project with the CRO ( COINBASE:CROUSD ) token has seen a price increase of nearly +20% .
Let's see if we can still profit from the movement of the CRO token .
What is Cronos (CRO)?
Cronos is an EVM-compatible blockchain built on the Cosmos SDK. It supports DeFi, NFTs, faster payments, and even AI‑capable dApps. Its native token, CRO, powers fees, staking, and ecosystem activities.
Why CRO Jumped +20% Today (July 8)
Technical leap: Sub-second block times and faster throughput
Better UX: Real-world ready for fast DeFi, payments, and AI dApps
Increased adoption: Greater utility across CAPITALCOM:CROUSD ecosystem
Trader momentum: Volume surges and speculative interest
Strategic roadmap alignment: Upgrades following gas fee improvements ---------------------------------------------------------------------
Now let's examine the CRO token chart on the 4-hour time frame from a technical analysis perspective.
CRO token is currently trying to break the Resistance zone($0.0960-$0.0925) .
Also, in terms of Elliott wave theory , this CRO token price increase with high momentum should be in the form of wave 3 and we can expect a correction to the Potential Reversal Zone(PRZ) for CRO .
I expect CRO to re-attack the Resistance zone($0.0960-$0.0925) after entering the PRZ and rise to at least near $0.1(Round Number) .
Note: Stop Loss (SL) = $0.847= Worst Stop Loss(SL)
Note: If the CRO token breaks the Resistance zone($0.0960-$0.0925) without correction, we can expect a break of the Resistance lines.
Note: It is better to enter a trade if you find the right trigger for a Long position, as a Short position is more risky.
Please respect each other's ideas and express them politely if you agree or disagree.
Cronos Analyze (CROUSD), 4-hour time frame.
Be sure to follow the updated ideas.
Do not forget to put a Stop loss for your positions (For every position you want to open).
Please follow your strategy and updates; this is just my Idea, and I will gladly see your ideas in this post.
Please do not forget the ✅' like '✅ button 🙏😊 & Share it with your friends; thanks, and Trade safe.
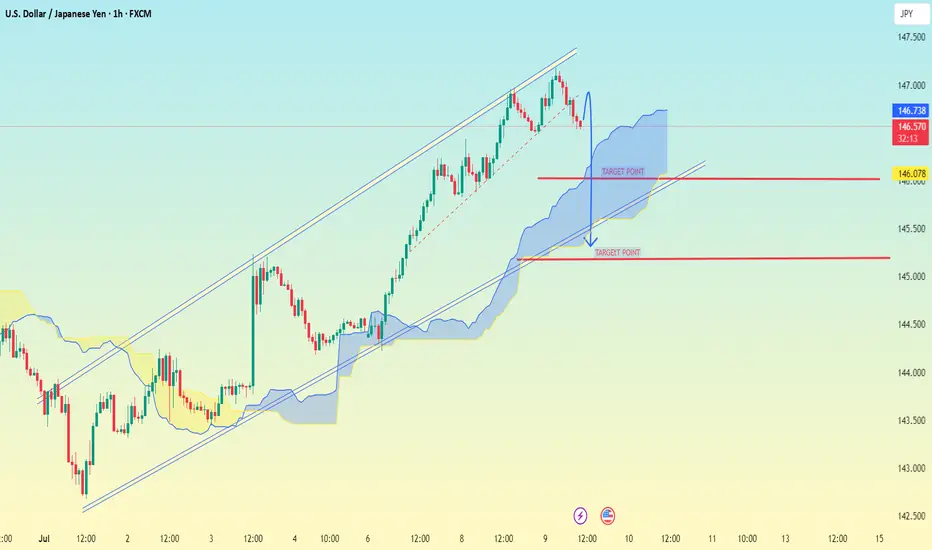
USD/JPY 1H chart PATTERNUSD/JPY 1H chart, the pair has broken below an ascending channel, which is typically a bearish signal. The price is currently inside the Ichimoku cloud, indicating uncertainty, but a breakdown seems likely.
📉 Bearish Target Points:
1. First Target:
✅ 146.078 — Near the bottom edge of the Ichimoku cloud and a horizontal support level.
2. Second Target:
✅ 145.300 — Clear support zone below the cloud, also aligns with previous consolidation area.
---
🔎 Additional Notes:
A breakdown below the Ichimoku cloud will confirm stronger bearish momentum.
Watch for a retest of the lower trendline or cloud support before a deeper drop.
Use stop-loss above 146.80 to manage risk if you're trading this setup.
Let me know if you want a buy/sell entry recommendation or SL/TP planning.
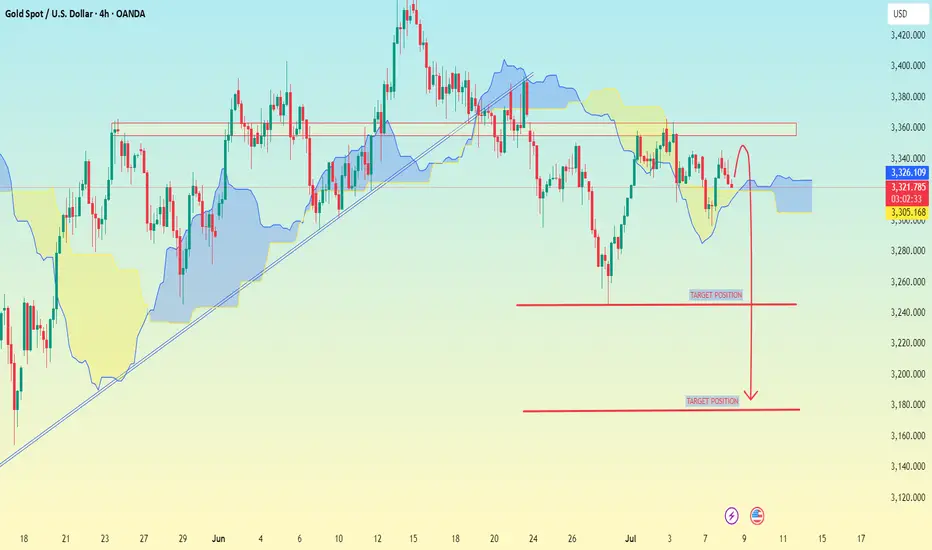
(XAU/USD – Gold vs US Dollar on 4H timeframe)(XAU/USD – Gold vs US Dollar on 4H timeframe), the analysis shows a bearish setup with a breakdown from the ascending trendline and confirmation below the Ichimoku cloud.
1. First Target: 3,220
2. Second Target: 3,180
3. Final Target Zone: 3,130 – 3,100
Note.
Price has rejected from the resistance zone (highlighted in yellow).
Break below support and cloud suggests bearish momentum.
The blue box (around 3,240–3,250) seems to be a possible retest zone before continuation downward.
📉 Bias: Bearish
If price stays below 3,250, these targets remain valid. Watch for retest failures or strong rejection candles to confirm entries.
Let me know if you want SL (stop-loss) or entry suggestion too.