Crypto

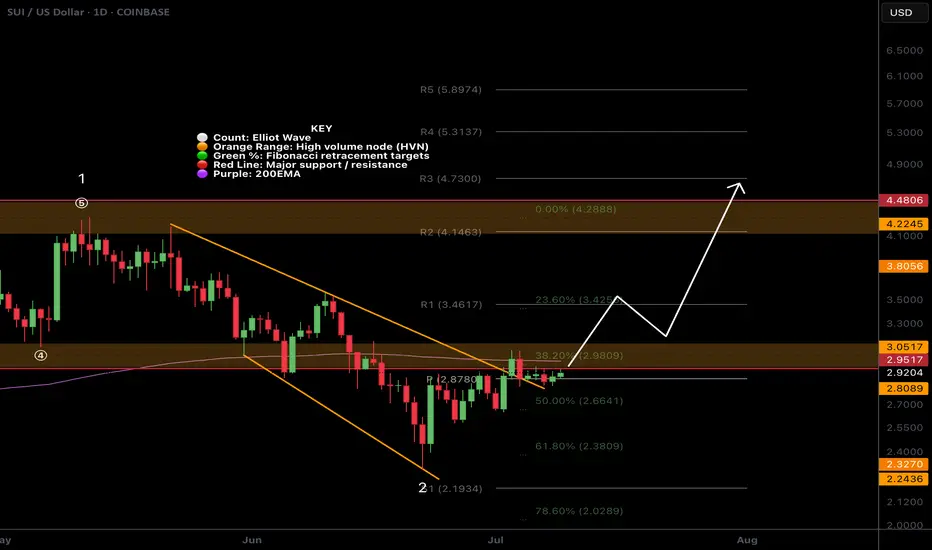
$SUI Gearing Up to Break Triple Resistance?CRYPTOCAP:SUI is consolidating under resistance which often leads to a breakthrough but can take some time.
Price is sat above the daily pivot after breaking the downward trend resistance, but still under the daily 200 EMA and High Volume Node resistance. A pop above $3.09 swing high would be a bullish signal to long towards a first target of $4.2 High Volume Node.
Analysis is invalidated with a move below $2.7, leaving heavy resistance still ahead.
Safe trading
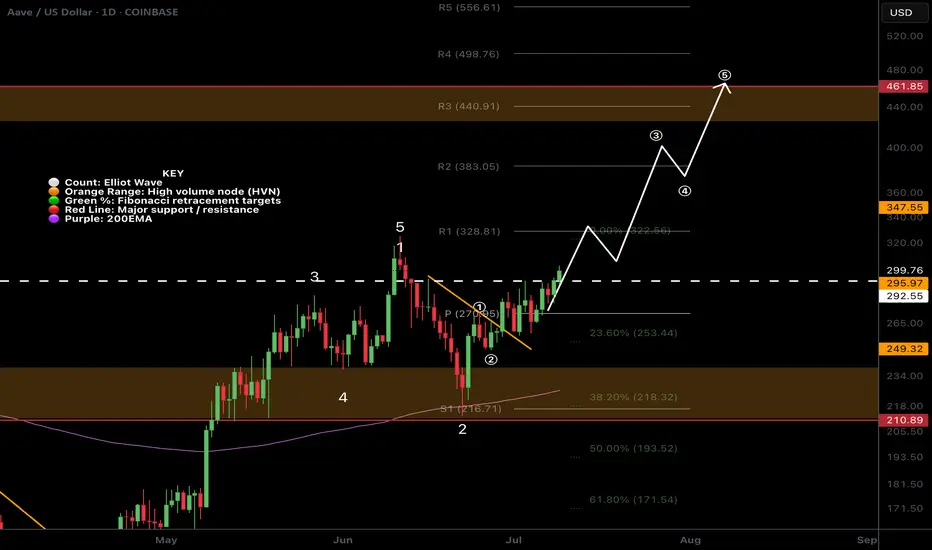
$AAVE Ready to Pop?EURONEXT:AAVE long signal is now active.
Price is still well above the daily pivot and daily 200EMA showing a strong local trend.
I am still expecting a decent move to test the all time high, High Volume Node at $460.
Safe trading
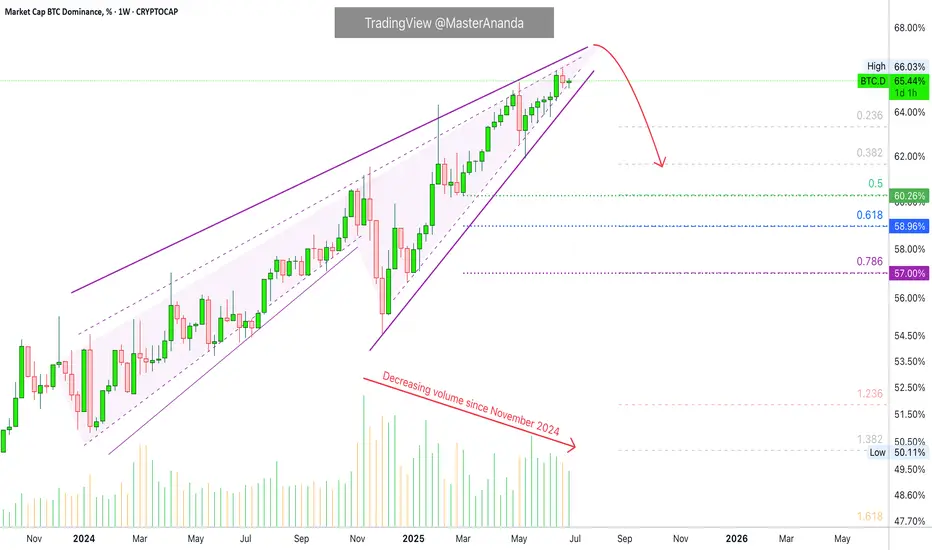
Bitcoin Dominance, RSI Bearish Divergence & Decreasing VolumeThis is a classic signal and we are going to be looking at it on two different timeframes, daily and weekly.
Bitcoin Dominance (BTC.D) is producing a strong bearish divergence with the RSI. The weekly timeframe is very pronounced and I will show you the details below. This type of signal tends to support a change of trend. It appears before the reversal happens but sometimes it can take years before it goes into effect.
» BTC.D Weekly RSI
Here you can see the RSI peaked October 2023. Then a lower high October 2024, then again in April 2025 and finally last month.
As the RSI produces lower highs BTC.D is producing higher highs.
This signal is supported by decreasing volume. Bitcoin Dominance continues to climb higher while trading volume continues to drop. Both signal support a change of trend soon and together they become stronger.
» BTC.D Daily RSI
The daily RSI peaked June 2023 but we will focus on the short-term as we already have a strong signal coming from the weekly.
Here we have a peak in May 2025 and a strong lower high in June. Needless to say, BTC.D peaked 27-June thus the divergence but the action is clearly weak.
» Bitcoin daily
There is a long-term rising wedge on the weekly timeframe and this pattern can also support a reversal.
All these signals are bearish but not very strong, still, there is some weakness on the bearish side for this index. This means that the action can turn bearish tomorrow or it can continue rising for weeks or months before turning red.
These signals are pointing to a reversal but they do not give us a specific date. Can happen next week, next month or in seven months. If we focus on the altcoins, the way they are looking and how long will it take for them to grow, then this index can turn bearish within 2-4 weeks. Bitcoin will also grow as the altcoins market grow. Everything Crypto will grow in late 2025.
Thanks a lot for your continued support.
Namaste.
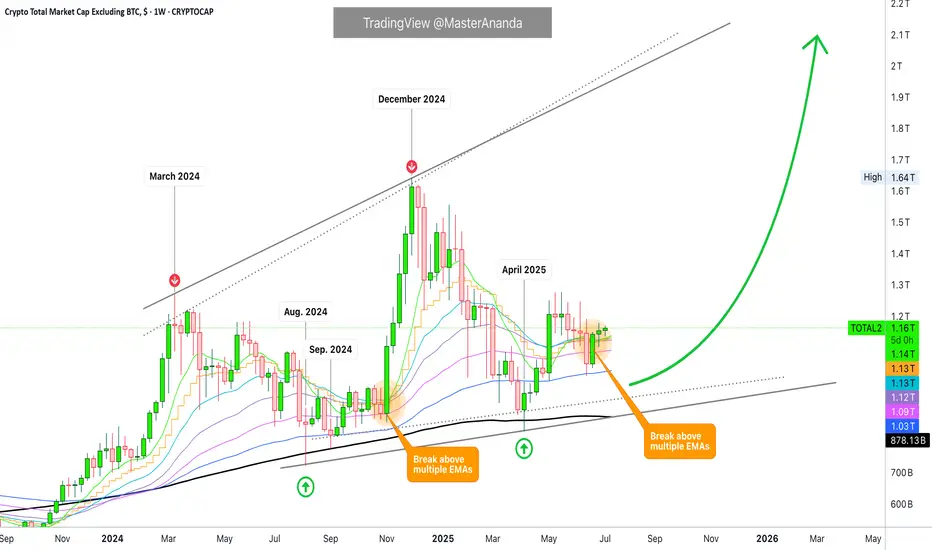
TOTAL2 Moving Averages · This Bull Market Will Change Your LifeMarch 2024 signaled the end of a bullish cycle. After this month, the Cryptocurrency market went bearish. TOTAL2 index went bearish. As it was bullish, it traded above all the moving averages plotted on this chart. As it went bearish, all the moving averages broke as support but one, MA200. The back line on the chart.
MA200 works as support and denotes the broader and bigger cycle. As long as the action happens above this indicator, the market is growing thus bullish long-term. If the action moves below, the bears are in and winning.
Another strong moving average is EMA89, blue on this chart.
When TOTAL2 was bearish it managed to close only briefly below this level. One week and the next week back green. August 2024 and September 2024 TOTAL2 found support at MA200 and EMA89. As soon as these indicators were confirmed as support, we saw the development of a new bullish wave.
The altcoins market grew in November leading to a peak in December 2024. Here the same pattern repeats. TOTAL2 went from bullish to bearish. While it was bullish, it traded above all of the moving averages: EMA8, EMA13, EMA21, EMA55, EMA89 & MA200. As it turned bearish, all these moving averages were tested as support, all of them broke but one, MA200.
In April 2025 MA200 was tested as support and holds. As long as TOTAL2 trades above this level, we know the bigger broader market bias remains bullish. Bullish confirmed. As soon as this level was tested we had a small recovery above all moving averages, until May. Then a retrace led to a test of EMA89 as support and this level holds.
When TOTAL2 trades above all the moving averages, bullish confirmed.
TOTAL2 is now trading above EMA8, EMA13, EMA21, EMA55, EMA89 and MA200 on the weekly timeframe. Ultra-bullish and ready to grow.
Just as the December 2024 high was a higher high compared to March 2024, the late 2025 high will be a higher high vs December 2024. We are in a rising trend and this is confirmed because MA200 always holds as support.
Now that this level has been confirmed, we can expect additional growth. Instead of a single month of bullish action as it happened in late 2024, we can expect a minimum of 3 months of continued growth. In total, we will have at least 6 months, and then some more.
Because it is unexpected, this bull market will change your life, forever. You will receive more benefits and more blessings than anything you can ever imagine. All your hard work will pay-off. You will be rewarded for your patience, persistence and continued support.
Namaste.
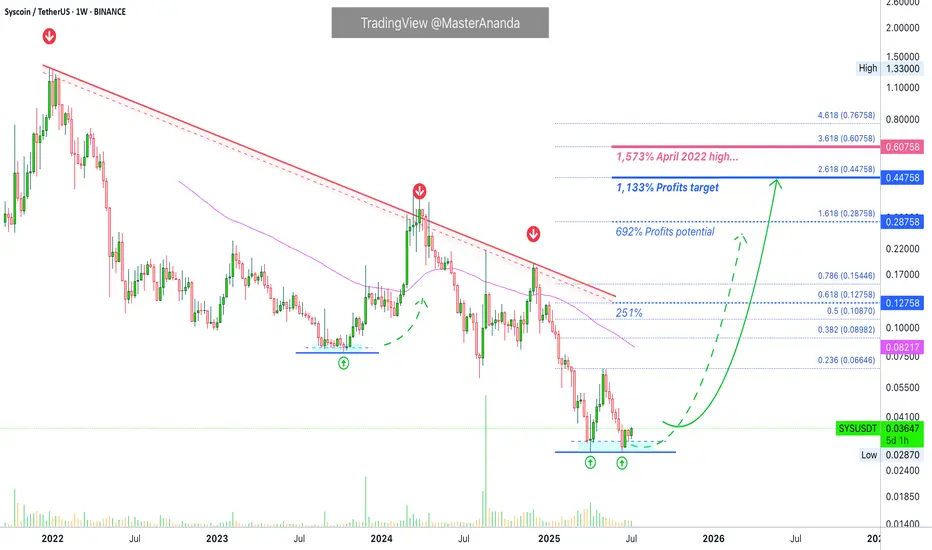
Syscoin: From Bearish to Bullish, The Market Wants ChangeChange is good, but it is not always mandatory. Change is good and recommended only when we are stuck in a certain pattern, in a certain routine or lifestyle, in a certain way of being and we want to experience growth. Exponential growth. When it comes to growth, change is awesome.
Market conditions are changing. Very slowly but still, change is change and change leads to growth. If the market has been stuck too long in the same pattern, the same condition, stagnation is the result.
The market is alive. The market has goals and its goal is to reach you; in order to reach as far as you, the market must grow.
The market understands this dynamic and it will do whatever it takes. The market will not die, it cannot die, so it will do what is necessary in order to promote its own growth. If what the people want is a bullish wave, higher prices, high profits; get ready because the market will give you exactly what you want.
Syscoin has been bearish since December 2021. Apart from a few small bounces, 140% and 400%, it has been going down and really strong, just recently, we witnessed a new all-time low.
Syscoin will not continue in the same pattern for long. In fact, the all-time low happened 7-April, in June, last month, we had a double-bottom (higher low). So the downtrend is over, we are approaching a wave of growth.
The market is changing. The market will change. The change of course will be a major bull run. Instead of lower prices, we will have a multiple-years high, maybe even a new all-time high in the coming months.
In late 2025, everything Crypto will be up. We even have the potential of a multiple years long bull market. Do you agree?
Thanks a lot for your continued support.
Namaste.
Space and Time Buy Zone: 1,000% or More Profits PotentialWhen the market is no longer bearish we know that something changed. We are going to be looking at the same price pattern we've been looking at on multiple charts.
Space and Time (SXT) was bearish, strongly bearish within a falling wedge pattern. On June 22 the bearish action ceased completely and the pattern broke. SXTUSDT went from clearly DOWN to clearly SIDEWAYS action. This is a huge change in price and candles pattern.
The highest bearish volume came in early May and later late May. As prices move lower, trading volume continued to decrease. As the ATL was hit, bear volume was really low. Lower lows with decreasing volume indicates the bearish move is losing force. Sure enough, the next day we get some green candles and volume starts to go up.
The market is changing, we are going from bearish to bullish and we are now in the transition period, prices moving within the buy zone.
This is the opportunity to buy within the accumulation range. The prices now are the best before a bullish breakout and major bullish run.
This looks like a good pair, the chart shows very low risk vs a high potential for reward. We are approaching the pair short-term because of the young chart, but you can buy and wait until prices grow. This pair can easily give 1,000% or more.
Namaste.

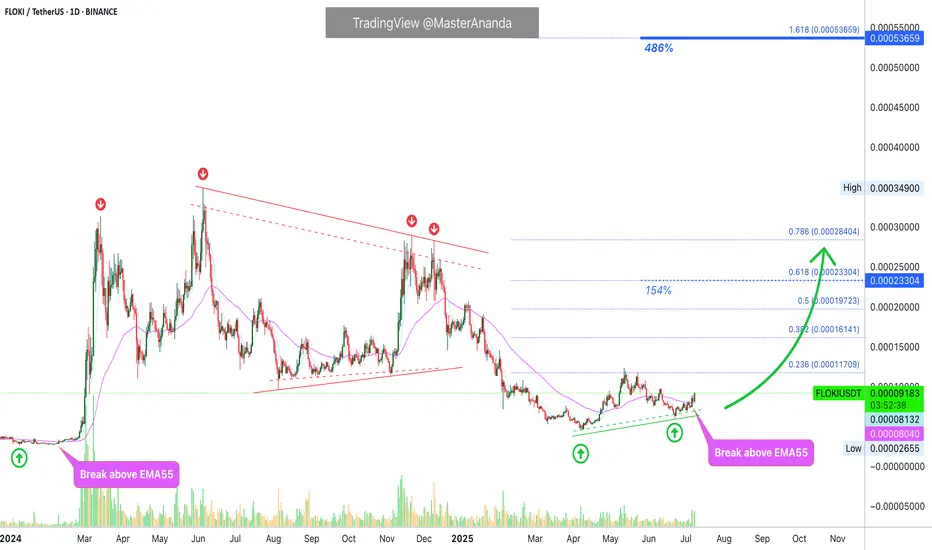
Floki Inu Bullish Signal Fully Confirmed (486% Easy Potential)The last time FLOKIUSDT moved above EMA55 daily, it produced a bullish wave exceeding 1,250% profits, within months. This same signal, the same development is happening now after years of bearish action and months of consolidation. In short, a very strong bullish reversal signal is now present on the chart.
To be honest, that's all there is. More information can just get things confused but, let's proceed.
The downtrend ends and we enter a transition period.
The transition is over and we enter an uptrend. That's all there is. Floki Inu is set to grow.
The bullish bias is already confirmed. As FLOKI now trades above EMA55, trading volume continues to increase. The chart structure is also perfect for a bullish wave. The last major low is still a long-term higher low compared to the bottom prices before the 2024 bullish wave.
Unlike in the past, there is no need to wait for months for this jump to come to be. Floki will start moving within weeks, maximum. It is possible that the next bullish wave goes into full force within days. The entire altcoins market has been consolidating long enough. The time is now.
Thanks a lot for your continued support.
Namaste.
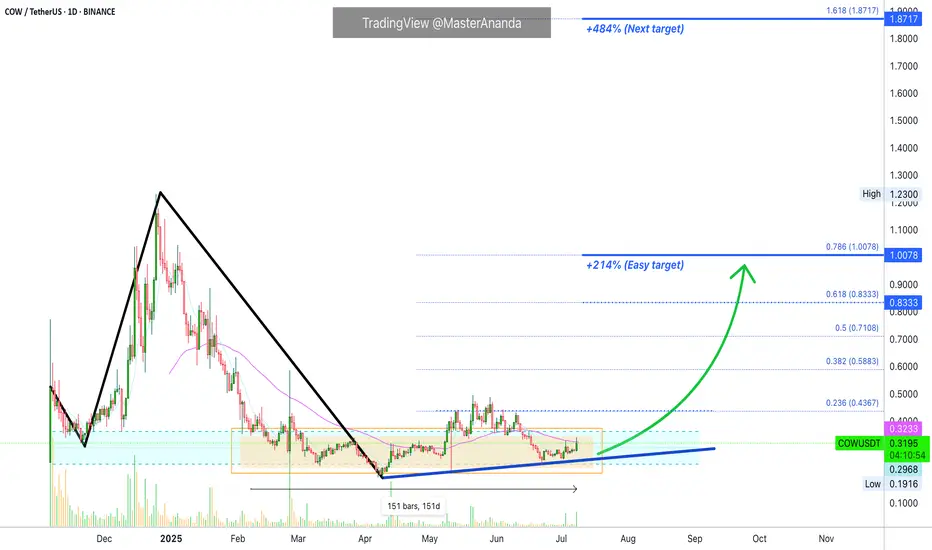
CoW Protocol About to Enter Bullish Zone (214% Easy Target)'Next target' has 484% profits potential. This target is projected to hit mid-term, that is, within 3 months (90 days)... Boost & keep reading below!
Good afternoon my fellow Cryptocurrency trader, I hope you are having a wonderful week and day.
COWUSDT is about to enter the bullish zone, when the action moves above EMA55. The magenta line on the chart.
This altcoin is already bullish because it is no longer bearish. The low happened 7-April and as you can see, the market has been sideways since early February. 150 days. More than 5 months.
Notice how daily trading volume is almost flat but some days stand out with increased buying. You see green bars shooting up but never red bars. This reveals a bullish bias. We are witnessing the early days before a major bullish breakout. One that will lead to 200% and up to 500% profits mid-term. Long-term, there can be more.
Thank you for reading.
Another easy trade, huge profits, easy chart. Buy and hold.
Namaste.
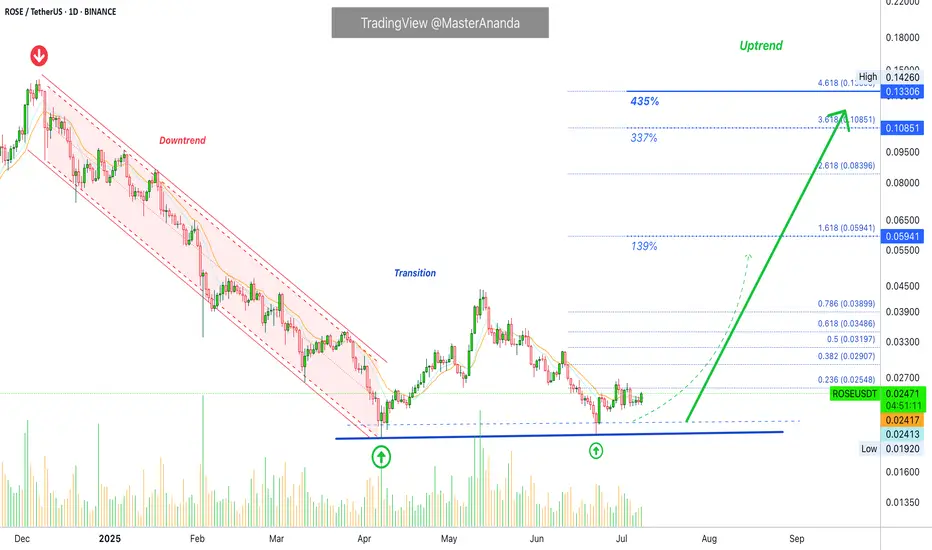
Rose Network: Double-Up Within Weeks (PP: 435%)ROSE grew 130% between April and May, a relatively small wave. The peak happened at 0.04424. The low in April happened at 0.01920. The previous wave high in early December 2024 happened at 0.14260. As you can see, a relatively small wave. But this is good news.
In June we get a higher low compared to 7-April. A technical double-bottom. This double-bottom/higher low reveals a higher high next. This is why this is a good an easy setup. The next target is already confirmed. We can buy easily; no stress, fully relaxed, because we know prices will grow.
We know prices will grow because they grew in April and now we have the same low. The downtrend is no more and thus a new uptrend starts. 139% is the very easy target based on the short-term. Mid-term and long-term there will be so much more growth. 337% & 435%.
Thank you for reading.
I like this one. It is an easy win. Easy pair to double-up.
Namaste.
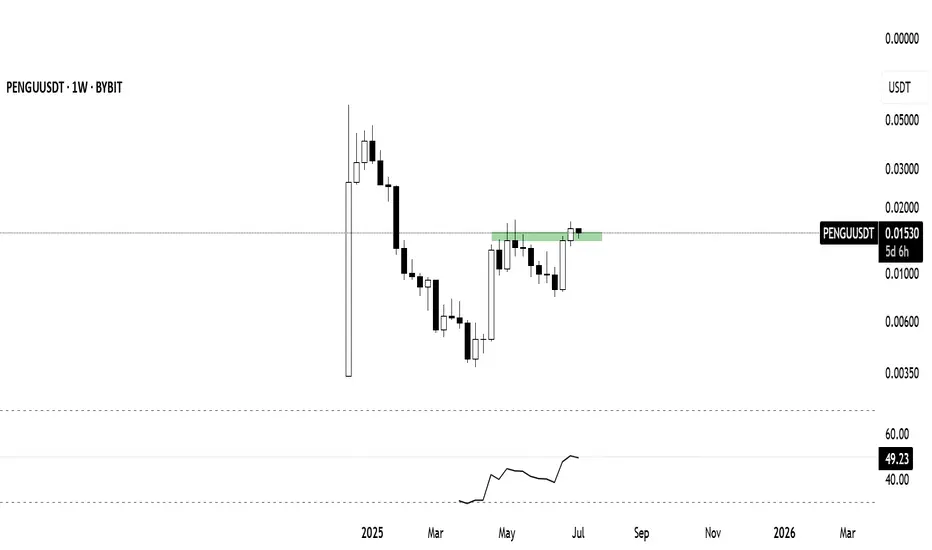
The best-looking HTF meme chart, hands down is $PENGUThe team behind the crypto mascot accomplished a lot over the last couple of weeks, and the TA is showing;
- CBOE filing for PENGU ETF
- Appeared at @Nasdaq
- Listed on @eToro
- Listed on @RevolutApp
- Listed on @Official_Upbit
- Listed on @WebullGlobal Pay
- @NASCAR Partnership
- PEZ x Pudgy Penguins Partnership
- Miles & More Partnership
- @PenguClash reached 2M+ on waitlist
- 1B views per day
All this and much more!
@pudgypenguins are doing it the right way 🐧
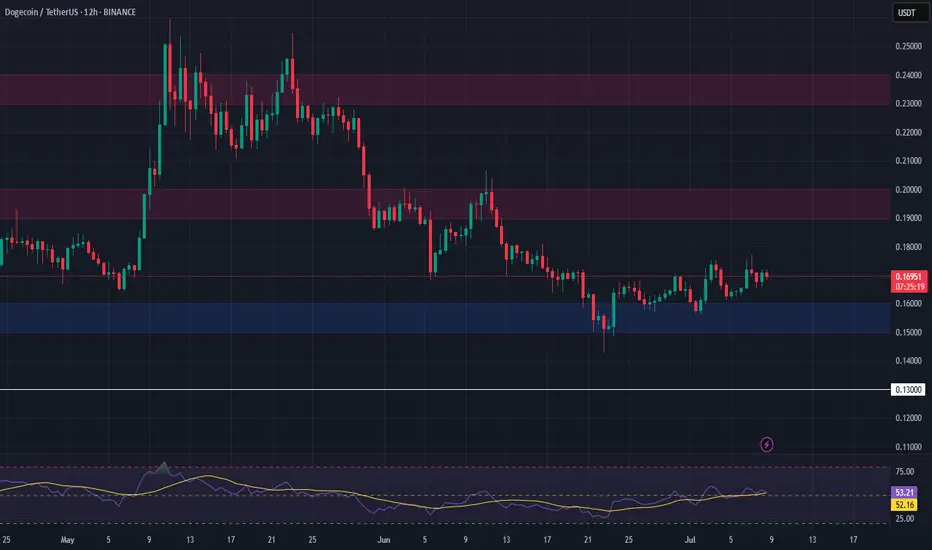
DOGE Long Swing Setup – Musk-Fueled Hype & Political BuzzElon Musk’s launch of the “America Party” is reigniting interest in his potential impact on crypto—especially Dogecoin. With his history of moving DOGE’s price, this political pivot could stir volatility and renewed upside. We’re watching for a dip into the $0.15–$0.16 zone for a possible long entry.
📌 Trade Setup:
• Entry Zone: $0.15 – $0.16
• Take Profit Targets:
o 🥇 $0.19 - $0.20
o 🥈 $0.23 – $0.24
• Stop Loss: Daily close below $0.13
ETH Long Swing Setup – Sideways Hold with Dip-Buy OpportunityETH continues to hold above the key $2,300 support, showing resilience and consolidating within range. We’re watching for one more dip into the $2,300–$2,375 zone to trigger a long entry, with momentum building for a potential breakout.
📌 Trade Setup:
• Entry Zone: $2,300 – $2,375
• Take Profit Targets:
o 🥇 $2,900 – $3,000
o 🥈 $3,300 – $3,400
o 🥉 $4,000 – $4,200
• Stop Loss: Daily close below $2,000

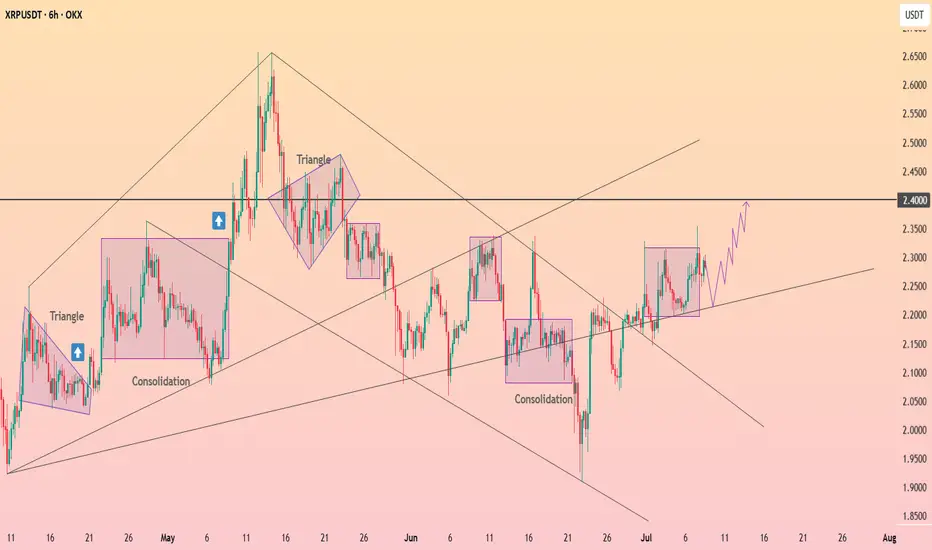
HolderStat┆XRPUSD targeting $2.4BINANCE:XRPUSDT is printing repeated consolidation zones and ascending structures. Price is currently rebounding above 2.20, eyeing a breakout toward 2.40. The bullish momentum persists with higher lows and breakout setups.
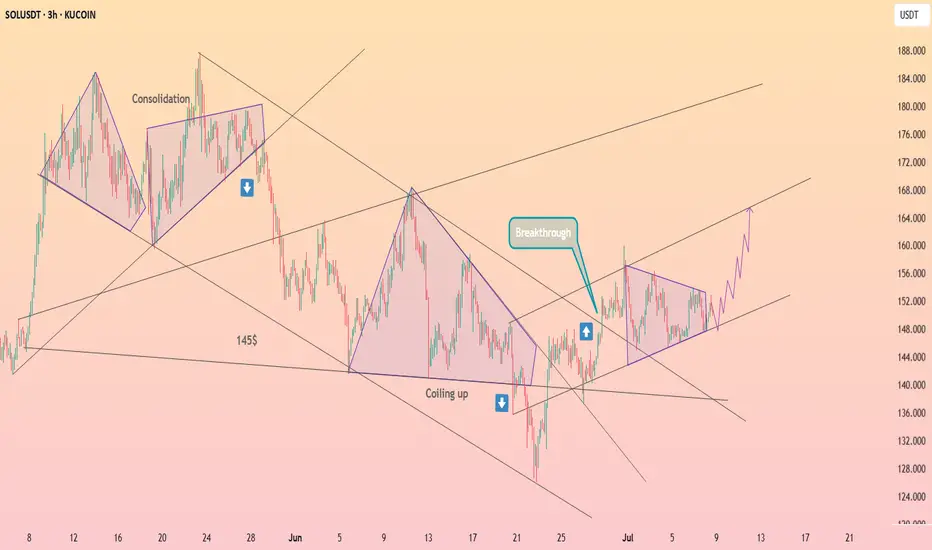
HolderStat┆SOLUSD seeks to the resistance lineBINANCE:SOLUSDT has broken out of a descending wedge and is coiling in a symmetrical triangle above 150. The setup supports a push toward 165–170, with momentum favoring bulls if the triangle resolves upward.
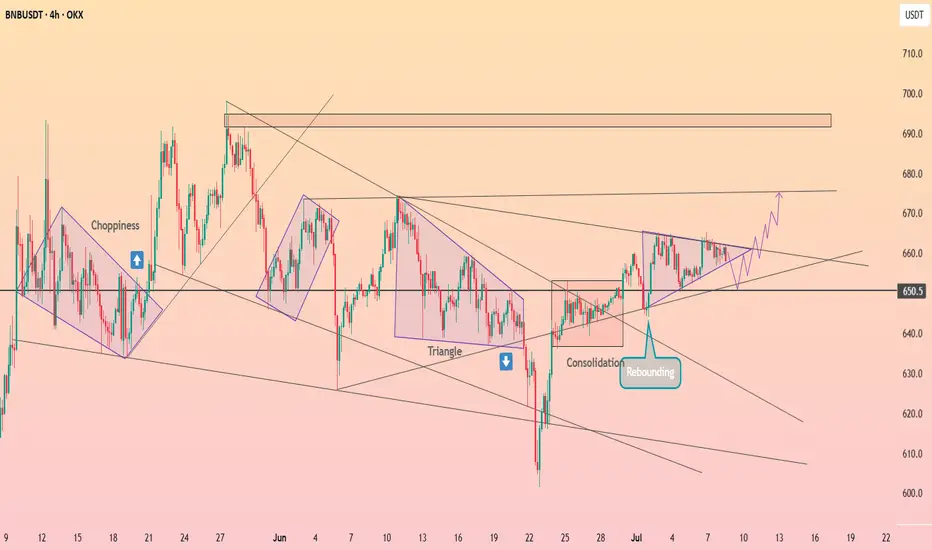
HolderStat┆BNBUSD forming the triangleBINANCE:BNBUSDT is approaching the apex of a symmetrical triangle pattern with strong support from 650. Repeated rebounds and higher lows indicate bullish pressure. A breakout above 665 could drive price to test the 695 resistance block.
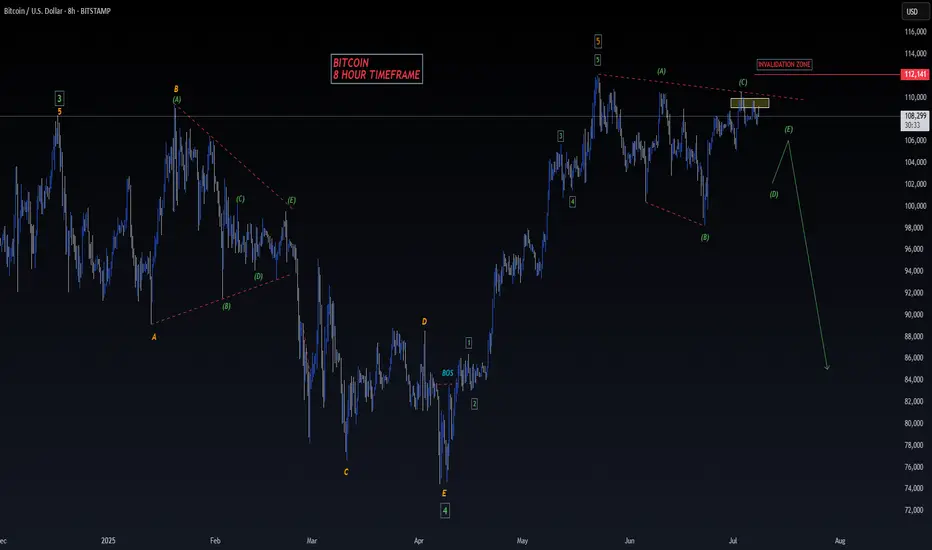
BITCOIN - SELL TO $86,000 (8H VIEW)I see possible shorting opportunities right now for BTC.
⭕️LQ Swiped Above Previous Wave 3 High ($109,000).
⭕️Wave 4 Complex Correction Complete (5 Sub-Waves).
⭕️(Wave 5 Impulse Bullish Move Complete (5 Sub-Waves of 1,2,3,4,5).
❌Invalidation Zone Above Wave 5 High ($112,140).
High risk trade as BTC could still head high for Wave 5 around $120- $130,000. Use strict risk management.
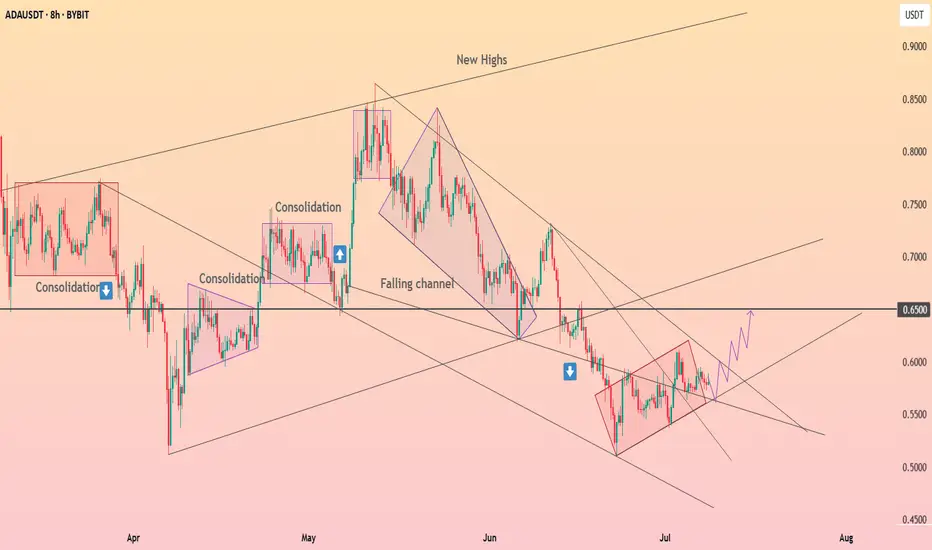
HolderStat┆ADAUSD rising topBINANCE:ADAUSDT is breaking out of a falling channel, following a long consolidation period and bullish wedge development. Price action is coiling around 0.58–0.60 and may rally toward 0.65 if the breakout sustains. Historical patterns suggest continued strength from this structure.
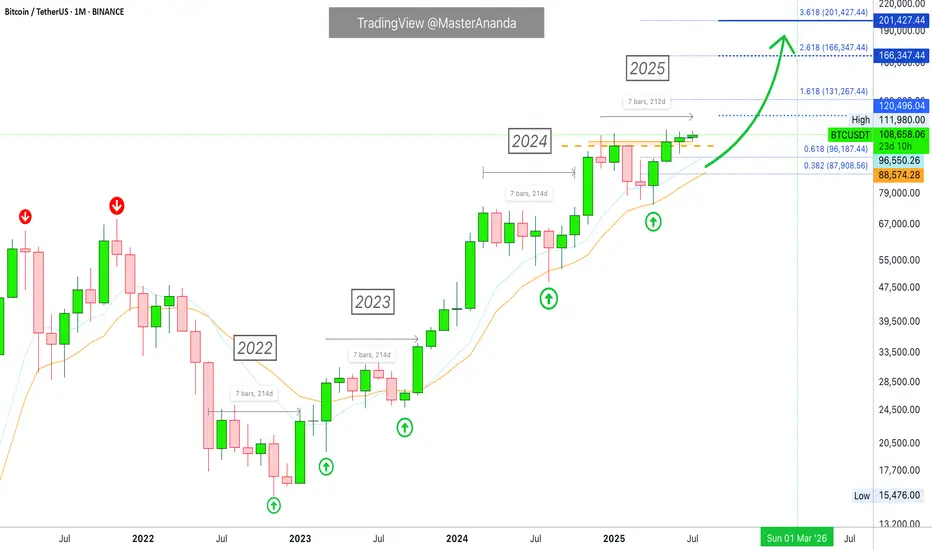
Bitcoin Monthly · New ATH vs 2021, Indicators & MoreLast month Bitcoin produced its highest close ever, $107,146. The last three months all closed green, the close was higher than the open, and this is the fourth green month so far.
Bitcoin tends to produce a period of bullish consolidation before a major move, and this is exactly what we are seeing now. Bitcoin tends to produce a correction before a major bullish move, and this is exactly what happened between January and April. Bitcoin is set to grow.
Past action · consolidation
We already looked at the consolidation period that happens between each major price advance. Since 2022, Bitcoin has been moving sideways for some 200-220 days before each advance. This happened in 2022, 2023, 2024 and also now in 2025.
Looking at it from the monthly timeframe, the consolidation period was capped each time at 7 bars, 214 days. Current consolidation has already been going for more than 215 days. Bitcoin is set to continue growing.
Indicators · MAs, RSI & MACD
Bitcoin is trading above all moving averages. The monthly RSI is very strong, beyond 70.6.
The monthly MACD is moving at all-time high levels, trending up with room available for additional growth.
Chart patterns · candlestick reading
The chart patterns now has no similarities to 2021. Many people were saying that Bitcoin produced a double-top similar to 2021 and was set to move down. I completely disagree with this analysis.
In 2021 both instances when Bitcoin peaked the month ended up closing red. In 2025 the months when Bitcoin peaked the months ended closing green.
The same month the peak was hit in 2021 was followed by bearish action, twice. And of course, the bear market. In 2025 the market has been consolidating for months and trading near its all-time high.
Finally, in 2021 each peak was 7 months apart, 214. In 2025, the last two peaks are 4 months apart, only 120 days.
This difference is good to point out because market conditions are not the same. Not the same market conditions means that Bitcoin is not likely to go into a bear market now, instead, it can produce something difference. The market has only three directions: Down, sideways and up.
Down has been eliminated based on past action.
Sideways is happening now.
Something different only leaves the upside open; Bitcoin is going up.
Namaste.
BTC/USD SCENARIO Bitcoin is trying to break out of the 110,000
If we break out we will see a new high
If we don’t break it we could see 105k possibly 100k

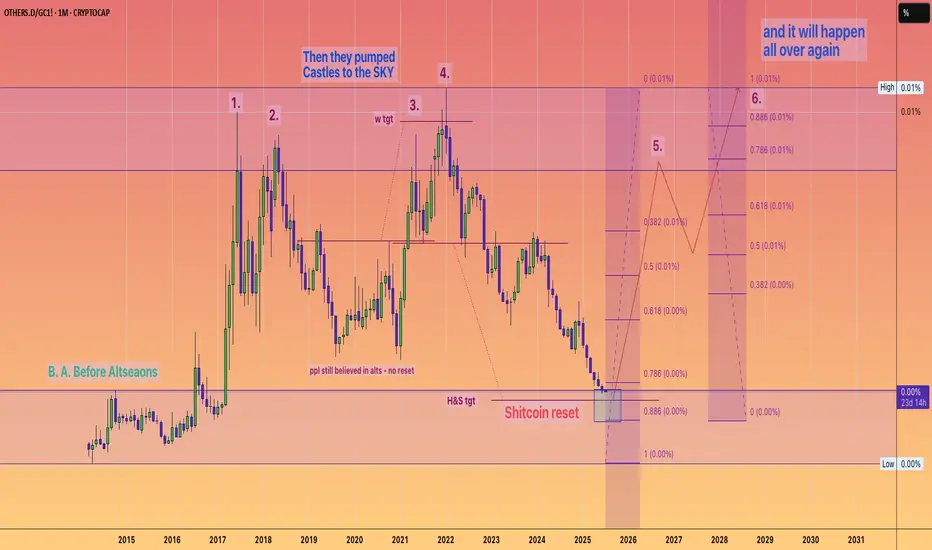
#OTHERS.D ~ Do you believe in Castles in the SKY?I believe that the Others dominance metric divided by an ounce of real money #Gold gives us a valuable insight into the fabled altseasons.
Because as this chart shows theres only been 4 in actuality
and you normal get a double bubble in a cycle.
So I believe we are at the cusp of turning things around as most people have given up on the concept of altcoins ever pumping again.
But it was just the business cycle #PMI that has depressed prices for the past few years.
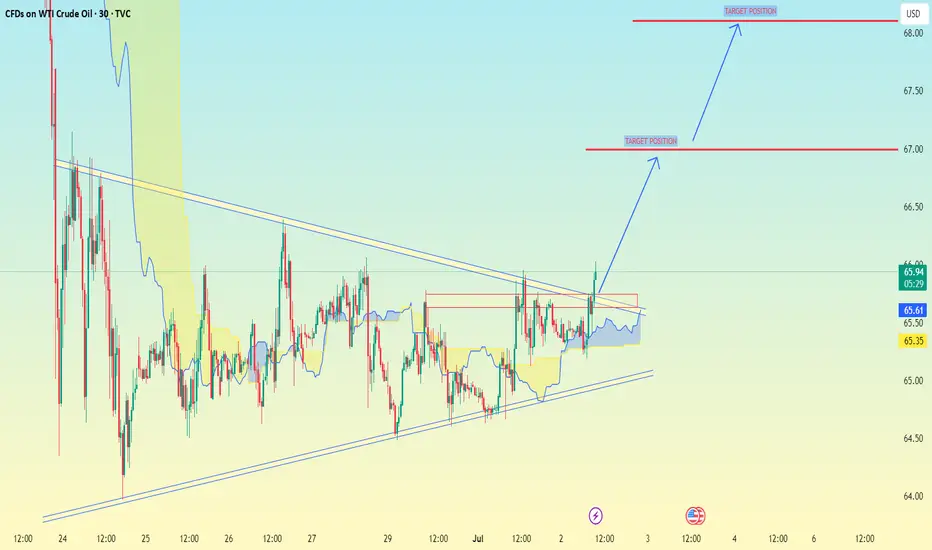
(WTI Crude Oil) on the 30-minute timeframe:(WTI Crude Oil) on the 30-minute timeframe:
You have a clear triangle breakout happening.
The chart shows two bullish target positions marked with blue arrows.
Based on your chart:
Current Price Zone: Around 66.20 - 66.25
Target Levels:
✅ First Target: 67.00
✅ Second Target: 68.00 - 68.10
---
Summary Trading Idea:
Breakout above resistance trendline confirmed.
First resistance and partial target at 67.00
Final target near 68.00 - 68.10, where the next significant resistance lies.
Let me know if you want stop-loss suggestions or a detailed entry strategy.
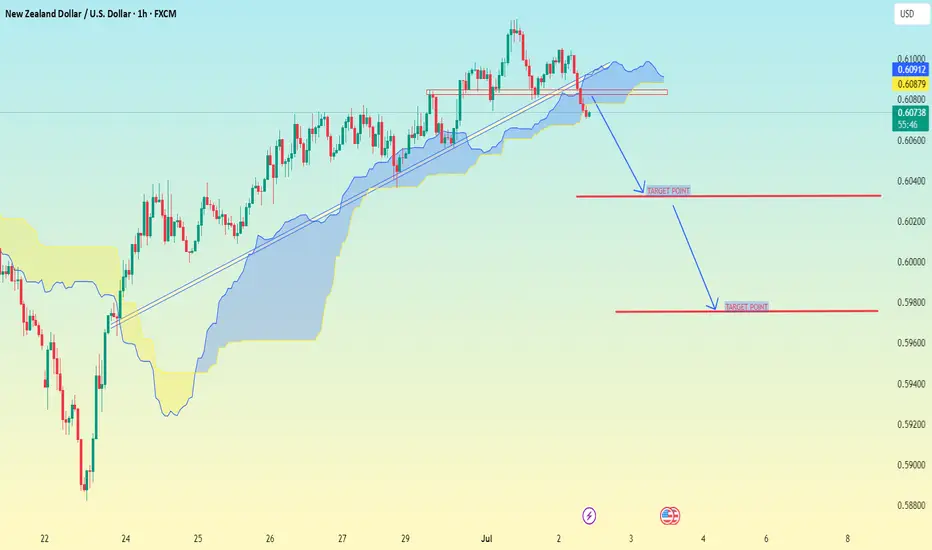
NZD/USD(New Zealand Dollar vs US Dollar) chart on the 1H timefrm NZD/USD (New Zealand Dollar vs US Dollar) chart on the 1H timeframe:
Price has broken below the ascending trendline and is now trading below the Ichimoku Cloud, confirming bearish momentum.
You already have clear two downside target levels marked on the chart.
Based on your chart:
✅ First Target: 0.60200
✅ Second Target: 0.59500
---
Quick Summary:
Bearish breakout confirmed.
Targets are positioned at 0.60200 and 0.59500.
As long as price stays below the Ichimoku Cloud, the bearish trend is valid.
Let me know if you want stop-loss or confirmation levels suggestions.