Is #BCH About to Fall or Will it Continue to Rise? Key LevelsYello Paradisers! Have you seen what’s cooking on #BCHUSDT lately? Let’s dive into the latest structure on #BitcoinCash and what may unfold next:
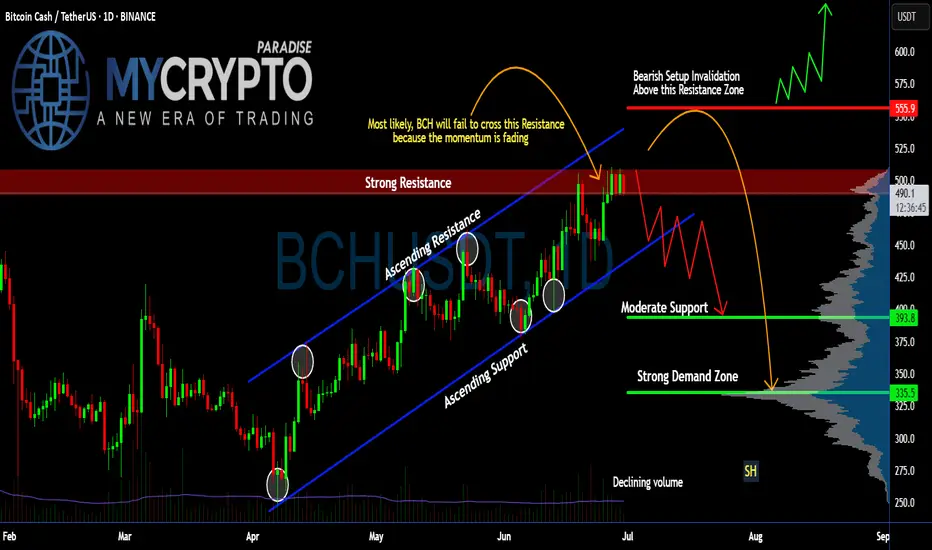
💎#BCH has been trading within a well-respected ascending channel since early April, consistently bouncing between dynamic ascending support and resistance levels. However, the current move into the $500–$505 resistance zone is showing clear signs of momentum exhaustion, as price stalls and volume fades.
💎The strong resistance area between $500 and $505 has rejected price multiple times, and this recent rejection aligns with both the channel resistance and a bearish momentum divergence in volume. Unless #BCHUSD can break and hold above this zone, bulls are fighting a losing battle.
💎The invalidation of the bearish setup lies above $555. Only a confirmed breakout and sustained hold above this level would negate the current bearish structure and open room for a larger bullish expansion. Until then, the risk of a deeper retracement is very real.
💎Currently trading around $490, #BCH looks vulnerable to a drop toward the moderate support zone near $393, with the strong demand zone between $335 and $340 being the high-probability area for a smart-money reaccumulation—if the market flushes weak hands first. This zone also lines up with previous high-volume nodes on the VRVP.
Trade smart, Paradisers. This setup will reward only the disciplined.
MyCryptoParadise
iFeel the success🌴
Crypto
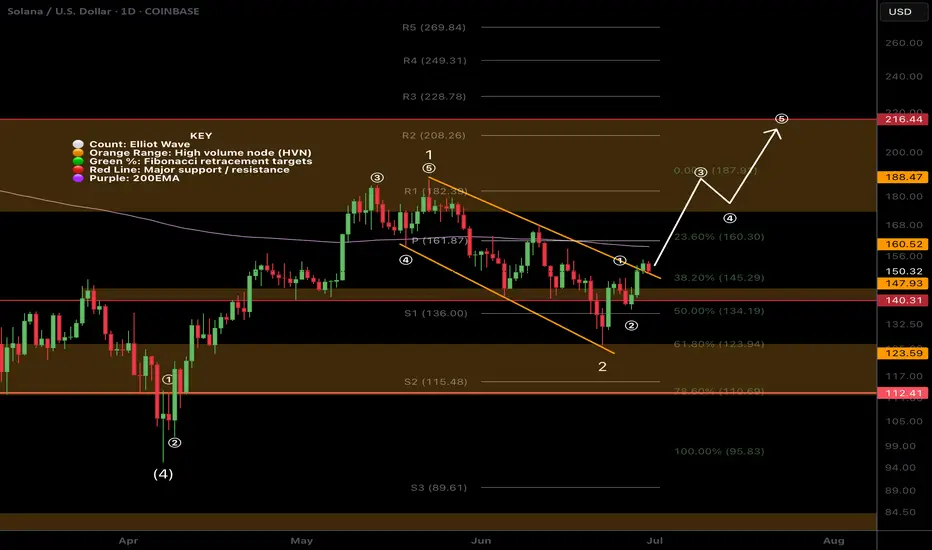
SOL Ready To Breakout?SOL had a decent move this weekend overcoming descending resistance and now testing as support.
Price appears to have a completed a wave (2) at the .618 Fibonacci retracement and S1 daily pivot and a larger degree wave 2 at the channel bottom, High Volume Node support and .618 Fibonacci retracement.
If a wave (3) of 3 is underway then we should expect a strong move sooner rather than later with an initial target of the swing high resistance a/ R2 daily pivot $208-$216 range
Safe trading.
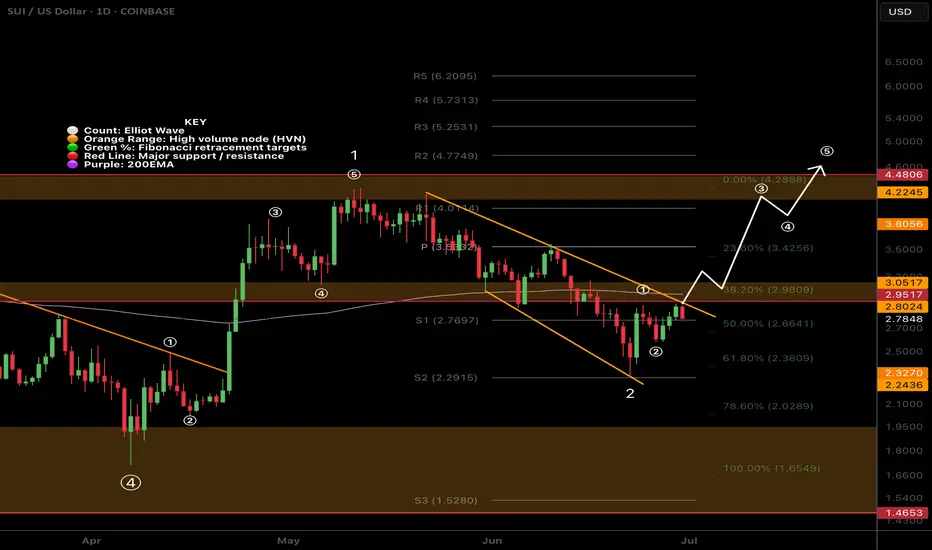
SUI Wave 3 of 3 Started?SUI appears to have completed a local wave (2) at the .618 Fibonacci retracement and a larger degree wave 2 at the alt-coin golden pocket between .618-.782
Triple resistance looms ahead of the daily 200EMA, major resistance High Volume Node and descending resistance trend line.
A breakthrough and close above will be a bullish sign with an initial target of the December swing high range $4.48
Analysis is invalidated below the $2.5 swing low, locking in ABC correction instead.
The bullish case is in jeopardy below $2.29 swing low.
Safe trading
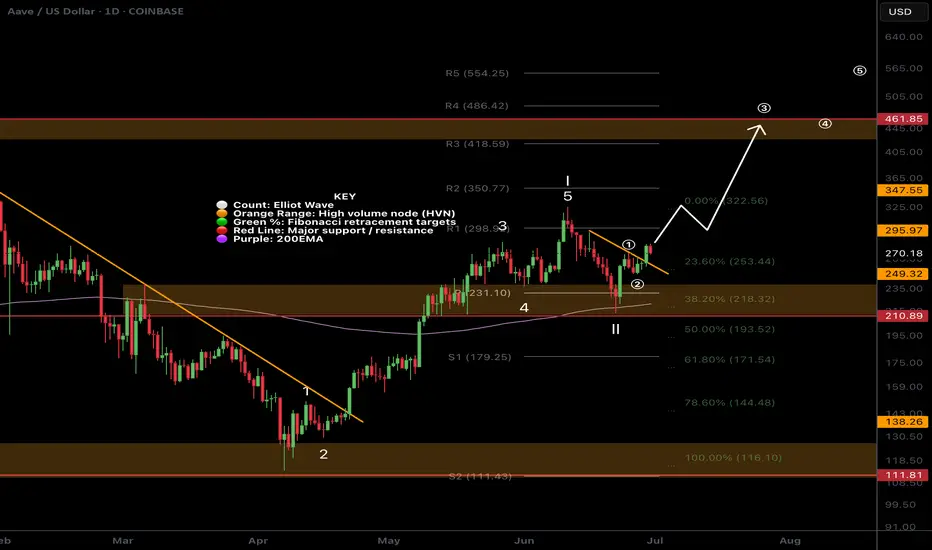
AAVE Ready For New Highs?AAVE is breaking out of its descending trendline after several tests as resistance.
Wave 2 appears complete at quadruple support: Daily 200EMA, daily pivot, .382 Fibonacci retracement and High Volume Node (HVN). If an Elliot Wave (3) of 3 is underway, price should move strongly sooner rather than later with extended price action.
The next major resistance and partial take profit is at the December swing high range $460.
Analysis is invalidated below $210.
Safe trading
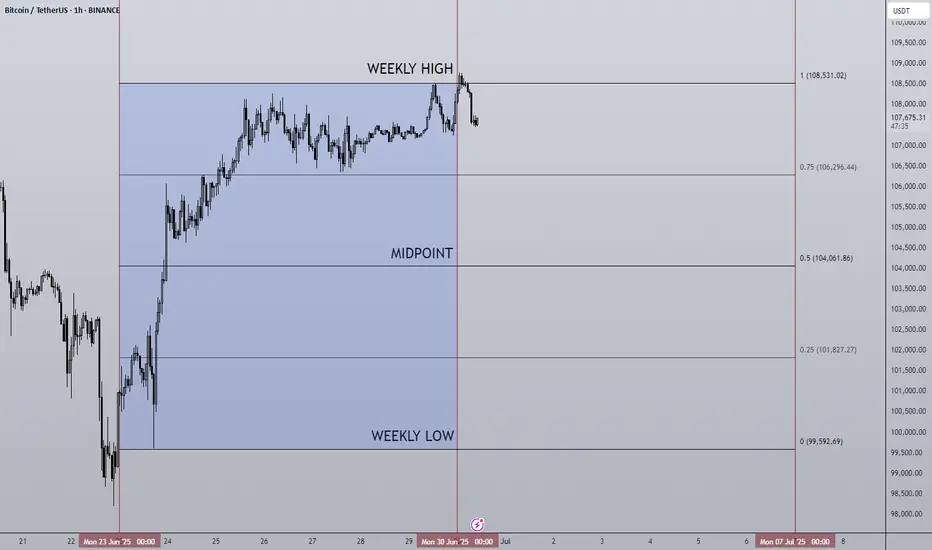
30/06/25 Weekly OutlookLast weeks high: $108,531.02
Last weeks low: $99,592.69
Midpoint: $104,061.86
Overall a positive week for BTC in isolation as price moves steadily all week reclaiming the losses made in the week from the 16th-23rd June. This comes after a $2.2B BTC ETF weekly inflow, the 3rd consecutive week of net inflows.
Having now hit the key S/R level of $108,500 it will be interesting to see where BTC goes from here. Jumping up above the level will require a lot from the bulls as ATH is within touching distance and so buying into major resistance is a tough ask. We also have Geo-political uncertainties to add to the situation, one bad tweet is all it takes sometimes to do a lot of damage.
On the other hand the SNP500 hits new ATH in the same conditions and so BTC is more than capable of doing the same.
So far in the first hours of this weeks trading we do have a SFP of the weekly high setup, not ideal for the bulls in any way and so from here the a retest of the range quarters, midpoint being the key area would make sense, invalidation would be a clean break above weekly high with acceptance and strong volume on the move to break the rangebound/choppy environment.
There is also the "window dressing" element to the months &quarter end today. History shows a de-risking going into these events and more money flowing back into risk-on assets in the days following monthly/ quarterly end. For that reason a bullish move (if there were to be one) would come later in the week IMO.
Good luck this week everybody!
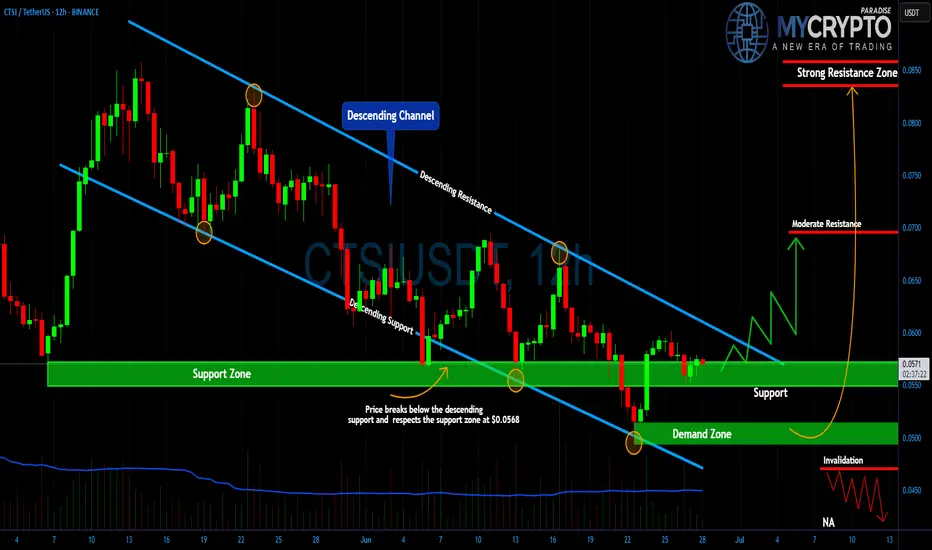
CTSI About to Detonate? Yello Paradisers! Are you ready before CTSI makes its next explosive move? Because this setup is flashing signals that most traders will only realize when it's already too late.
💎#CTSI/USDT has been trading within a clearly defined descending channel, consistently respecting both the resistance and support trendlines. What's important now is how the price has reacted after dipping into the lower boundary. After breaking slightly below the descending support, the price immediately rebounded from the key horizontal support area at $0.0552 a region that has repeatedly proven its strength over the last few weeks.
💎This recent price action confirms strong buyer interest at the current levels, and as long as the $0.0550–$0.0570 zone holds, #CTSI remains in a potential accumulation phase. The reaction here suggests that smart money might be stepping in early, preparing for a breakout move that could take retail traders by surprise.
💎If momentum begins to build and the structure breaks above the descending resistance line, the first technical obstacle will be around $0.0700 a moderate resistance that has capped price action before. A sustained move through this level would confirm the breakout, with the next key target sitting at the strong resistance zone near $0.0850. This would represent a solid bullish extension for those positioned early inside the channel.
💎However, the invalidation point is also very clear. A breakdown below the $0.0500 region, where the final demand sits, would invalidate the bullish setup and open the door to deeper downside. For now, though, the structure is favoring a potential reversal, and the market is giving us a clean range to work with.
Strive for consistency, not quick profits. Treat the market as a businessman, not as a gambler.
MyCryptoParadise
iFeel the success🌴
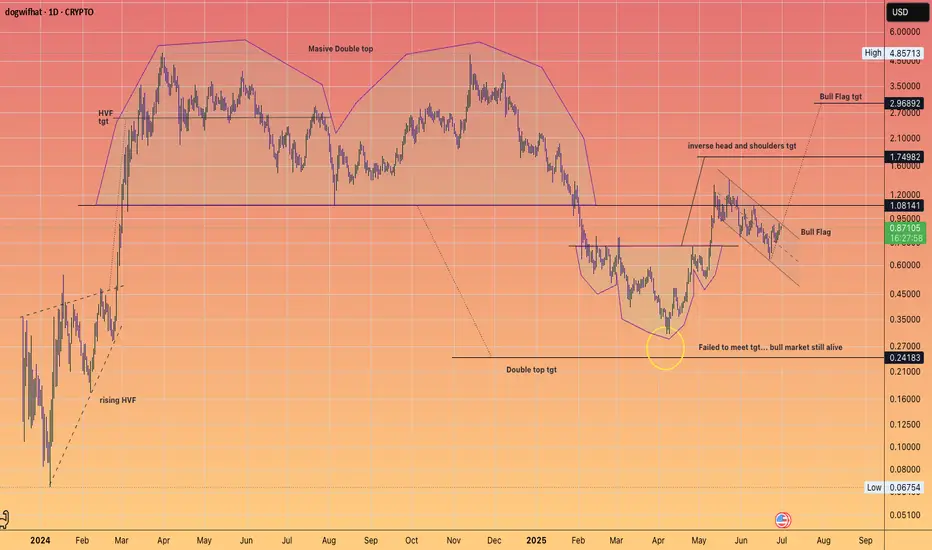
WIF back to $3Complete look at Dog WIF Hat
We had some pretty nice technical setups on this meme.
#HVF
#DoubleTop
#InverseHeadandShoulders
#BullFlag
Currently it has two active patterns ...
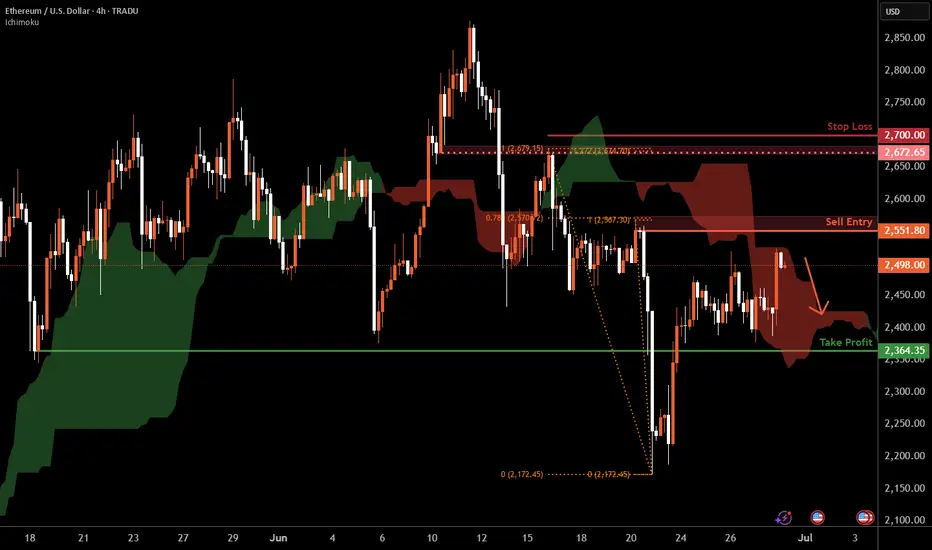
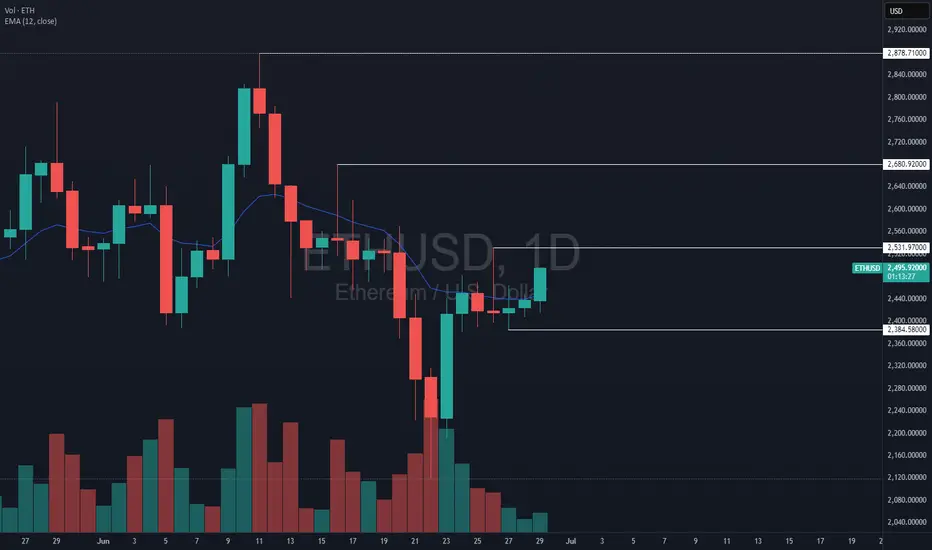
Ethereum H4 | Potential bearish reversalEthereum (ETH/USD) is rising towards a pullback resistance and could potentially reverse off this level to drop lower.
Sell entry is at 2,551.80 which is a pullback resistance that aligns closely with the 78.6% Fibonacci retracement.
Stop loss is at 2,700.00 which is a level that sits above the 127.2% Fibonacci extension and an overlap resistance.
Take profit is at 2,364.35 which is a pullback support.
High Risk Investment Warning
Trading Forex/CFDs on margin carries a high level of risk and may not be suitable for all investors. Leverage can work against you.
Stratos Markets Limited (tradu.com ):
CFDs are complex instruments and come with a high risk of losing money rapidly due to leverage. 63% of retail investor accounts lose money when trading CFDs with this provider. You should consider whether you understand how CFDs work and whether you can afford to take the high risk of losing your money.
Stratos Europe Ltd (tradu.com ):
CFDs are complex instruments and come with a high risk of losing money rapidly due to leverage. 63% of retail investor accounts lose money when trading CFDs with this provider. You should consider whether you understand how CFDs work and whether you can afford to take the high risk of losing your money.
Stratos Global LLC (tradu.com ):
Losses can exceed deposits.
Please be advised that the information presented on TradingView is provided to Tradu (‘Company’, ‘we’) by a third-party provider (‘TFA Global Pte Ltd’). Please be reminded that you are solely responsible for the trading decisions on your account. There is a very high degree of risk involved in trading. Any information and/or content is intended entirely for research, educational and informational purposes only and does not constitute investment or consultation advice or investment strategy. The information is not tailored to the investment needs of any specific person and therefore does not involve a consideration of any of the investment objectives, financial situation or needs of any viewer that may receive it. Kindly also note that past performance is not a reliable indicator of future results. Actual results may differ materially from those anticipated in forward-looking or past performance statements. We assume no liability as to the accuracy or completeness of any of the information and/or content provided herein and the Company cannot be held responsible for any omission, mistake nor for any loss or damage including without limitation to any loss of profit which may arise from reliance on any information supplied by TFA Global Pte Ltd.
The speaker(s) is neither an employee, agent nor representative of Tradu and is therefore acting independently. The opinions given are their own, constitute general market commentary, and do not constitute the opinion or advice of Tradu or any form of personal or investment advice. Tradu neither endorses nor guarantees offerings of third-party speakers, nor is Tradu responsible for the content, veracity or opinions of third-party speakers, presenters or participants.
BTC/USD Technical Analysis – Weekly Elliott Wave StructureIn this video, we analyze the weekly chart of Bitcoin ( BYBIT:BTCUSDT ) using Elliott Wave theory.
The current structure suggests the beginning of a new bullish impulse (waves 0, 1, and 2) following a clearly completed and technically correct corrective phase.
We explore potential impulsive scenarios starting from wave 2, using Fibonacci extensions to project possible targets and identifying key support zones and invalidation levels.
This analysis aims to provide a macro perspective based on price action, helpful for traders and investors following BTC from a medium- to long-term technical view.
🛑 Disclaimer: This content is for educational and informational purposes only. It does not constitute investment advice. Each user is responsible for their own trading decisions.

Dogecoin $1.17 Next Target (591% Profits Potential)From its June 2022 bear market low, Dogecoin managed to grow more than 880% to its December 2024 peak price. The peak happened around the 0.618 Fib. extension level.
The next major level based on Fibonacci proportions in relation to the 2021 bull market/2022 bear market stands at $1.17, this would give us 591% profits potential from current price and a total of 2281% total growth coming from the June 2022 bottom. That would the total size of the bull market for Dogecoin if it peaks at $1.17, more than 23X.
Prices go up but they don't remain up. After a bullish wave there is always a correction. After a bull market there is always a bear market.
Dogecoin is now back at baseline levels but within a higher low. All the same resistance levels that were conquered in late 2024 will need to be challenged again. All these levels will break easily. The main resistance will be found at $0.59 followed by the previous, 2021, all-time high, around $0.74.
What other resistance levels are relevant if the market doesn't perform great?
I will give you the exact numbers. Below the last high $0.35 is a relevant level. Hitting new highs compared to December 2024 $0.70 needs to be watched. New ATH $1.05 and the rest of the numbers mentioned before and shown on the chart.
My guess? Above $1.00. There is no reason for the market to peak any lower.
Thanks a lot for your continued support.
Namaste.

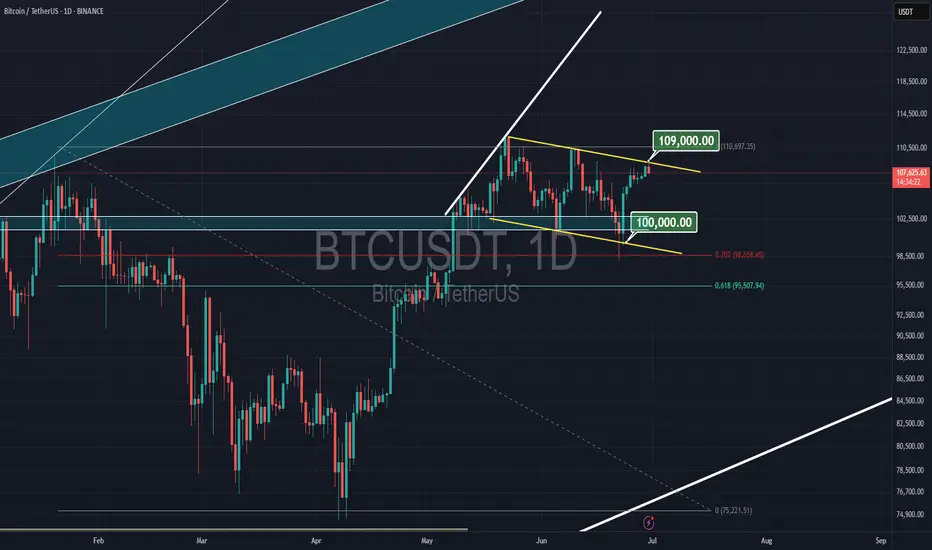
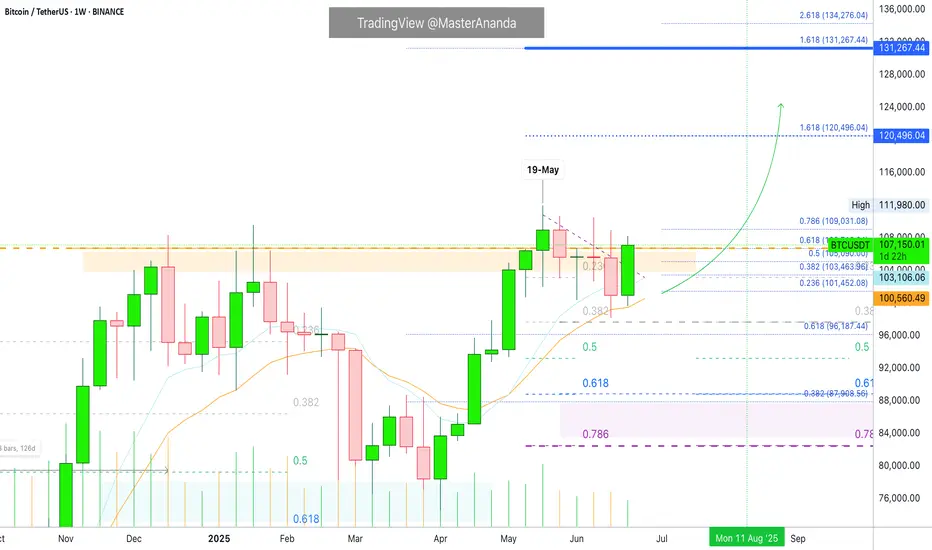
Bitcoin Weekly & $120,000This weekly Bitcoin chart says it all... Please, allow me to reveal to you what the future holds!
Good evening my fellow Cryptocurrency trader, what a wonderful day.
Only one week ever produced a higher close than the current price. Only once, 19-May, Bitcoin managed to close above $107,000... What happens if Bitcoin closes above $107,000? New all-time high confirmed.
Two days remain for the week to close and we—the bulls—only need to maintain a price of $107,000 or higher to send such a strong bullish signal that everybody will come out and start buying.
The next target on this timeframe is $120,000.
Bitcoin is using EMA13 as support. This level was tested and holds, the same for EMA8. When Bitcoin moved above these levels in April, it produced an advance from $83,000 to $112,000, more than 33%. The price now is $107,000 but instead of recovering from below EMA8/13, BTCUSDT is trading above; this means that the bullish bias is fully confirmed.
The weekly timeframe looks great. We can expect higher prices soon, with growth happening for an extended period of time. Bitcoin is very strong now and this is only the start.
I will continue to share proof that shows the entire Cryptocurrency market going up.
Thank you for reading.
Leave a comment with your questions.
Thanks a lot for your support.
Namaste.
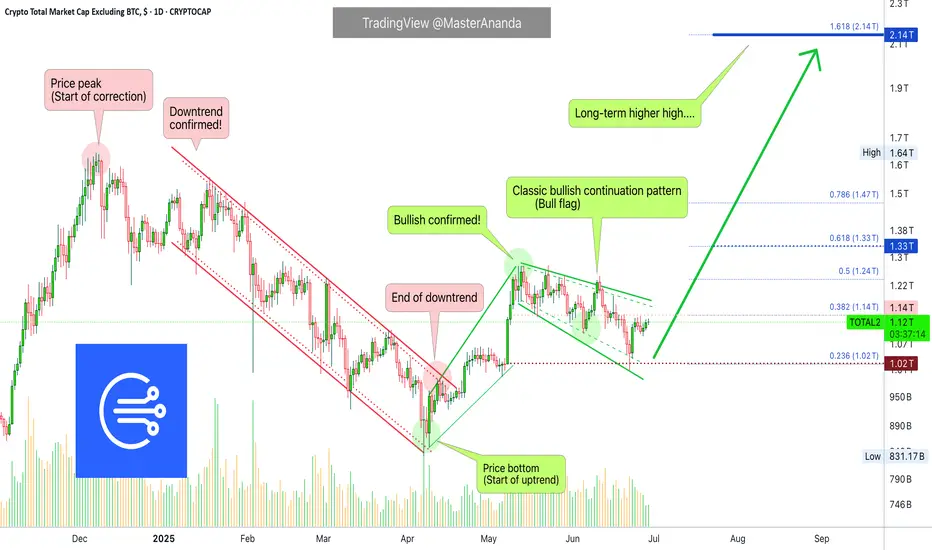
$420 Solana Within 2 Months —TargetsSolana is on a path to a hit a price target of $420 mid-term, within 1-3 months. This is the continuation of the uptrend that started in early April with the end of the previous correction and a more than a year long strong low.
This is not for the faint of heart. Solana is preparing for something massive, even scary but positive. $600+ is also possible but we are going step by step and $420 is the first step.
Immediately when prices start to rise Solana is likely to find resistance around $220 and $253.
The last high, January 2025, would be the minimum on this bullish wave. This would be price tag of $296.
The end of the retrace happened 22-June. This means that the market is already bullish for an entire week. Bitcoin is about to produce the best possible weekly close. As Bitcoin is ultra-bullish above $106,000/$107,000, the altcoins can continue to recover and will aim higher trying to catch up. Of course, no altcoin can catch up to Bitcoin but invariably the entire market will grow.
The wait is over, we are bullish now. Timing is great.
Bullish momentum will grow for weeks and then a major force will permeate the market, something not seen in many years. I hope you are prepared.
Namaste.

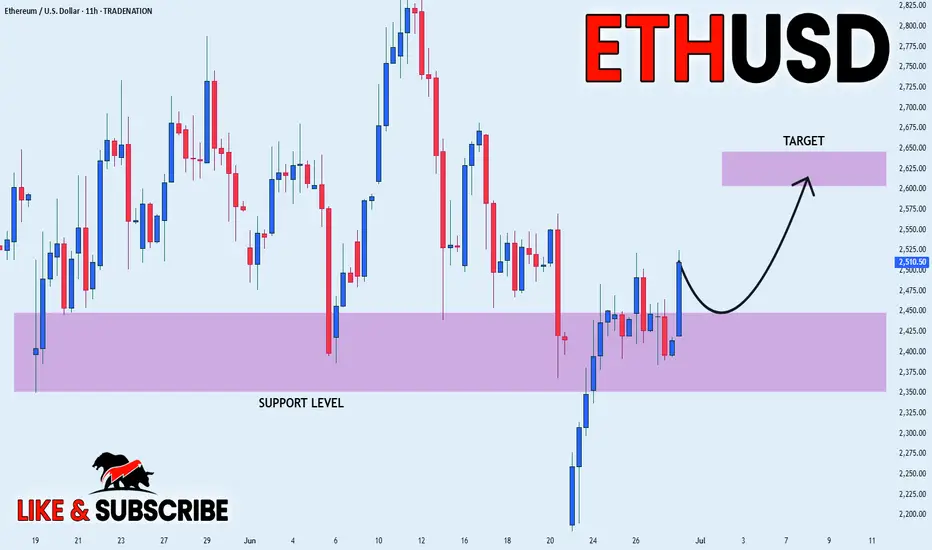
ETHEREUM WILL GROW|LONG|
✅ETHEREUM consolidated
Above the horizontal support
Around 2400$ and now we are
Finally seeing a bullish rebound
So we are bullish biased and
We will be expecting a
Further move up
LONG🚀
✅Like and subscribe to never miss a new idea!✅
Disclosure: I am part of Trade Nation's Influencer program and receive a monthly fee for using their TradingView charts in my analysis.
Can Ethereum start a daily uptrend?This daily uptrend might fail because btc dominance is strong but eth bulls are watching
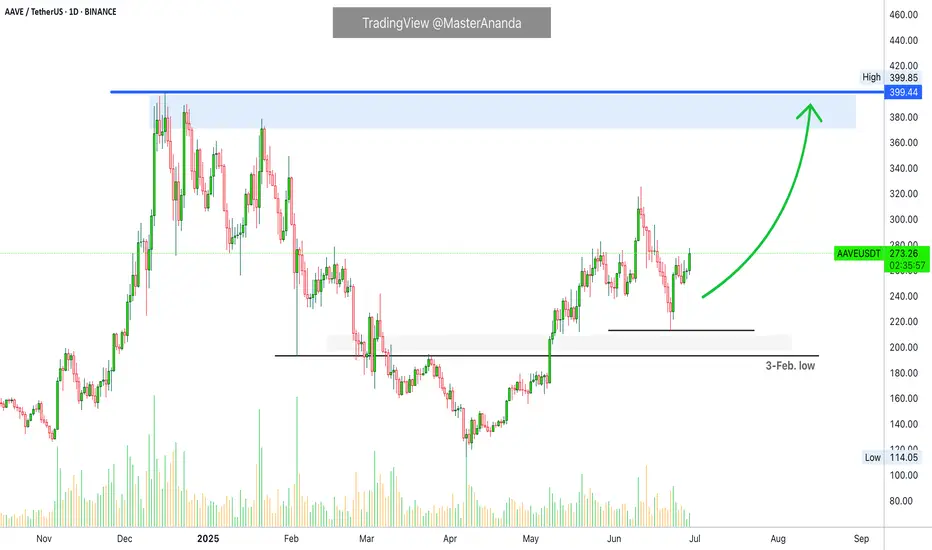
Aave: Next High the Dec. 2024 Price ($400), Then Higher...I thought about Aave today. The retrace was minimum, it was swift and strong. As soon as the retrace is over we get the continuation of the bullish wave. That is what I see on this chart.
The recent retrace did not reach the 3-Feb. low, and this is all you need to know.
Current action is indicative of the continuation of the bullish wave. When a move is very strong, with too much force, it cannot go for too long. This happened with the drop from 11 to 22-June. It was so strong and it ends in a flash. Once it is over there is no other place for the market to go. If the down-move is over, prices can only grow. Aave is growing now, it will hit $400 as the next target, the December 2024 high just to continue higher.
Expect more retraces and corrections along the way. Just as you saw a few weeks back, but always remember that retraces are just an opportunity to buy-in, rebuy and reload. The market will always recover and produce new and more growth.
Namaste.
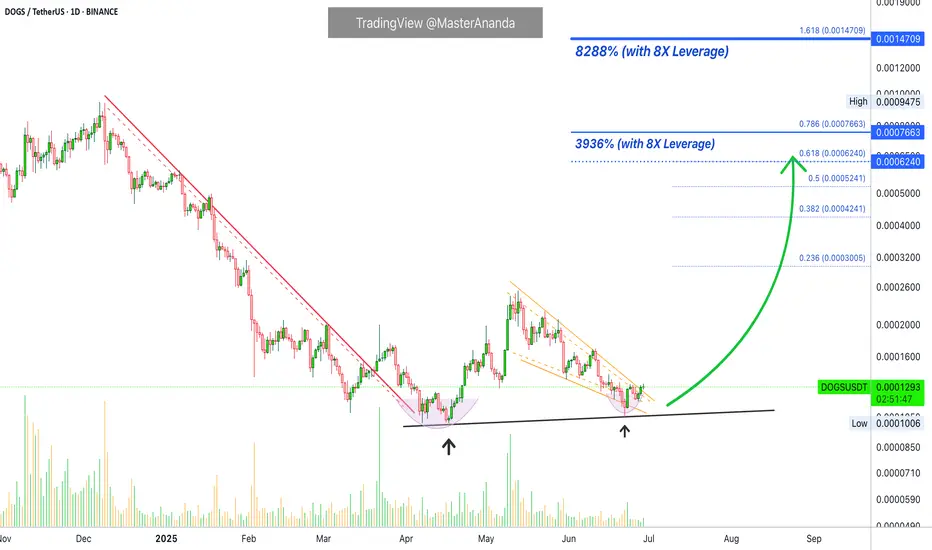
Dogs Can Yield 8,288% with 8X Leverage (Great Timing!)You are going to love me for giving you this... Why? Because you can make easily 1,000% profits. Perfect entry, perfect price, perfect timing. Easy win.
The market moves based on cycles and within these cycles we have waves... Good afternoon my fellow Cryptocurrency trader, how are you feeling today?
Feeling that feeling you get when you know you are getting close to something great.
Technical analysis
Let's focus on the chart. DOGSUSDT is now starting to recover from a higher low. Let's keep it very simple. Look at the chart and go back to 17-April. See? From this date prices start to grow until resistance is hit. It is the same. Starting 22-June the market starts growing slowly, building up speed; bullish momentum grows. Then resistance will be found at a strong higher high.
The main target for this chart setup and trade is 0.0007663. With 8X leverage this target, from current price, has a profits potential beyond 3,000%. There are even higher targets on the chart.
That's why I mention 1,000% at the start. It is very easy to collect 1,000% on this pair if you are smart. Not that smart just patient and wise... Well, you can do it if you truly want. I'll see you at the top.
Opportunities are endless.
This is just one and many more will be coming your way.
Put some time and effort into your trading, your buying and selling, and watch your capital grow. Together we can win.
Thanks a lot for your continued support.
Namaste.
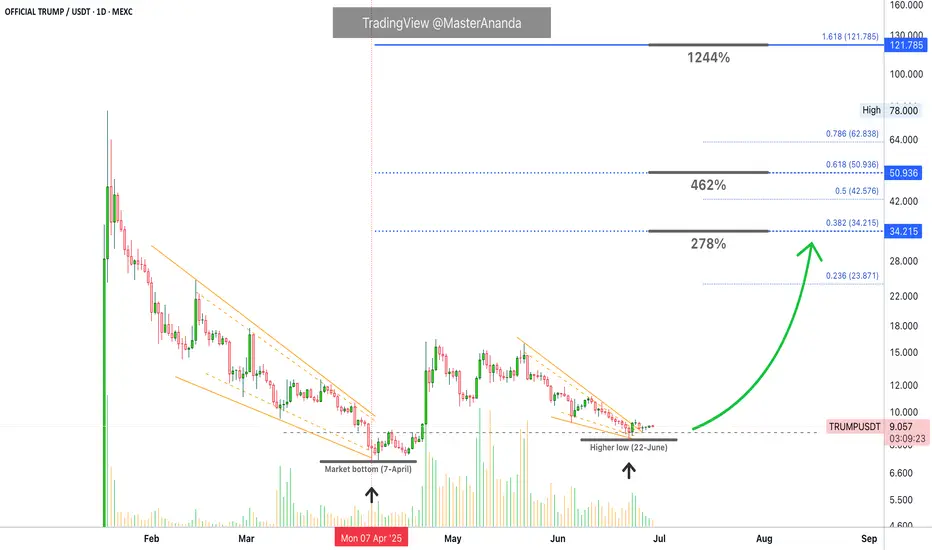
OFFICIAL TRUMP 1,244% Target Revealed & Map UpdateI have several questions for you:
1) Did the market break your patience? Are you still holding?
2) How much are you going to take? Will you go for 278% or maybe 1,244%?
TRUMPUSDT has been really uneventful lately and this is good, it means that consolidation is still happening and consolidation is a form of exercise for a trading pair; TRUMPUSDT is building strength.
From a technical analysis perspective, the chart is great, still bullish continues bullish; looks good. Because the action continues to happen as a higher low compared to 7-April. 7-April is the market bottom, as long as this level is not challenged or broken we are now in the bullish zone.
The move that peaked in late April is the initial bullish breakout. The higher low 22-June marks the point where the retrace from the initial bullish breakout ends. 22-June can also signal the start of the next upthrust. From here on we will see growth.
Higher lows lead to higher highs. We have a very clear, strong and ecologically sustainable higher low. This means that a higher high comes next.
Here is the tricky, not so tricky part: TRUMPUSDT will grow to $50, $62, beyond $100 and so on, but, not all growth happens in a single wave. Just as TRUMPUSDT moved from $7 to $16 and then stopped, it can move from $9 to $34 and then make another stop, this one short. Then another rise toward $50 and so on. The market never moves straight down but neither straight up. And this gets us to my point. Will you sell when resistance is hit to later buy back lower, or, will you continue waiting until the market top, higher targets?
That's the question you need to answer to maximize profits when the action goes green. If you decide you want to sell the wave, then make sure to prepare to sell when the market is green. What happens is that if you don't sell when green but wanted to take some profits then you will do so when the market is red. In this case you will not be taking out the maximum possible...
Anyway, we have to leave something for another day. TRUMPUSDT will grow, for certain, but it takes time. Patience is key.
Thank you for reading.
Namaste.
What is Needed for BTC-Altcoins Bull Market —Crypto is Going Up!Some people are under the impression that Bitcoin needs to go down for the altcoins to go up. No, no, no, no, no... This is a big mistake. Bitcoin needs to continue growing for the altcoins to explode. Let me explain.
Bitcoin has been trading very high forever now and the altcoins grow when Bitcoin is very strong. The current situation with Bitcoin is good for the altcoins but the altcoins need a major force, a strong impulse and maximum support for a bull run and this only happens when Bitcoin goes up.
If Bitcoin retraces from resistance this is bad for the altcoins. Whatever gains tend to be removed right away. If Bitcoin moves forward and hits a new all-time high, this is incredibly beneficial for the altcoins and the altcoins continue growing for the long haul.
Instead of Bitcoin going down or falling behind for the altcoins to grow, Bitcoin needs to continue strong. A stronger Bitcoin is good for the altcoins. The more Bitcoin grows, the more pressure the altcoins market feels to follow.
As long as Bitcoin trades above $100,000, the altcoins can do great. If Bitcoin falters, the altcoins suffer but this is only short-term.
Regardless of what happens in the short-term, Cryptocurrency is set to grow. We will experience the best yet since 2021. This bull market will extend beyond 2025 and it will go into 2026 and who knows, maybe even beyond.
100% certainty, you can bet your house on it; Crypto is going up.
Namaste.
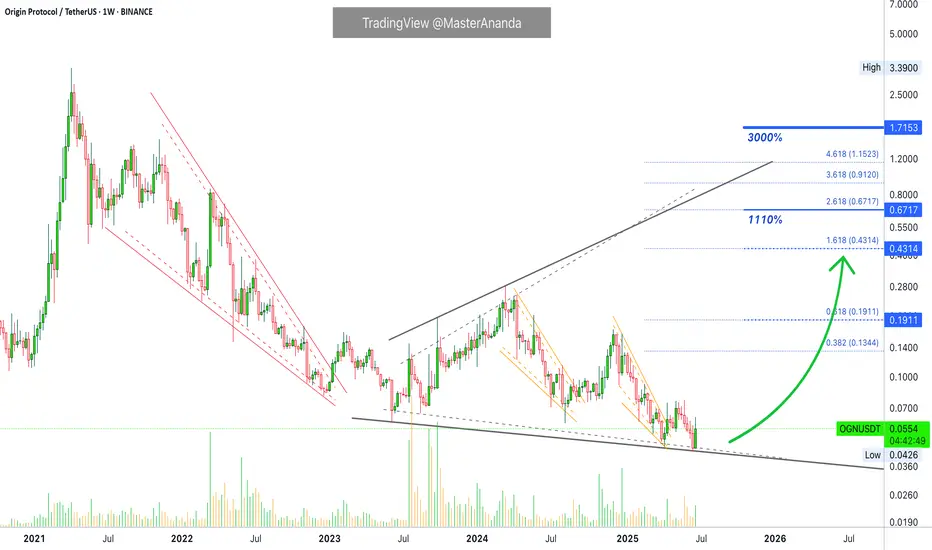
Origin Protocol 1110% Target Explained & 3000% Prev-Bull MarketOrigin Protocol has been moving within a massive broadening channel since December 2022. Now trading within its lower boundary. The upper boundary works as resistance while the lower boundary works as support. Whenever the action starts to happen close to the lower boundary this becomes a buy-opportunity, this entry can be used either for the short- or long-term. With the current market situation, the best focus is long-term. A 6 months time window.
Origin Protocol (OGNUSDT) produced a 3,000%+ bullish wave back in the 2021 bull market. We know for a fact now that this pair can produce wild gains. The price that launched this wave was 0.1068, the peak was 3.39. In comparison, the bottom in 2025 stands at 0.0426. The next peak can be anything but we have plenty of room available for growth. On the chart I have a 1,110% target and this is an easy one. This project is likely to grow 2,000% or more. Can be 3,000%. 1,110% is the safe, strong, easy target.
Thank you for reading.
Namaste.
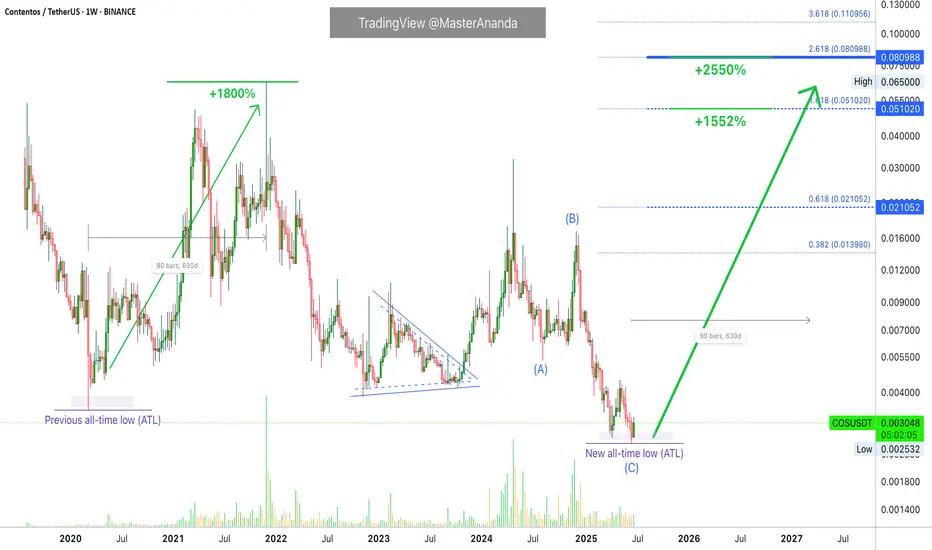
Contentos 1550% Potential, Bitcoin & The Evolution of FinanceThe previous all-time low happened March 2020, more than five years ago. The "new all-time low" happened last week, 22-June, just a few days ago.
Contentos, we traded many times before in the past and it has been mixed but mostly a success. How are you feeling right about now? Are you ready for a new try on this Cryptocurrency trading pair?
The last bullish cycle produced a nice +1800% bullish wave, 19X. This time around something similar can happen, growth potential can be capped at 1550% or it can go higher, 2500% or more.
The chart is a standard one. A small cap. project so the action this year resulted in a new all-time low. This atl is the base from which the 2025 bull market wave will develop. Currently, we are seeing the best entry prices available before this event.
A major event truly for the market. There will be millions upon millions of participants exchanging crypto, talking crypto, living crypto, using crypto, buying crypto. It will be something not experienced before.
It will be the first bull market with the approval and even support of the US government and the recognition of all the important nations of the world. (The nations that are against Crypto are irrelevant and rooting for slavery basically. They are against growth, prosperity and freedom. It is as if the world was getting rid of slavery and some nations are against it, that's the best analogy.)
The stage is set for Cryptocurrency to take over. The evolution of finance right in your face.
We are living the most exciting financial times in the history of humanity, when money made a leap from centralized to decentralized; it is a development as big as the invention of the printing press. The world will never be the same. Prosperity will be the norm. Everybody will have access to banking; anybody can access, use and enjoy Bitcoin with as little as just a cell phone.
Namaste.
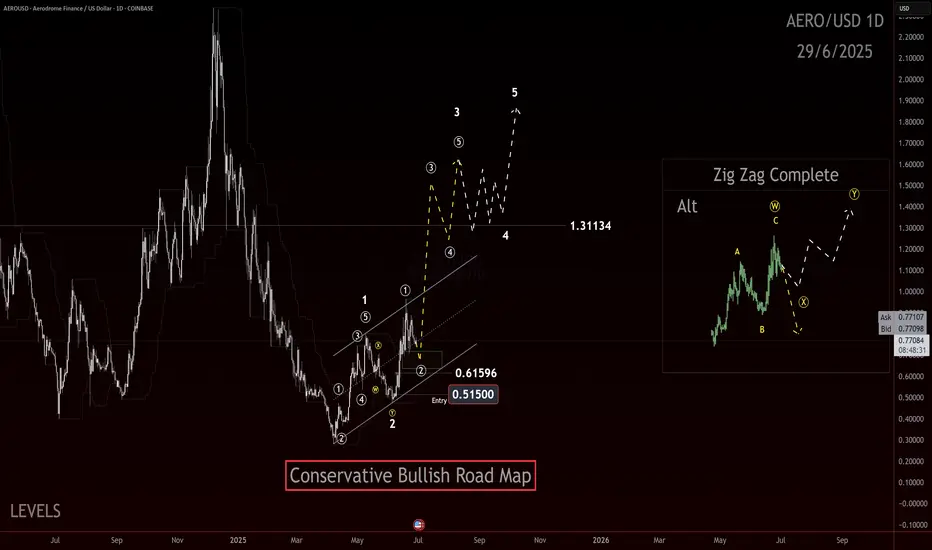
AERO, break down or the sound barrier!?If you find this information inspiring/helpful, please consider a boost and follow! Any questions or comments, please leave a comment!
AERO started by showing the kind of impulsive structure that could lead to a much larger advance. The internal retracement off the low was deep enough to flush weak hands but shallow enough to retain the broader bullish context.
The structure looks like a completed wave 2 correction: a double zigzag down into that .51-.61 pocket, finishing with an impulsive pop off the lows. That initial thrust is exactly the type of reaction you want to see if this is the early stages of a wave 3 or C advance.
What’s next? Ideally, price continues to respect the 0.615 level and we see price return back to the channel and then breaks above it with momentum, signaling the start of the next leg up. A clean swift move above .965 would help confirm that bulls are in control and we’re not dealing with an extended corrective mess.
Upside targets are layered: 1.31 is the first zone to watch—an area of prior structural reaction. Beyond that, the move has potential to extend above 1.80+ in a classic wave 5 push, provided we continue to see impulsive follow through.
Bias is bullish while price holds above .61 and continues to print higher lows. Any significant break back into that .51-.61 zone without reclaim would invalidate this setup and shift focus back to low prices.
Trade safe, trade clarity!
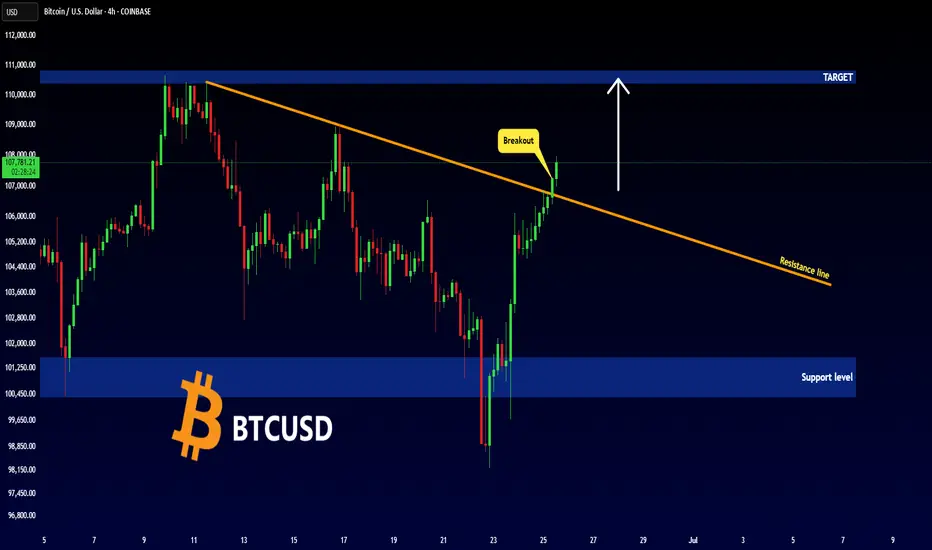
BITCOIN - NEW BREAKOUT !Hello Traders !
The BTC failed to break the support level (101570 - 100377).
Currently, The resistance line is broken !
So, I expect a bullish move🚀
___________________
TARGET: 110400🎯