Livepeer Strong Performer: Opportunity Missed? Never Too LateLivepeer was one of the strongest performing pairs between April and May growing some 340%. I look at this one frequently but somehow in the last cycle missed it and what a costly mistake.
It tends to happen, there are so many pairs, so many good projects and so many good opportunities that it is hard to catch them all. One that performs good tends to continue to do so for the entire cycle, meaning, Livepeer can continue to advance, to move forward and grow strong. Notice the chart.
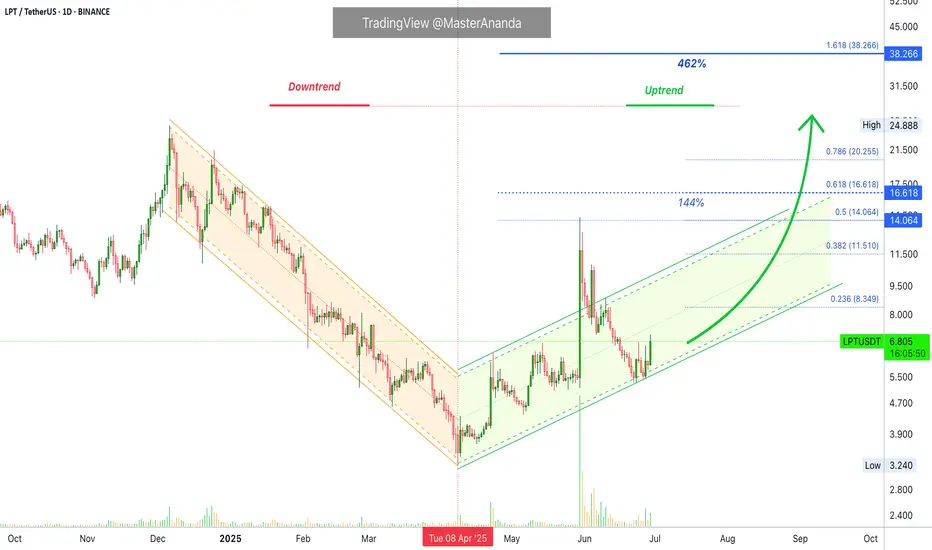
Livepeer—LTPUSDT
Here we have the downtrend and the uptrend. It seems more clear now. It seems quite certain now. This chart leaves no room for doubt. After 7-April we are in bullish territory higher highs and higher lows with bullish momentum building up it will only continue to grow.
$38 as the next main target gives a nice 460% potential for growth. Mid-term, long run there is more, more, more, are you ready for more? More in the sense that the 340% previous bullish wave, or bullish jump, was great but we were not around but this is not the end. More in the sense that this is just the beginning and I love this chart because it confirms everything that I've been sharing and everything that I will share. More and higher. The altcoins market is just getting started. Prepare for higher prices. How will you maximize profits in this bullish wave?
Thanks a lot for your continued support.
You are truly appreciated and if you are reading this now... I am wishing you tons of profits and continued success. You deserve it of course. You deserve everything you wish since the day you were born. That's just my belief.
I appreciate the fact that you do take the time to read.
If you enjoy the content follow me.
Namaste.
Crypto
HIVE: When To, How To?I've been tracking HIVE for a while and now I want to show it to you, it will be a good money maker if you decide to "jump in." Let's go back to some basics signals.
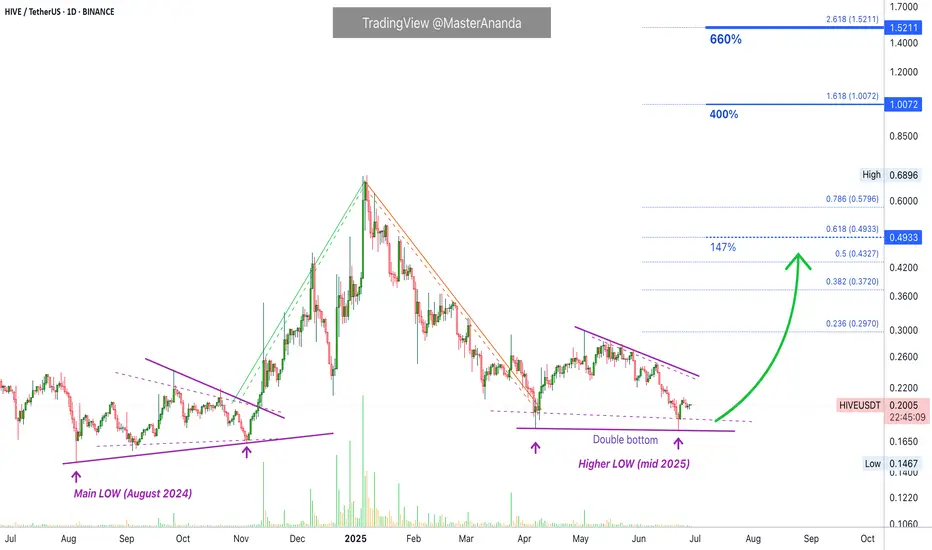
HIVEUSDT Technical Analysis
In August 2024 we have the main low and subsequent higher low in November. In 2025 we have a long-term higher low, April & June and also a double-bottom. That's the classic.
The higher low points to a higher high for the new bullish wave that will develop in the coming days and weeks; the double-bottom points to the low being in and current prices being good for a trade setup with low risk vs a high potential for reward.
When to sell
I have a friend and he is a scientist, he asked, "Hey Alan, when should I sell? Should I go for 400% or 660%?" It is always the same question.
I said, "You can do whatever you want of course..." He wasn't satisfied. Imagine, the scientific mind. "Yes, but how do I know if the right target is the one where you placed 400% or the 660%?" He said. You know, the scientific mind is never satisfied unless supplied with specific answers.
"Well..." I am preparing myself to give a reply that will require no additional questions. "How you approach the targets will fully depend on your trading style, that is, your goals, your capital, your risk tolerance and how confident you feel about my analysis, the targets and the chart."
"What?" Listen, you just buy and hold and contact me after three months. You'll know what to do when prices are up... Just kidding of course.
Namaste.
Bonfida —Solana Name Service Strong 900% Target MappedI have another one for you and this one we've been looking at for some time. Bonfida —Solana Name Service (FIDAUSDT).
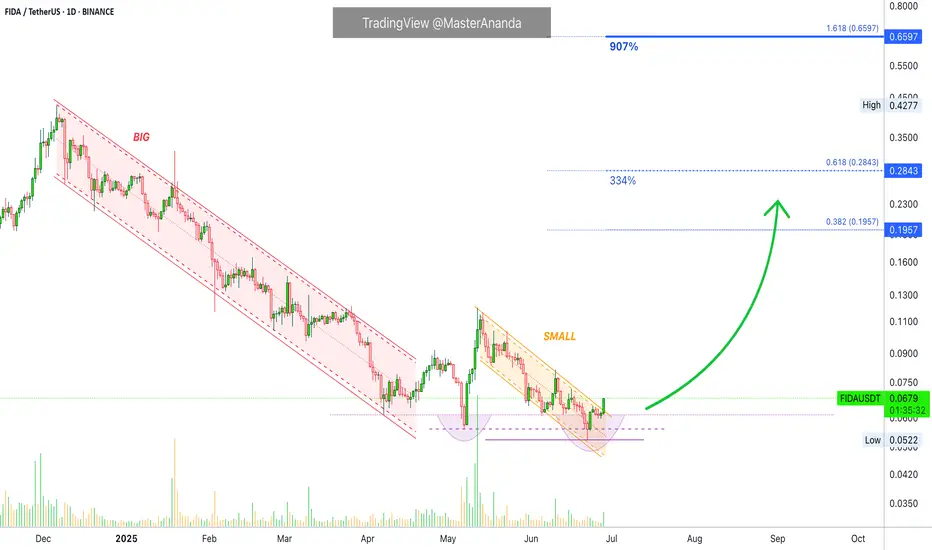
This is a good project, based on the chart. The December 2024 high was set at 0.4277. This is a "mandatory" target, that is, an easy hit or must hit because the market tends to challenge resistance just as it challenges support.
On the down-wave the last low was broken completely, then sideways a little bit and now comes the change of trend. On the up-wave the last resistance will be challenged and broken and this is how 900% becomes possible mid-term, it will be awesome. It is not the same reading about potential profits and predictions vs experiencing the results. Imagine how nice you will be feeling when your money grows but for this to be possible now you must buy and hold.
I expect higher prices of course and this will be confirmed soon enough, for now, the targets on the chart are more than ok. We are not greedy, to be honest, we are happy with 200%, 300%. But, knowing how strong Cryptocurrencies potential is, we aim higher but always securing profits.
Make a habit of securing profits on the way up. If you can accumulate many small wins, eventually you will reach the big ones. Start small and grow big. That's one way, or simply wait for the top. Regardless of your choice, you will be successful in this cycle; we have the right experience, we have the right guidance, we have what it takes.
I am happy to have your support. Thank you for reading again.
Namaste.
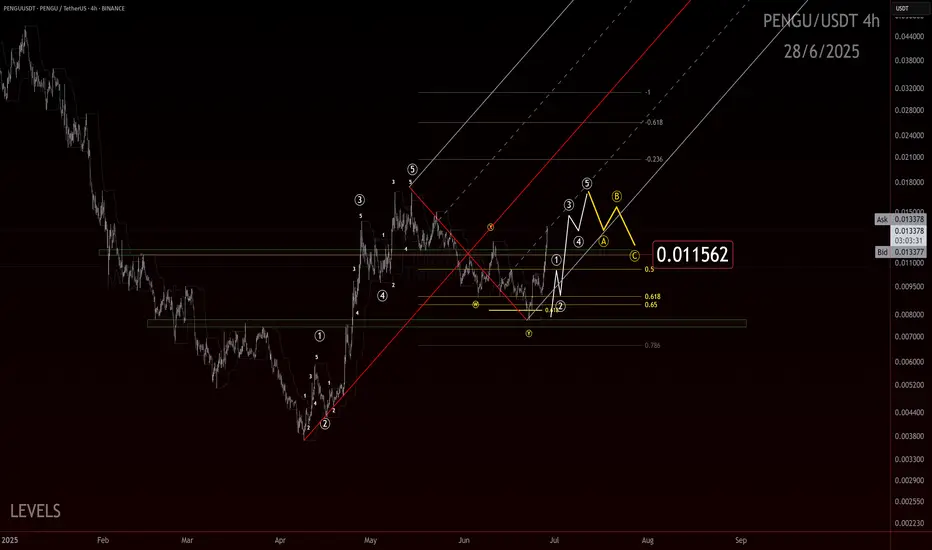
Penguins Can’t Fly, But This Chart Might If you find this information inspiring/helpful, please consider a boost and follow! Any questions or comments, please leave a comment!
The move off the low looks like a clean, completed impulse wave sharp, decisive, and showing solid structure. After that, we had a double ZZ retracement. While it was a bit deeper than the textbook ideal, it still fits perfectly within the normal range you’d expect for a healthy correction. Now, we’re seeing another smaller-degree impulse forming from the .007 pivot, suggesting that the market is gaining momentum again.
Here’s what we’re watching closely:
The secondary impulse off .007 continues to build structure.
We want to see a pullback after impulse completion that ideally holds above the .011 region, showing the market respects previous support and AOIs.
The structure of this potential pullback needs to be corrective rather than impulsive to confirm bullish continuation.
A clean move above prior swing highs would confirm that the larger wave 3 or C is underway.
Overall, this chart is ticking the boxes for a potential larger upside push if the market respects key levels and continues to print impulsive structure higher.
Trade Safe!
Trade Clarity!
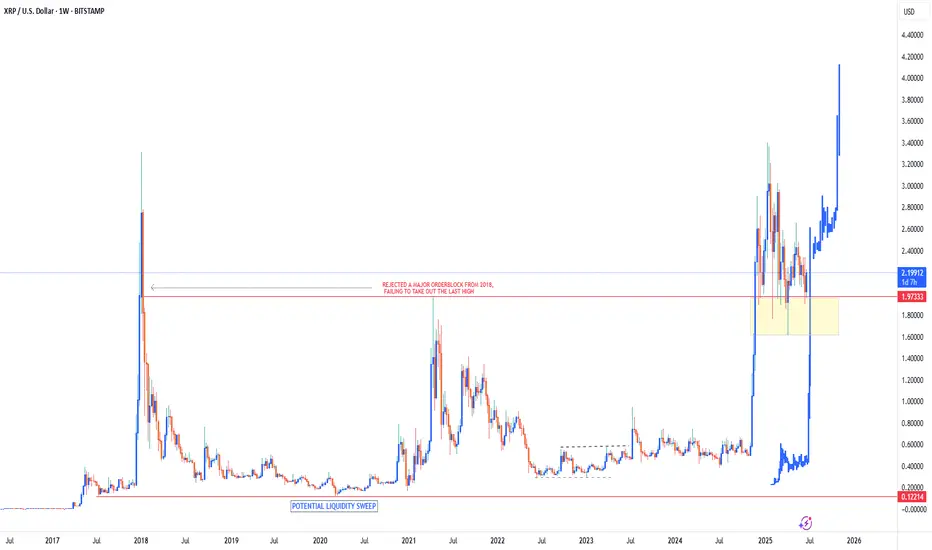
XRP Bullish to ATH of $4.10Since breaking out of its 6 year price range of $0.12 - $1.97 in November 2024, Ripple has remained within a bullish territory, sitting just above its support zone of $1.60 - $1.97.
As long as price can remain above this support zone I do believe that Ripple has much more upside to come in the next few YEARS. This definitely won’t be a fast move as there’s still a lot of legal situations involving XRP which is keeping price limited to the upside. But, as these legal battles come to an end & they will, it will slowly give XRP room to move to the upside.
I definitely see $4.1 as an achievable target for Ripple as the first target in the future. Once this price is reached, market structure & price action will give us a better indication of whether or not we can see high prices above the $4.1 target.
For now just be patient & let XRP play out in accordance with its external macro factors.
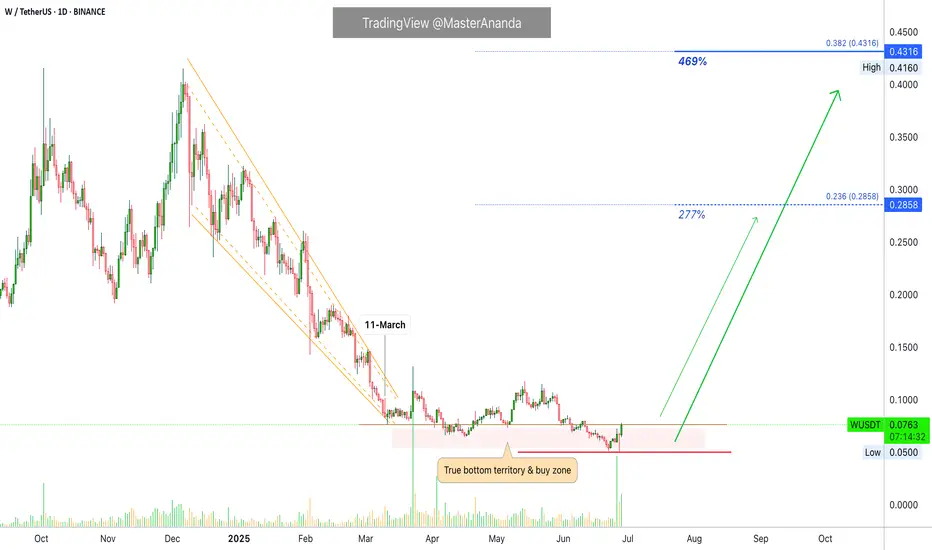
Wormhole Token Recovers From Bottom & Activates 2,400% PotentialTrue bottom and true recovery. We have a great situation here, this is a pair that has more than 2,400% potential for growth. The chart looks great right now, the signals are strong and confirmed.
Good afternoon my fellow Cryptocurrency trader, I hope you are having a nice Saturday. Let's consider this chart, a great opportunity for sure.
Wormhole Token (WUSDT) entered bottom zone 11-March, so already 111 days trading at bottom prices. The best time to buy.
After this initial low in March we have huge volume after a few days, and just two days ago another strong buyers day with a followup composed of two bullish signals. The DragonFly Doji yesterday and the full green candle today.
These are all strong bullish signals fully confirmed, which means higher prices next. I am showing only the daily chart but the potential for growth is extraordinary when focused on the long-term. This publication is time-based.
Right now we have great entry timing and prices...
The time is right, the time is ripe.
Another great altcoin for those looking to profit massively from the 2025 bull market.
Thank you for reading.
Namaste.
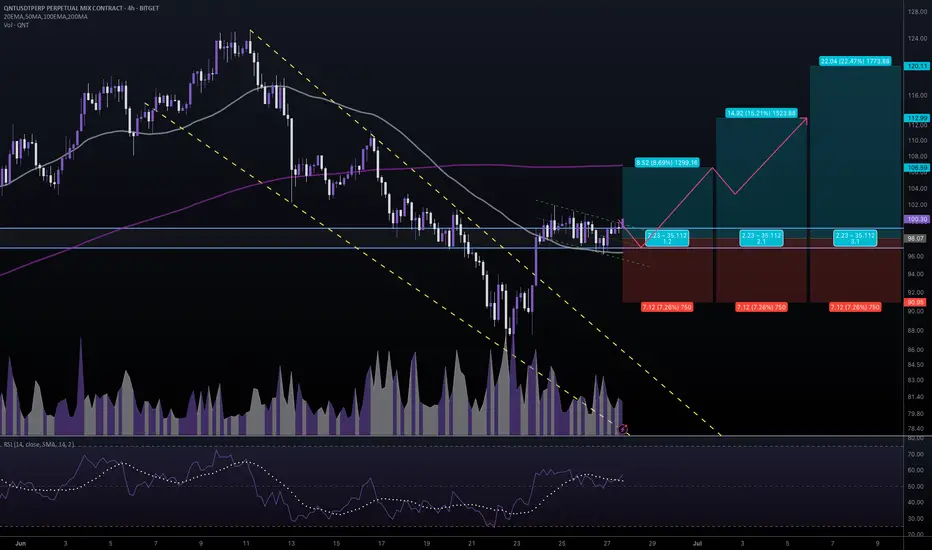
#QNTUSDT #4h (Bitget Futures) Bull flag near breakoutQuant regained 50MA support after breaking out of the falling wedge, bullish continuation seems likely.
⚡️⚡️ #QNT/USDT ⚡️⚡️
Exchanges: Bitget Futures
Signal Type: Regular (Long)
Leverage: Isolated (6.0X)
Amount: 4.6%
Current Price:
100.30
Entry Zone:
99.22 - 96.92
Take-Profit Targets:
1) 106.59
2) 112.99
3) 120.11
Stop Targets:
1) 90.95
Published By: @Zblaba
GETTEX:QNT BITGET:QNTUSDT.P #4h #Quant #RWA quant.network
Risk/Reward= 1:1.2 | 1:2.1 | 1:3.1
Expected Profit= +52.1% | +91.3% | +134.8%
Possible Loss= -43.6%
Estimated Gaintime= 1-2 weeks
BRIEFING Week #26 : Are we going for a Bubble ?Here's your weekly update ! Brought to you each weekend with years of track-record history..
Don't forget to hit the like/follow button if you feel like this post deserves it ;)
That's the best way to support me and help pushing this content to other users.
Kindly,
Phil

BTC - Will the Bears finally get their chance?Buy Side Liquidity Sweep in Progress
Price is currently climbing toward a region densely packed with resting buy side liquidity, marked by multiple previous highs. The area around 108,900 to 111,000 is especially significant, with two clear liquidity pools stacked above recent swing highs. These levels are likely to attract price as market participants seek to trigger stop orders and induce fresh buying interest—setting the stage for a potential reversal.
Weakness in the Current Impulse
The recent rally has advanced with minimal retracement and virtually no visible Gaps. This lack of corrective structure often indicates imbalance and suggests the move is overextended. When price moves upward too cleanly, it tends to leave behind thin liquidity zones, making the entire leg vulnerable to a sharper correction once exhaustion sets in.
Fair Value Gap as a Draw Below
Below current price lies a prominent bullish Fair Value Gap around 104,000. This inefficiency was left unfilled during the last leg up and may now serve as a magnet for price. These types of Gaps are often revisited by the market in an effort to rebalance supply and demand, especially after aggressive moves that break structure to the upside.
Once the higher liquidity levels are swept, watch for a clear reaction—either a strong rejection or lower timeframe structure shift—which could signal that the top is in. If that shift materializes, price may begin a downward leg targeting the unfilled Gap below. The magnitude of the move, combined with the lack of structure on the way up, leaves plenty of room for corrective action.
For those looking to engage, waiting for confirmation on a lower timeframe—such as a break of short-term bullish structure or the formation of a bearish Gap—can help time entries more precisely. In setups like these, patience is key: let the Sweep play out, observe how price reacts, and only then consider stepping in.

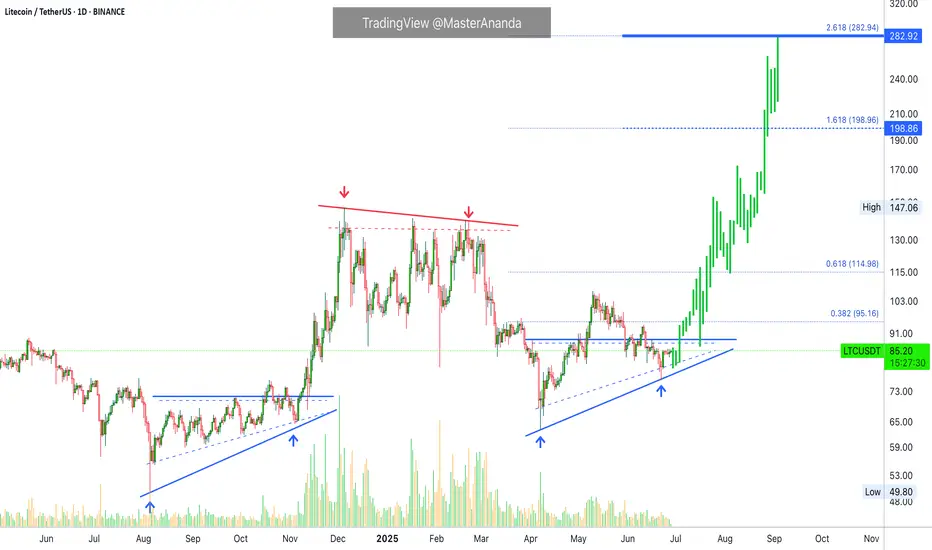
Litecoin ETFs Target $199 Followed by $283 Followed by...It will definitely go higher but, let's do it step by step. Litecoin is setting itself to move up with targets being first $199 and then $283, these are the main targets for this bullish jump.
It will go higher of course but the market tends to fluctuate, never straight down but also never straight up. It advances nicely and then stops, a stop that you sense can last only a few days can result in a correction lasting more than an entire month. When you see this happening, you question yourself, "Why didn't I sell when prices were up?"
And the same pattern repeats; over and over, again and again. Now, Litecoin will produce a new bullish wave. The retrace can last 3 weeks rather than 6 weeks. It can last 12 weeks rather than 6 weeks, I don't know. So, instead of being 100% right or 100% wrong, we can sell portions at each target and just be happy/grateful with the results. Or, we can plan ahead... Focus on maximizing profits because Litecoin is ready to grow, the continuation of the bullish move; the next "leg-up."
» Litecoin Exchange-Traded Fund (LTC ETF).
Do you think this is bullish? Think about Bitcoin's ETFs results. It can be mixed at first, volatility, but the end is always bullish. Strongly bullish. Hyper-bullish. Litecoin is very small compared to Bitcoin. It can be a major boom!
Thanks a lot for your support.
Namaste.
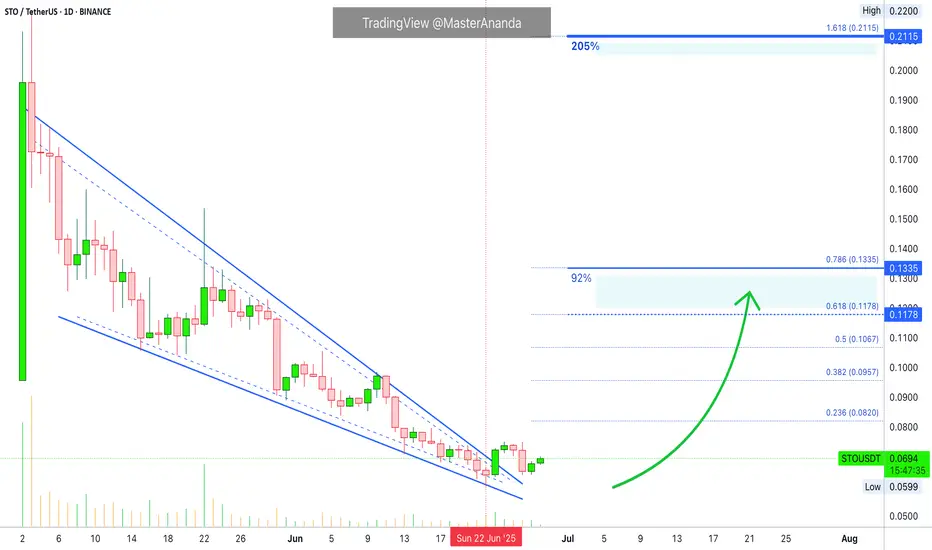
StakeStone, Falling Wedge & Easy 205% Profits PotentialIs it too early? It is never too early to be early. StakeStone started trading in early May, less than two months ago. The chart is young but the pattern is old; a perfect falling wedge.
There is a low 22-June and many pairs ended their correction on this exact day. StakeStoke broke out of the falling wedge pattern, based on an internal trendline, so there is already some signals favoring an up-move next.
Predicting the next move is not hard, up. What is harder is the timing, how long will it take for STOUSDT to start an upsurge? It is very close. It is so close now that I can say within days, or, I can also say that it is already growing because a low happened on the 22nd, but to say this we need confirmation.
The confirmation comes when prices move above 0.0750 and beyond.
This is a good chart. Very low risk with a high potential for reward. It is a good chart but remember that there is always risk involved. Market conditions can change, prices move down rather than up. If this happens, just wait patiently because a reversal is very close. This is only a warning, we are 100% bullish.
Thanks a lot for your support.
Namaste.
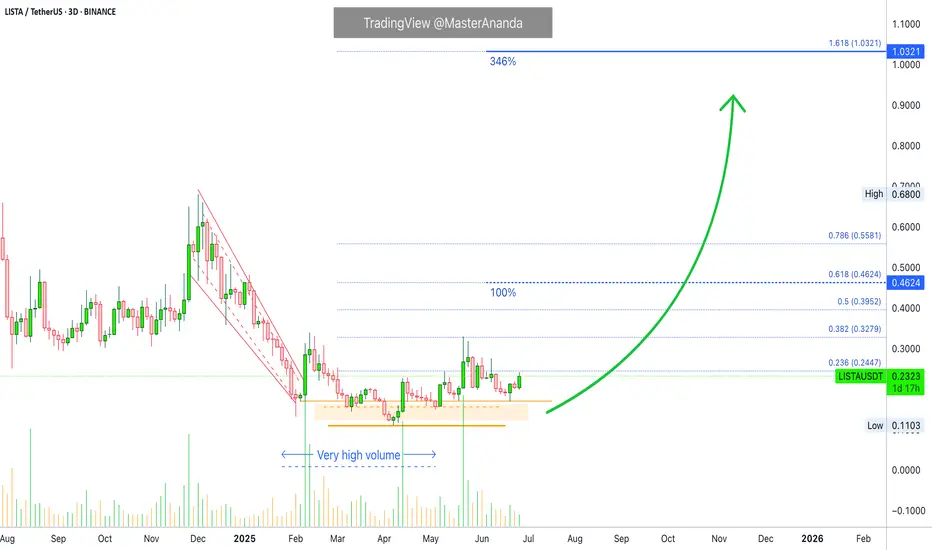
Lista DAO: 100% & 346% TargetsAnother interesting chart here, the candles might seen small but LISTAUSDT produced more than 200% between April and May, and it is ready to move again.
The action is happening now as a strong higher low and buy-volume has been really hiiiiigh lately going up, up, up. This type of chart supports a continuation, a new bullish move prices produce profits easy buy and hold.
I used this pair for a short-term trade because the chart is young. I am using the young charts for the short-term trades and the old charts for the long-term ones. Of course, there can be old projects with short-term trades but there can't be new projects with long-term numbers because data is missing from the chart.
To play it safe, we can predict easily where prices are headed next but a new project won't reveal its potential for the 2025/26 new all-time high, it is a hard, data-missing guess.
Lista DAO looks ready for another wave. The first support is set at 0.1692, the previous higher low and the first target is set at 0.4624 for 100% growth. The main target is 1.03 and this reaches a nice 346%. By the time the bull market ends, there can be more.
This is a strong chart setup because of the volume and the strong higher low. I wouldn't want to miss this one.
Namaste.
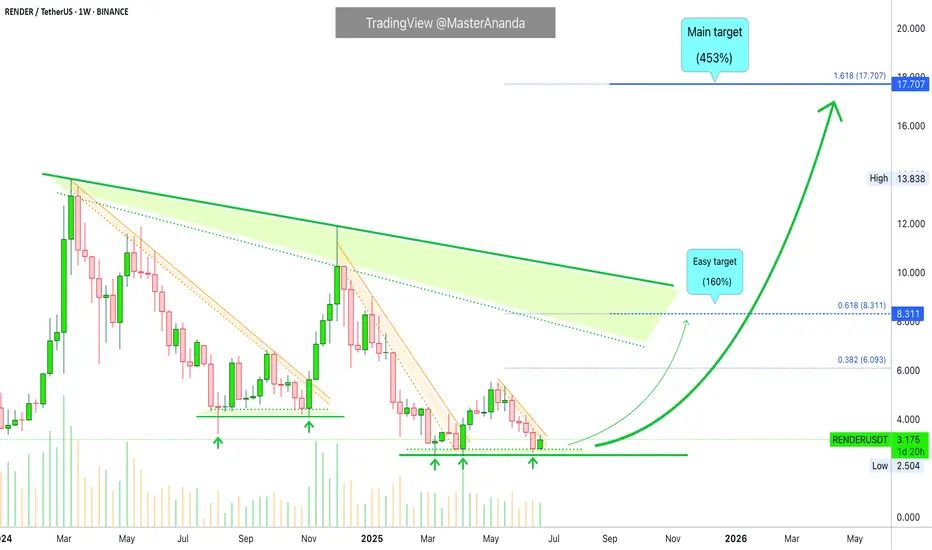
Render Token Buy Zone: New ATH $17.7, $27 & $46, 2025-26Render Token (RENDERUSDT) is moving within a strong buy zone. Any price below the 5-August 2024 low is a great entry when you aim for the 2025/26 bull market wave. That is, any entry below $3.41 is a very strong, low risk and high potential for reward buy. This is a solid pair.
Remember in 2024 when I told you it was going down, down, down, down? It has been going down for more than a year and three months. There is good news though, Render Token will go down no more.
The chart shows lower highs and lower lows. The last four months have the same base, no new lows. The lows in late 2024 are also not that far away.
Late 2025 & early 2026 targets (New all-time high)
The lower highs are part of a classic correction pattern, with the current chart structure opening up an easy 160% target. This is very easy.
The main target can reach $17.7 (PP: 453%) with higher prices being almost certain. The last target can be around $27 or $46, for these, we will have to wait and see.
When to sell
If the initial move has much force, buyers support and bullish momentum, we can aim for the higher targets. If the initial action is weak and there isn't enough market-buyers support, then we aim lower; it all depends on how the bull market develops but overall the potential is very strong. For Render, for Bitcoin and the rest of the altcoins.
Thanks for the support.
Namaste.
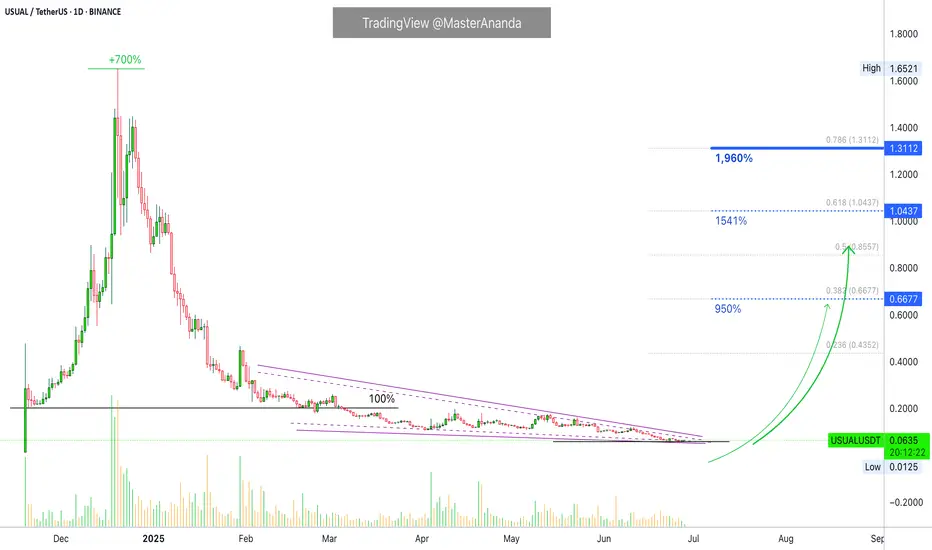
USUAL: Worst Case Scenario +950%; Strong Bull Market = 4,000%+First bull then bear then sideways with a slight downward bent. Notice how the candles are almost invisible now... This is the end of the current phase. When volume drops to a halt and the candles become almost invisible you can be certain that change is approaching this market. The pair in question is USUALUSDT—RWA.
The late 2024 bullish wave started from ~2000 sats and total growth reached ~700%.
Current price is ~650 sats and this opens the doors for 10, 20 or even 30X in the coming months. 20X is possible even without a new all-time high. I am adding this one to my list as it has huge growth potential and it is available on so many top exchanges.
The action went below 100%. This is good, we know there won't be any compulsion for prices to move lower. Once a bearish move goes beyond the low of the previous move, we are faced with a potential buy opportunity. That's what we have here.
There is basically no recovery in April, this is also good, it means the bulls have not used their ammunition while the bears must be running out. Many pairs produced a strong move in April and are recovering now in June.
The most interesting part is the easy target, it goes as high as 950%. Worst case scenario, we get 950% to 1,500% total growth within the next six months. If things go well, we will see a new all-time high with profits potential going off the chart. Beyond 4,000% is possible.
Thanks a lot for your support.
Namaste.
Bitcoin Bullish But... Support Zones (Incl. Altcoins)Bitcoin is bullish right now but we know things can change. As long as the action is happening within the blue and gray space, all is good, the bullish bias remains intact. If the action moves below the gray zone and enters the orange zone, this is the danger zone. This danger zone can turn into a buy opportunity or a wait and see approach.
On the other hand, if Bitcoin remains above the blue zone this is ultra-bullish short-term. This is specially bullish for the altcoins but it is bullish for Bitcoin as it reveals consolidation at high prices, but right now we have a lower high so anything goes.
The chart is mixed when looked at up-close. Bullish long-term and on all bigger timeframes. Corrections tend to develop from high prices.
One more thing to consider
When we look at the action short-term we can miss the bigger picture, we can become clouded with noise. The bigger range is $100,000 - $110,000, this is the new long-term support zone that is being established and created before additional growth. Bitcoin can remain here for weeks or even months, if this happens, the altcoins will continue to grow.
We are in a bull market. Bitcoin is obviously in a bull market as it is trading near its all-time high after years of growth. The altcoins are just getting started after years of sideways action... Some altcoins hit new all-time lows but still part of a broad, long-term consolidation phase. Many produced higher lows, some produced lower lows, it makes no difference.
The bear market ended in mid/late 2022 and the ensuing two years we had mix growth. Bullish waves and bearish waves, with the usual variations of course.
The year is now 2025 and Bitcoin is up, most of the big projects have been growing for years now and we are getting close to the final advance, the major fifth wave and the bull market bull run. When this happens, close to its end, all the smaller projects will produce the biggest growth in their history and this will be the boom that will catapult Crypto to take over the financial world.
It won't be the first time this event happens nor the last, the market will continue to fluctuate.
I know there is a lot of information out there and we can become uncertain with every drop, but look at the price; what do you see? Bitcoin is going up.
The altcoins are set to follow, the altcoins do what Bitcoin does.
Namaste.
Bitcoin, The Next High Is The All-Time HighThe title might be a bit misleading but, the truth is that Bitcoin stays bullish short-term and this is bullish on all terms...
Good afternoon my fellow Cryptocurrency trader, how are you feeling today?
Any day, any week, any moment; every month, place or year, the market provides everything we need to know. This information is made available to us through the chart.
Bullish Bitcoin
The present signal is the fact that Bitcoin remains very high, challenging resistance, after a strong recovery and advance. This is happening with the altcoins also.
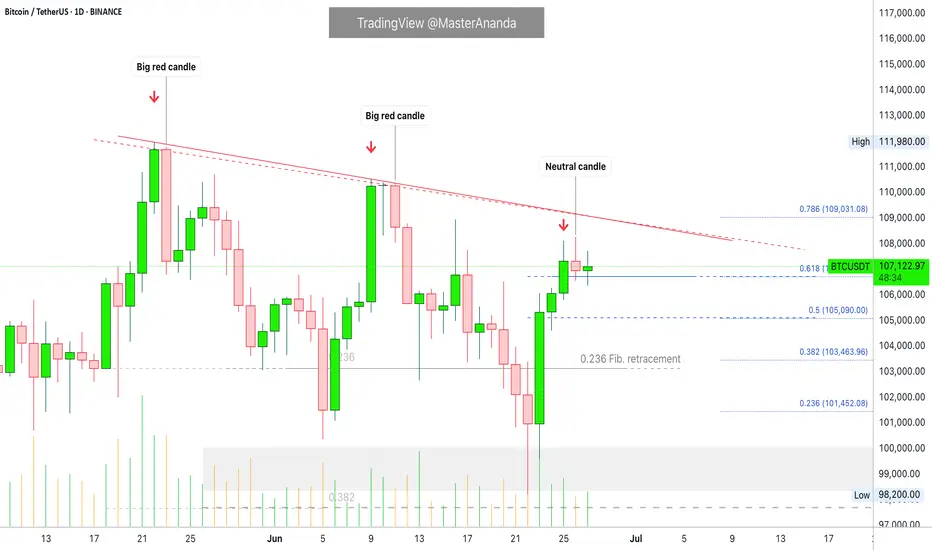
If you look at the last two peaks, as soon as resistance was hit there was an immediate crash. The next day was full red; very strong bearish action and momentum and this led to a new low. The situation is not the same today.
22-May peak. 23-May, strong bearish action.
9-June peak. 11-June, strong bearish action.
26-June lower high (not a peak). Today, neutral action. This neutral action is what I am taking as a bullish signal. Many other factors of course support this conclusion yet, this is still an early signal.
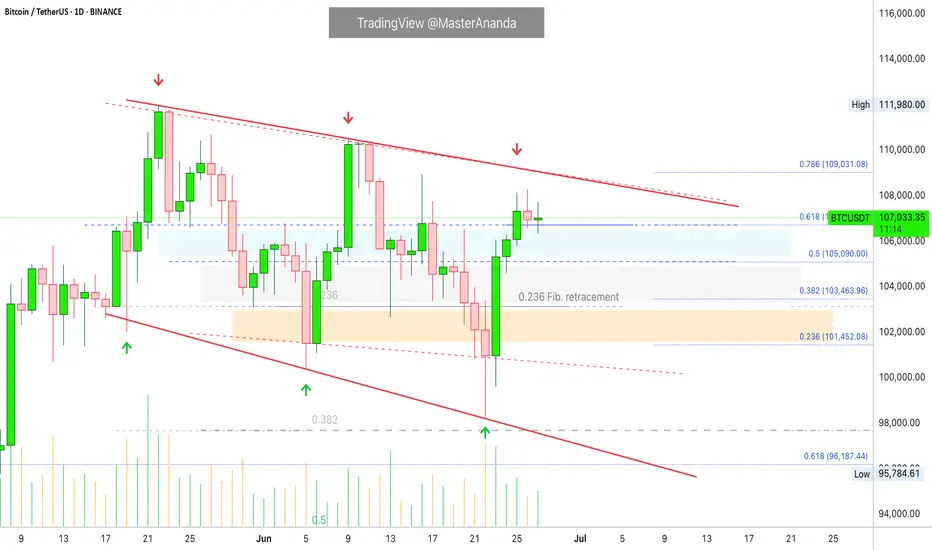
Fib support
A closer view of the daily timeframe:
4H. The grey line represents Fib. retracement. Dark blue—Fib. extension:
Conclusion
Each time there is a price peak a retrace follows, if there is no retrace then you are not witnessing a peak but rather a stop, a pause; resistance being met.
It seems that the current lower high is not the end but rather just a pause before additional growth. Market conditions can change.
It can happen that several days Bitcoin goes sideways with the bulls failing to garner enough strength. In this scenario, there would be a move lower before additional growth.
The present scenario shows a bullish chart even if prices drop, remember, the market is in no hurry.
Easy money
In September we will have lower interest rates and this is a bullish development for Bitcoin. Advanced money minds see easy money as inflationary for the currency, while Bitcoin is inflation-proof. So the dollar goes down and Bitcoin goes up.
I didn't quite develop this point, next time I'll do a better job.
Summary
The market is good even if it shakes. The market is good and isn't shaking, the recovery is already in place.
Bitcoin's price is very strong and there are many layers of support. The altcoins are in a similar situation, growing from the bottom up.
The Fed will reduce interest rates in September and then once more before the year ends, this is bullish for everything so, everything will be going up, at least everything that we are interested in, support and trade.
Thanks a lot for your continued support.
Never give up!
You are divine! You are blessed.
If you are reading this now, you will be blessed for your great timing. Hard work and dedication always pays.
Keep moving forward, keep pushing forward, never give up.
When life hits you hard, do take a break if you need it, only to comeback with new energy, a new mind and an infinite drive to achieve your goals.
You are the reason why Bitcoin exist... You are the lifeblood of the market.
Without you, nothing is possible. It is because of you that we all continue to grow.
Thanks again for taking the time to read.
I appreciate your support.
Namaste.
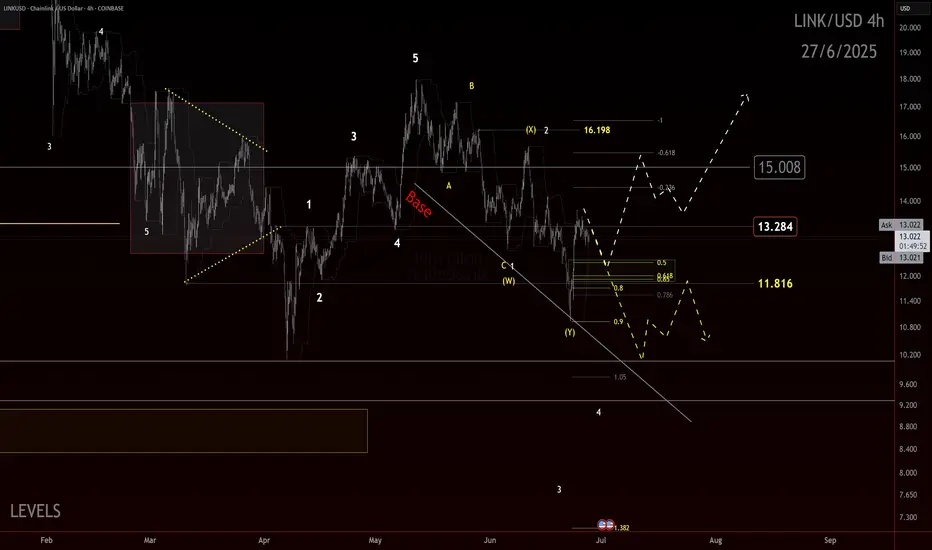
Final $LINK in the corrective chain?If you find this information inspiring/helpful, please consider a boost and follow! Any questions or comments, please leave a comment!
LINK could be finishing a double zigzag correction. Recent reaction at the channel’s most likely target area shows promise. Watching for an internal retrace that holds above key support.
Key Levels:
11.81: Ideal retrace floor
11.00: Break kills impulse idea
13.25: First upside flip needed
15.00: Big level to break for bulls
Bulls have been tricked before with possible impulse starts. This one has the right look and confluence, but caution is warranted. Ideally, we get consolidation and push above 13.25 to build confidence in further upside.
As long as price holds above 11.81 and builds higher lows, potential remains for an impulsive move up. Break below 11 and bias flips back to bearish continuation.
Trade Safe!
Trade Clarity!
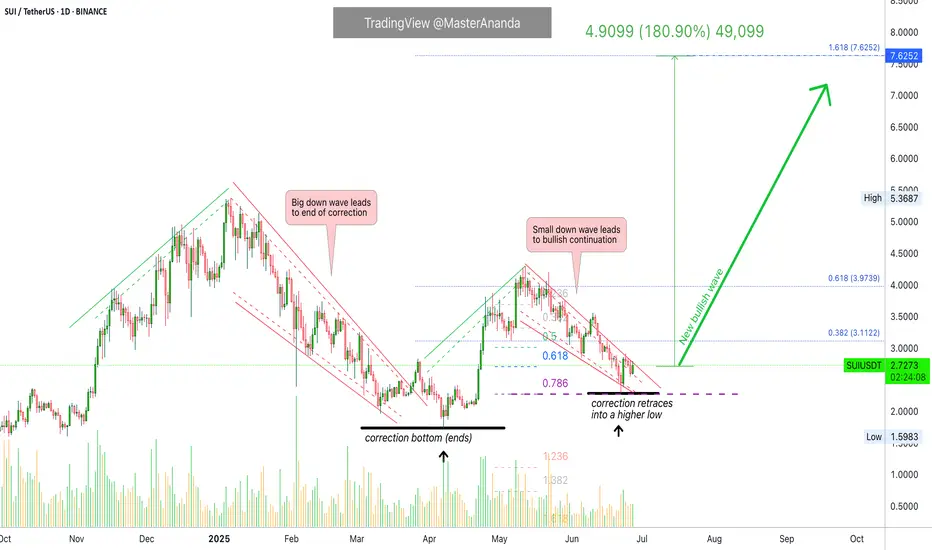
Sui: Bullish Potential w Leverage, Between 4-8X (PP: 720%-1440%)Sui looks great right now. This is a pair that I am approaching with leverage considering only a relatively small range, a 180% target. When multiplied by your number of leverage you can get an idea of the total profits potential. For example, 8X would be equal to 1440% while 4X gives 720%.
Technical analysis
How do we know the correction is over? We don't. We never do, but we always make an educated guess.
The higher low found support at 0.786 Fib. retracement relative to the initial breakout. Support is always found at one of these fib. levels with the 0.786 being the lowest on a bullish bias. When prices go as low as 0.786 a resumption of the bullish move is high probability. This can always be supported by additional signals of course.
Additional signals
Bitcoin is strongly bullish above $106,000 on a daily basis. The altcoins market tends to grow when Bitcoin consolidates at high prices.
The altcoins that moved first all remain bullish rather than producing a major crash. This means that the bullish cycle is on or else those that move strongly revert as soon as resistance is found. When a pair finds resistance and after a few days continues to challenge it, this is super bullish. This is what I am seeing on the pairs that I am tracking, and we are only concerned with the pairs we track because there are thousands of trading pairs and everything is always possible. Opportunities are endless.
Drawings vs numbers
The drawings and technical analysis are for learning and entertainment. The numbers, chart setup, entry and timing are the opportunity.
You can use one, you can use both. Whatever you do, is up to you.
Please keep in mind that there is always risk involved, especially when using leverage.
Do your own research and planning. Accept your mistakes, learn from these mistakes and success is guaranteed. When life hits you hard, stand up and try again. These are only lessons that will help us improve our game.
Challenges build resilience and character. Bring them all...
I am ready for battle, I am ready for profits, I am ready for success.
Thank you for reading.
Namaste.
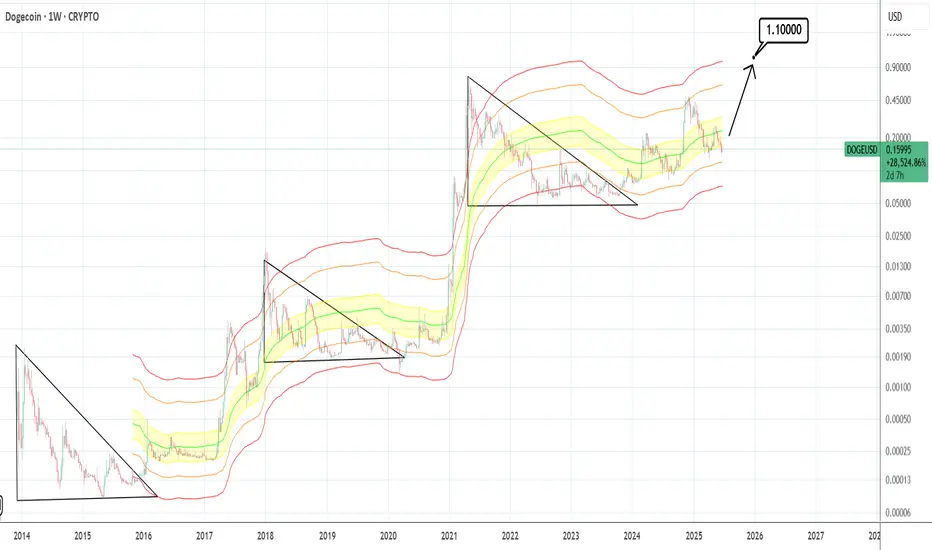
DOGEUSD: $1.100 is the minimum target.Dogecoin is bearish on its 1D technical outlook (RSI = 37.555, MACD = -0.00967, ADX = 29.193), suggesting that it is heavily undervalued in relation to the position it has during the same stage of the previous Cycles. All Cycles have smashed through the top red Mayer Multiple Band before pricing the Top. This means that by the end of the year, we can expect at least $1.100 for Doge (current projection of the Top Mayer Band).
## If you like our free content follow our profile to get more daily ideas. ##
## Comments and likes are greatly appreciated. ##
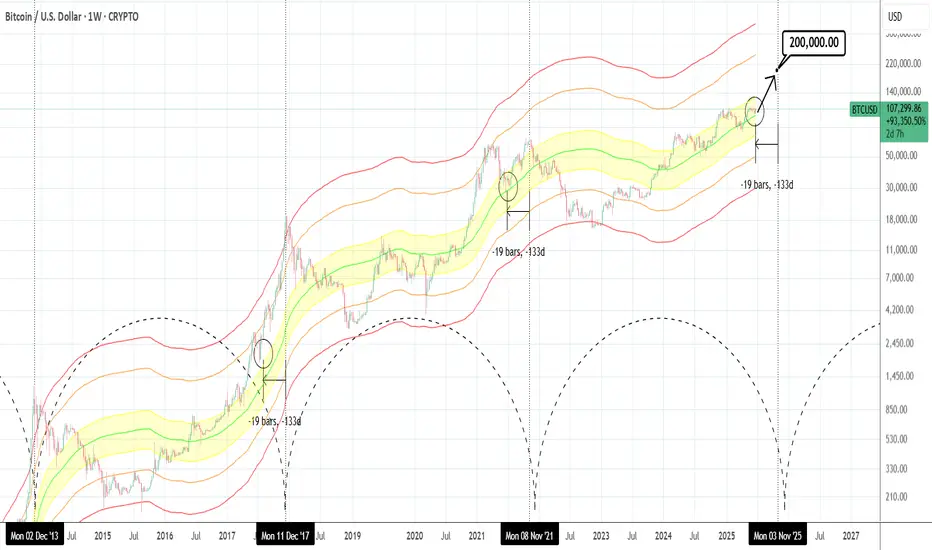
BTCUSD: Hasn't gone parabolic yet.Bitcoin is just now re-entering the bullish state on its 1D technical outlook (RSI = 55.820, MACD = 291.960, ADX = 15.180), being correcting/consolidating in the past 30 days. According to the Mayer Multiple Bands, it's stil inside the range (upper band) of the 1 Stdev Below-Mean-1 Stdev Above (yellow range). This suggest significant upside potential as being roughly 19 weeks before the Cycle tops, it matches the late June 2021 bottom inside that zone as well as the July 2017 bottom just over the top of that zone. The orange trendline has been the minimum target on every Cycle but looks unlikely to hit it by the end of the year. If however it goes parabolic as all Cycles had at this stage, $200,000 isn't at all far fetched before the Cycle tops.
## If you like our free content follow our profile to get more daily ideas. ##
## Comments and likes are greatly appreciated. ##
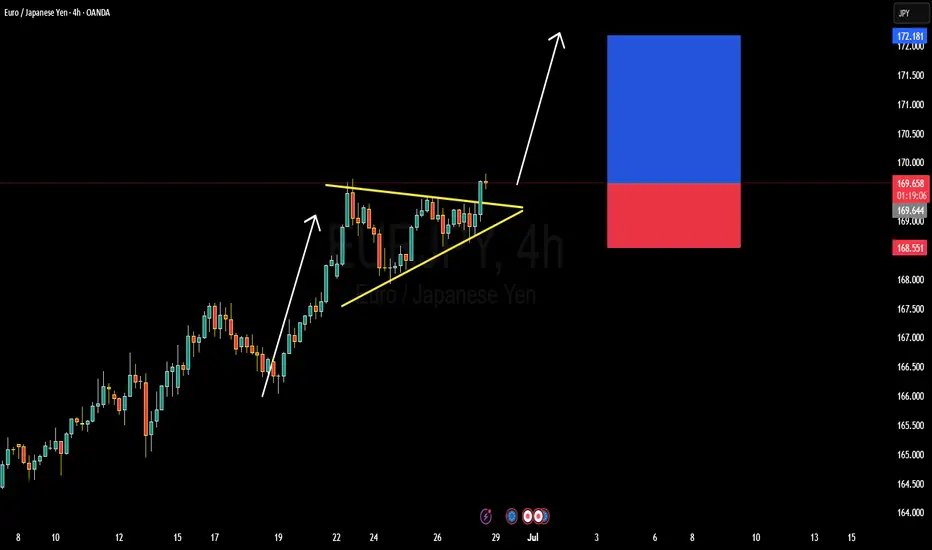
EURJPY BULLISH OR BEARISH DETAILED ANALYSISEURJPY has just broken out of a well-defined bullish pennant pattern on the 4H timeframe, confirming strong continuation potential to the upside. The price is currently hovering around 169.60 after consolidating in a tight structure, respecting both dynamic trendline support and horizontal resistance. This breakout signals renewed bullish momentum, and I'm now targeting the 172.10 zone as the next significant resistance level. The structure is clean, volume supported the breakout, and price action is aligned with the dominant uptrend.
Despite a relatively quiet start to the week—largely influenced by global risk-off sentiment surrounding Middle East tensions—EURJPY has held firm. Now that geopolitical jitters are easing slightly, yen weakness is resurfacing. The Bank of Japan remains firmly dovish, maintaining ultra-loose policy, while the Euro is supported by hawkish commentary from the ECB as inflation in the eurozone remains sticky. This divergence continues to fuel the long-term bullish bias for EURJPY.
Fundamentally, Japanese economic indicators remain soft, and there's still no clarity on when the BoJ will meaningfully shift policy. Meanwhile, EUR zone confidence indicators have stabilized, and speculation is growing around the ECB holding rates higher for longer into Q3. With widening yield differentials and a favorable risk sentiment return, this pair is positioned well for upside movement. Current momentum supports the probability of reaching the 172.00–172.10 area as risk appetite rebuilds across markets.
Technically and fundamentally aligned, EURJPY offers one of the strongest bullish continuation opportunities on the board right now. I will continue to monitor for minor dips as potential add-on areas, aiming for a full extension of the measured move from the pennant formation. Patience pays in setups like this where structure, sentiment, and macro all align.
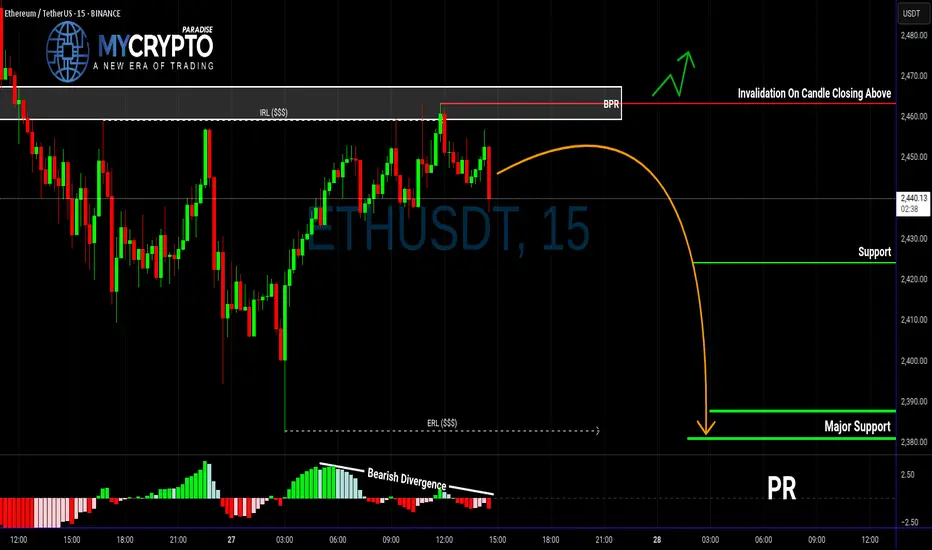
ETH in Trouble? This Breakdown Could Be Just the BeginningYello, Paradisers — are you spotting the same warning signs we did before the last major ETH correction? If not, now’s the time to pay close attention.
💎ETHUSDT is currently showing multiple bearish signals across both higher and lower timeframes. On the higher timeframe, we’ve confirmed a bearish Change of Character (CHoCH), which is often the first major clue that momentum is shifting from bullish to bearish. This shift suggests that ETH could be preparing for a deeper move down.
💎On the 15-minute timeframe, price has reacted directly from the BPR zone. What adds even more weight to this reaction is the clear bearish divergence we’re seeing on the MACD indicator. Together, these signs point to increased bearish pressure in the short term.
💎More importantly, ETH has already taken out Internal Range Liquidity (IRL), which often sets the stage for a move toward the External Range Liquidity (ERL). When IRL gets swept and momentum remains bearish, it’s typically a sign that the market is hunting for liquidity on the other side of the range—and that’s exactly where we believe ETH is headed next.
💎That said, to take this setup with high confidence, we’re waiting for a clean bearish candlestick pattern to form. Confirmation is key. A solid entry backed by strong price action improves the probability of success and allows for tighter, more efficient risk management.
💎However, if ETH breaks out and closes decisively above our invalidation zone, the entire bearish idea is off the table. In that scenario, patience will be our best tool—we’ll wait for price action to realign and only re-enter the market once a new high-probability setup presents itself.
🎖Strive for consistency, not quick profits. Treat the market as a businessman, not as a gambler. Patience and discipline are what separate the professionals from the herd. Stick to the process, trust the strategy, and you’ll stay ahead of 90% of the market.
MyCryptoParadise
iFeel the success🌴
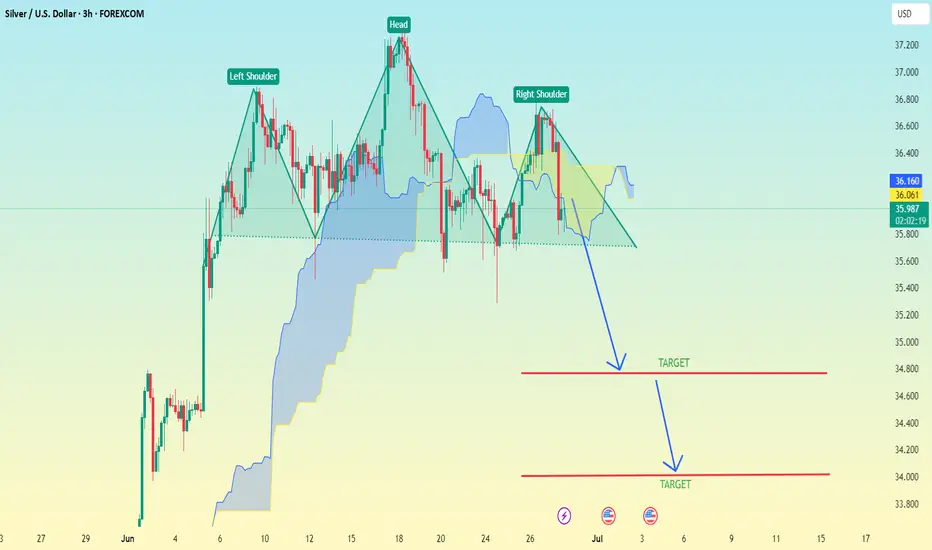
(XAG/USD – Silver vs USD–3h timeframe) Head and Shoulder Pattern(XAG/USD – Silver vs USD – 3h timeframe), a Head and Shoulders pattern is clearly marked, which is a bearish reversal signal.
Key Details:
Pattern: Head and Shoulders
Neckline: Approximately at the 35.90–36.00 level
Breakout Direction: Down
Measured Move Target Method: To estimate the target, subtract the height from the head to the neckline from the neckline level.
---
Target Estimation:
Head High: ~36.95
Neckline Level: ~35.90
→ Difference: 36.95 - 35.90 = 1.05
Target 1 (conservative): 35.90 - 1.05 = 34.85
Target 2 (aggressive): Based on the secondary arrow and extended support, it's pointing toward ~34.00–34.20
---
📉 Final Targets:
✅ First Target: 34.85
✅ Second Target: 34.00–34.20 (if bearish momentum continues)
Let me know if you want stop-loss or risk management levels included.