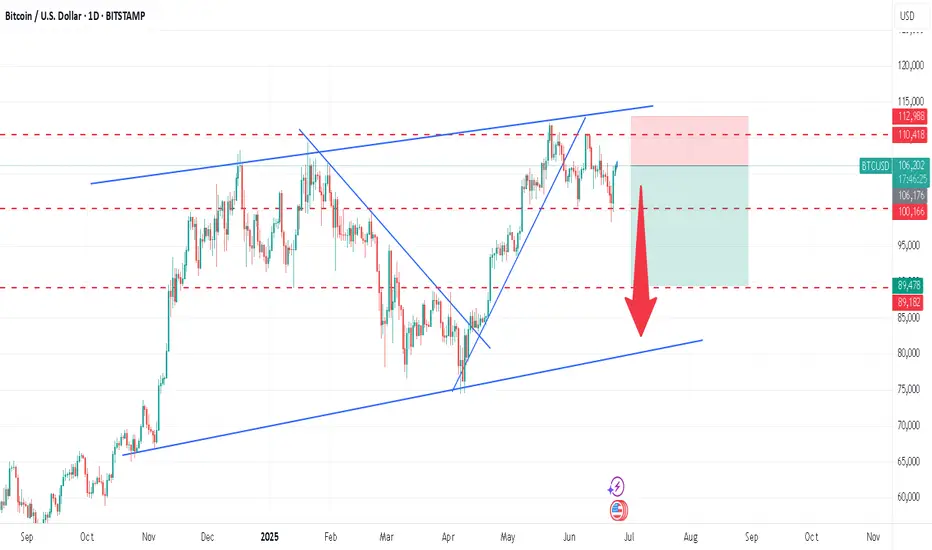
BTCUSD : HUGE FALL AHEAD ? Sell at 106200 or below
Stoplos : 113000
Target : 100000, 90000
BTCUSD struggling hard to make new highs. Retest of 90k level expected.
Crypto
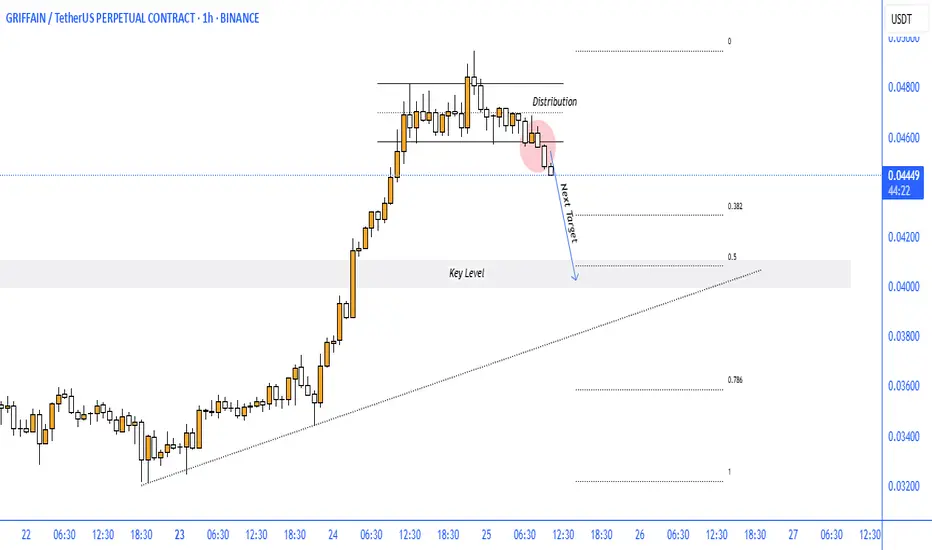
GRIFFAIN BEARISH SETUPGRIFFAIN/USDT (1H Chart) – Distribution Phase Signals Short-Term Bearish Reversal
The 1-hour chart of GRIFFAIN/USDT on Binance displays a distribution pattern at the recent high, suggesting bullish exhaustion and an imminent correction. Price has now broken below the consolidation range, confirming a shift in intraday sentiment.
🔍 Key Technical Insights:
Distribution Zone Formed: Price stalled at the top with several failed attempts to push higher, forming a range – a classic sign of distribution before reversal.
Bearish Breakdown: The bearish candle has breached support, initiating a potential downward move toward the 0.5 Fibonacci retracement level.
Key Level to Watch:
Next Target: $0.0400 (50% Fib level + historical demand zone)
Further Support: $0.0360 (Fib 0.786 region)
📉 Outlook & Expectations:
Short-term bias remains bearish below the $0.0458 zone. As long as price stays below the distribution range, expect continuation toward the $0.0400 support area, aligning with key structural and Fibonacci levels.
This setup is ideal for intraday or short-term swing traders watching for pullback entries or breakdown continuation.
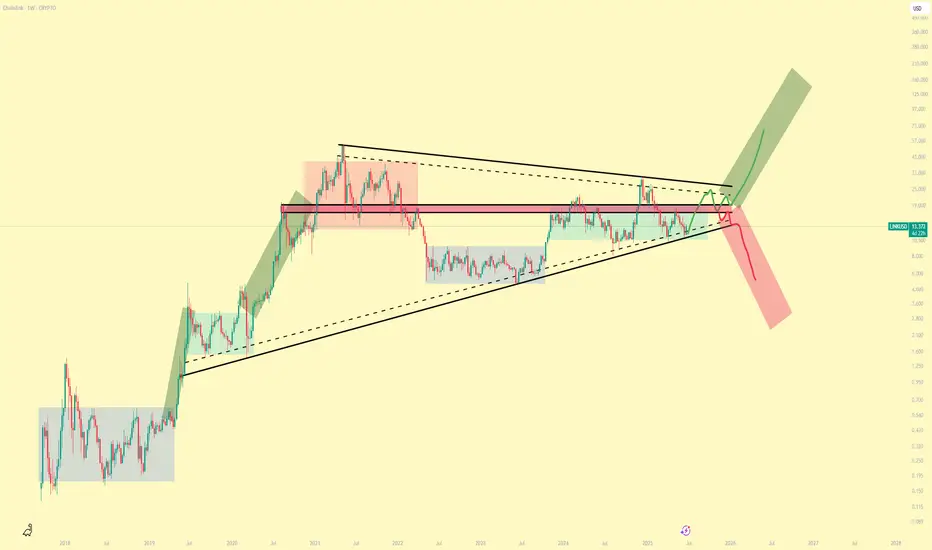
LINKUSD Paths on OfferPretty clear accumulation stages going on and so I am inclined to think we head towards the Bullish path to ~$100
Bears will want to buy LINK at massive discounts and so perhaps we do see some capitulation before our next mark-up phase.
However, the current Total Market cycle patterns, along with the BTC pairing, almost rule out the possibility of further downside, or at least major downside.
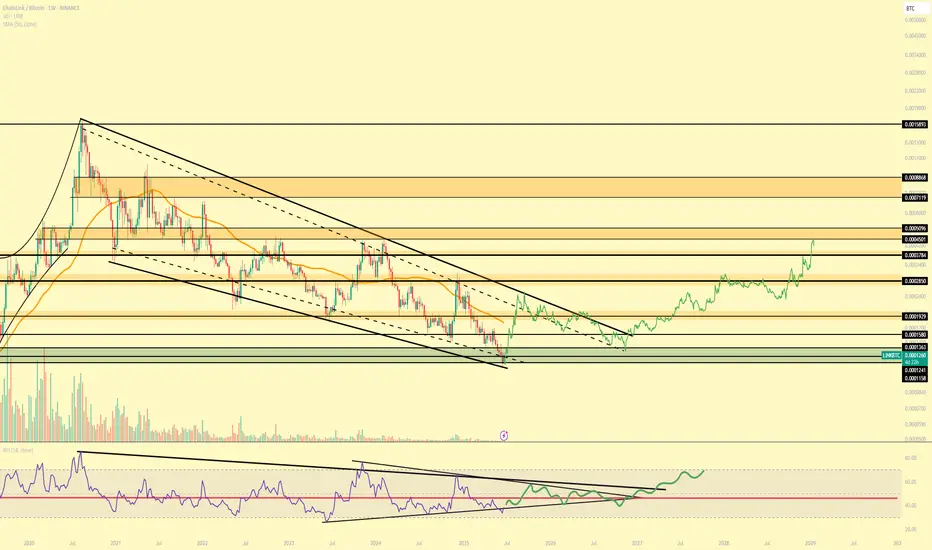
LINK / BTC Looking Juicer Than EverEven if you aren't aware of the fundamentals of LINK adoption & application , the chart speaks for itself.
Would be very surprised is LINK isn't bottoming out here and all it needs is a bit of sideways before we get some expansion and mark-up.
Harvest Finance 1,490% Profits Potential & The 2025 Bull MarketThis is a yield aggregator, DeFi. And if there is something people love about the Cryptocurrency market is decentralized finance.
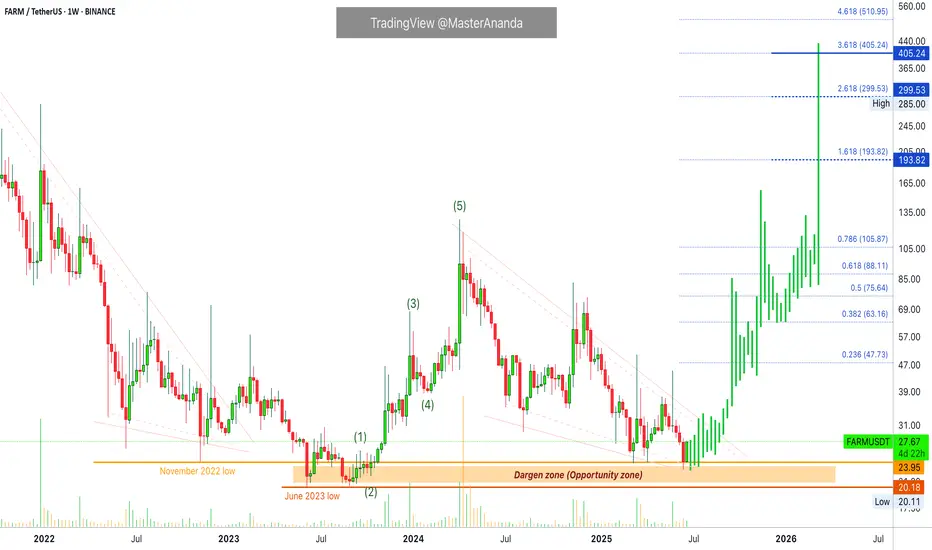
Harvest Finance —FARMUSDT
The danger zone is also the opportunity zone. An opportunity that is not available anymore. This is a price range between the November 2022 and June 2023 lows.
FARM found support in April and May 2025 at the exact same level from November 2022, on a wick. In June, last week, it wicked below this level (orange line on the chart) just to quickly recover. This week FARMUSDT is full green.
While the opportunity zone is likely gone forever, there is still some time to buy while prices are low. This pair has great potential for growth and I can see the development of a new bullish impulse in the coming days.
Entry level
Anything below $30 should be consider a strong buy opportunity when considering the long-term.
Growth potential
Growth potential is truly unlimited and it is hard to make accurate predictions here because this pair started trading in August 2021. It was near the end of the previous bull market. So we don't know if the top is a valid number or it simply crashed because the bull market force had already run its course.
Some conservative targets yet strong can be seen on the chart.
$299 and $430 are looking good, I would say high probability.
The $193 target I would say is the minimum within the next 3-6 months. This one would produce a total of 615% profits potential. So this is a good pair.
The $430 target, just to give you an idea, gives more than 1,490%.
Some pairs show maximum growth potential reaching 500-600%. Some other pairs can go as high as 8,000-9,000%. It really depends on the size of the project, the popularity, past action and how many exchanges carry it for trading. I do all my projections based on the chart and past action.
One thing to keep in mind is that the market tends to surprise, very important. The bull market is very likely to end up breaking all the targets that we extracted so far. It is a common situation, it always tend to go much higher and for much longer than anything we can imagine; great.
Thank you for reading.
Namaste.
Stacks Short- Mid- & Long-Term Bullish Signals (PP: 900%+)Stacks is a very interesting project and I believe it has many fans. Here the signals are really good and by good I mean strong.
This pair, STXUSDT, has been a top performer but the action bearish since March 2024.
Between March 2024 and April 2025 we have a classic ABC correction, a long-term one. Needless to say, this type of correction is always followed by an impulse, a bullish impulse and this is a sequence of 1,2,3,4,5 waves. Three waves up and two waves down in-between.
The August 2023 low produces a rounded bottom and then a new wave of growth. This low is preceded by another bullish wave. This pair has been growing long-term.
Then a new rounded bottom shows up but this one a long-term higher low compared to August 2023. That is April and June 2025. So mixed bullish signal. Short-term, mid-term and long-term all being combined to give us a bullish mix. Ultra-bullish in short.
The last all-time high happened around $3.84, so the next one can happen around $7.11 or $9.65. The $7.11 projection gives more than 900% profits potential.
Oh, and this week is young and already full green. The candle's real body trades above the two previous weeks open and close.
Thank you for reading.
Your support is appreciated.
Namaste.

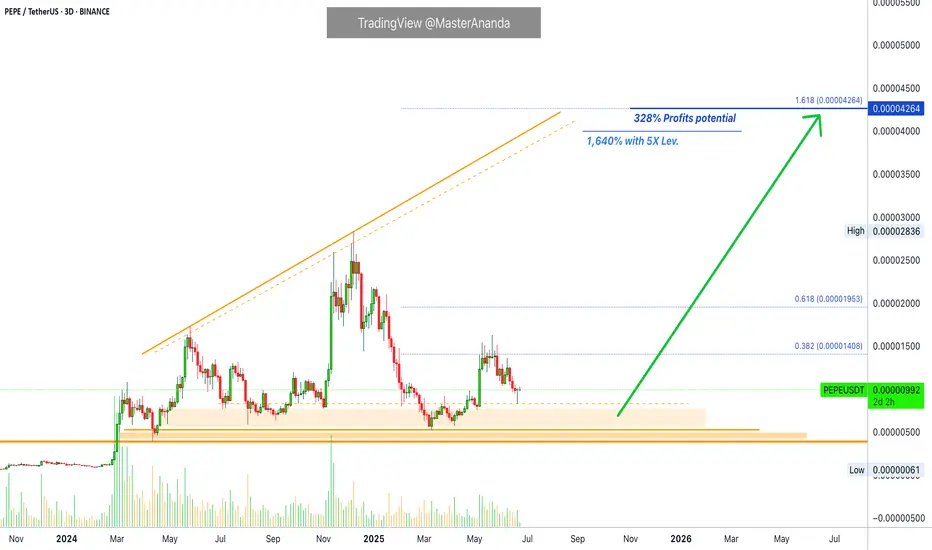
Pepe Prepares To Grow After 5 Weeks Red (5X Possible)I am sorry, the system is not working and won't let me write more than a few lines. This is the best I managed to publish without getting an error.
You can get the idea by looking at the chart and drawings. It points to higher prices in the coming weeks and months. Namaste.
Circle Collapse - Will COIN follow? Circle stock has been on a wild ride lately
After a meteoric rise of over 700% since its IPO on June 5, it's now facing some turbulence:
- Today, the stock dropped nearly 16%, partly due to Cathie Wood’s ARK Invest selling $110 million worth of shares.
- Analysts are also sounding caution. Compass Point initiated coverage with a $205 price target—below its current trading price—citing rising competition in the stable coin space.
- Despite the dip, some still see long-term potential. A recent Forbes analysis explored whether Circle could hit $500 per share, driven by growth in USDC reserves and infrastructure revenue.

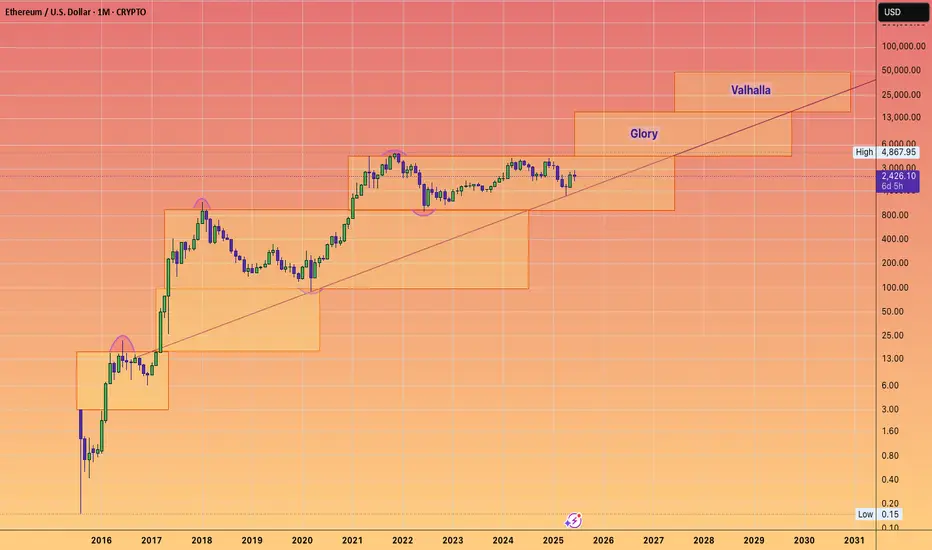
Do you want to have glory? Do want to see Valhalla?#HODL
These next few years will could change your life.
#ETHEREUM is cheap right now.
#ETH still can do tens of X's
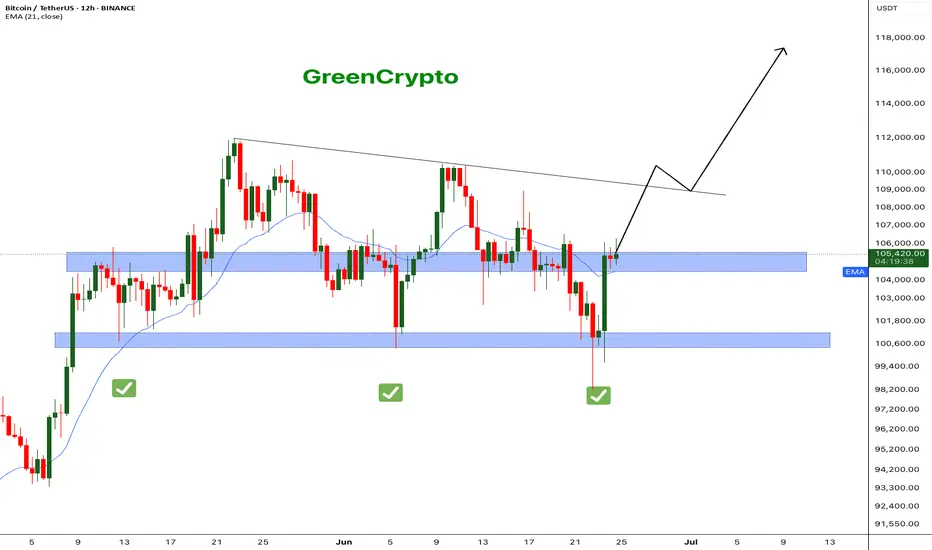
Bitcoin - What's next ? BINANCE:BTCUSDT (12H CHART) Technical Analysis Update
Now that ceasefire is announced, bitcoin price has successfully recovered to the resistance level and currently trading at the resistance zone. It's critical that bitcoin breaks this resistance for it to hit the next resistance around 110K .
I'm expecting price to reach 110k this week and we can see some consolidation in that range before moving further up.
Follow our TradingView account for more technical analysis updates. | Like, share, and comment your thoughts.
Cheers
GreenCrypto
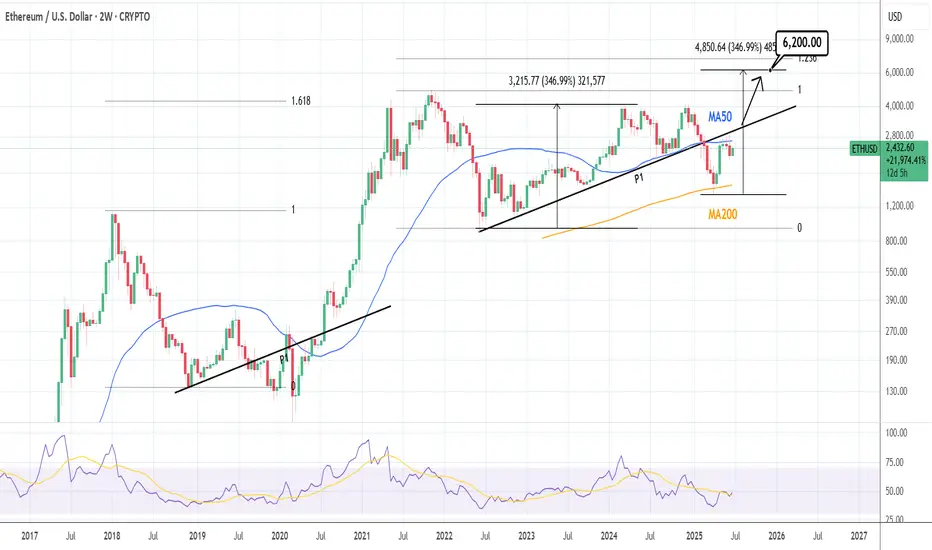
ETHUSD: Waiting for one last breakout.Ethereum remains neutral on its 1D technical outlook (RSI = 48.083, MACD = -39.26, ADX = 21.833), failing so far to close over its 2W MA50, where it's been rejected in the past 3 candles. The last Resistance before the price starts the parabolic rally is the P1 trendline. The price has been trading over it for the majority of this Cycle and only broke under it during the recent Tariff War. A breakout there, extends the Cycle to possibly at least a +346.99% rally from the bottom (TP = 6,200).
## If you like our free content follow our profile to get more daily ideas. ##
## Comments and likes are greatly appreciated. ##
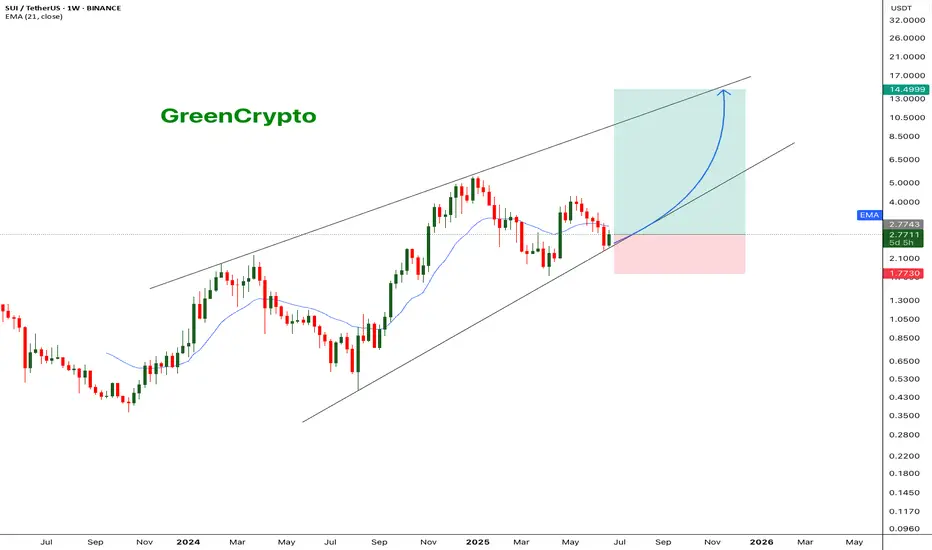
SUI - Only way is up.BINANCE:SUIUSDT (1W CHART) Technical Analysis Update
SUI is currently trading at $2.77and showing overall bullish sentiment
Price has touches the trending support and managed to bounce back from the support, this is a good sign. I see a good opportunity for long trade here with a decent stoploss.
Entry level: $ 2.77
Stop Loss Level: $ 1.77
TakeProfit 1: $ 3.6997
TakeProfit 2: $ 4.2126
TakeProfit 3: $ 5.7785
TakeProfit 4: $ 9.5494
TakeProfit 5: $ 14.1762
Max Leverage: 5x
Position Size: 1% of capital
Remember to set your stop loss.
Follow our TradingView account for more technical analysis updates. | Like, share, and comment your thoughts.
Cheers
GreenCrypto
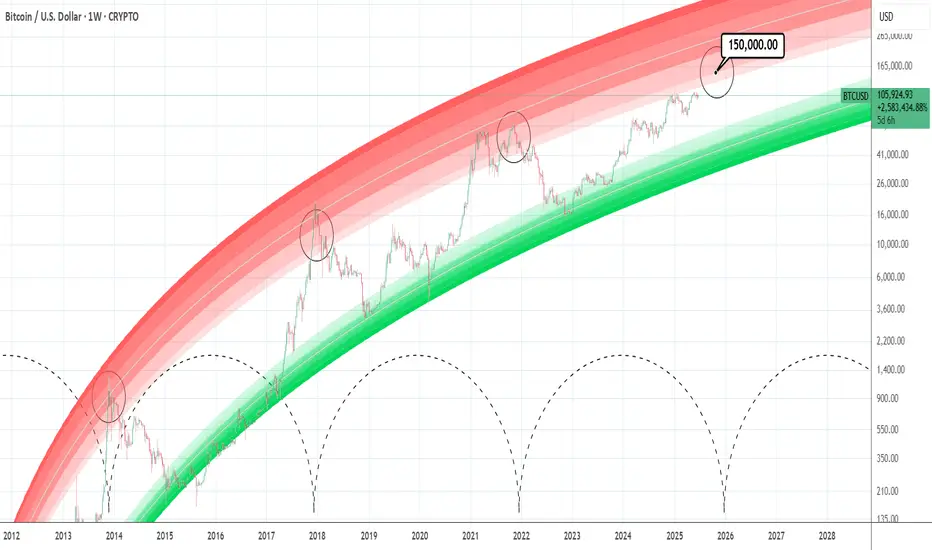
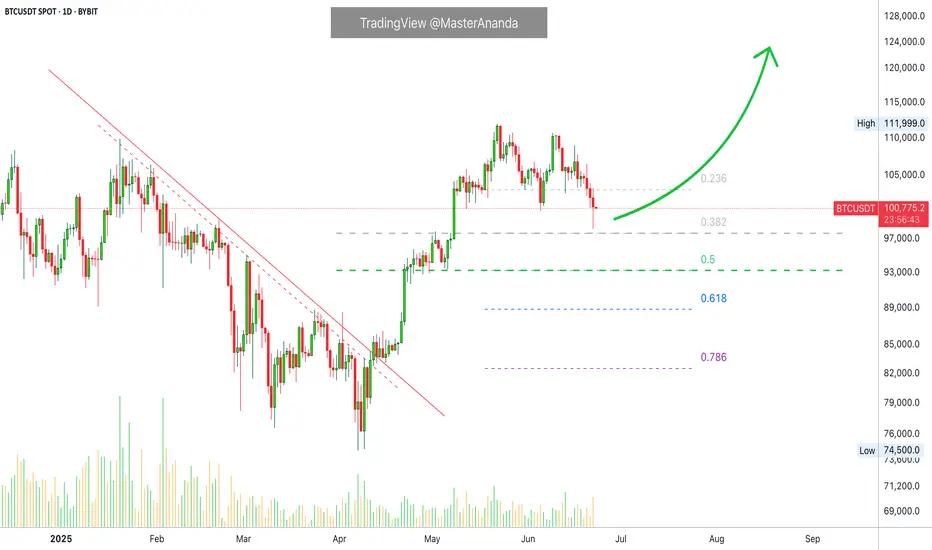
BTCUSD: Minimum target for this Cycle is 150,000Bitcoin turned neutral again on its 1D technical outlook (RSI = 52.882, MACD = -410.600, ADX = 22.509) as it recovered the losses of the last 2 days thanks to the Truce announcement between Israel and Iran. The long term picture couldn't be more bullish however as it hasn't even hit the bottom red zone of the Logarithmic Growth Curves model. According to the Time Cycles that mark each Cycle High, the Top for this Cycle is estimated to be between October and December. By October 2025, the top of the first profit taking zone (lightest pink) would be $150,000. That is technically the bare minimum of Top that should be expected based on the current LGC model. Technically it can even hit $200,000 but fundamentals have to help a lot in this scenario (adoption, ETFs, rate cuts).
## If you like our free content follow our profile to get more daily ideas. ##
## Comments and likes are greatly appreciated. ##
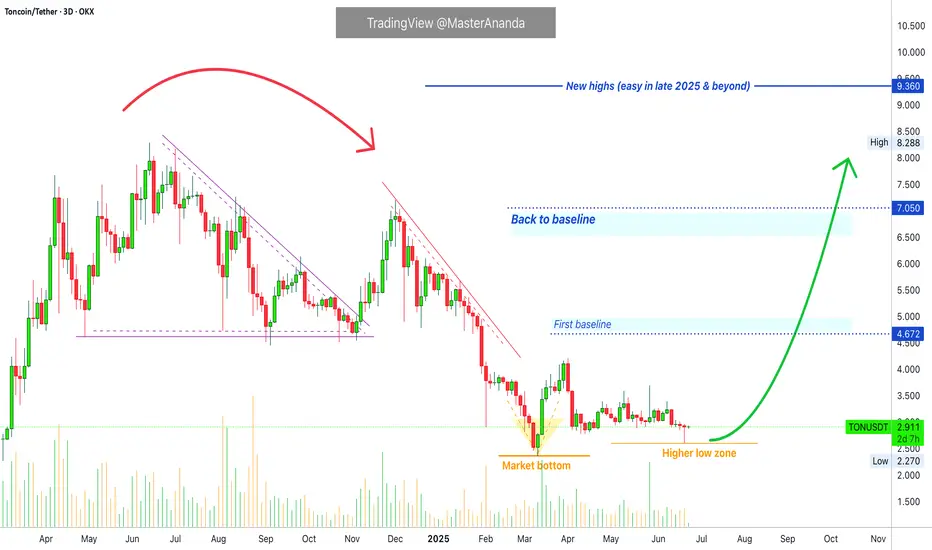
Toncoin Final Call: Last Chance For Bottom Prices (3-5X Lev Pos)The last 3D session that closed produced a major reversal signal and this is the last chance truly, the last opportunity; the final call. It is the final call to get Toncoin at low prices before a major bull market. It will be a massive bullish wave and this wave will reach new all-time highs and beyond during the price discovery phase.
This chart setup can be traded with leverage. Traders can use 3-5X leverage with very low risk. Spot traders can buy and hold and this will be one of the biggest projects in this cycle.
The pairs that moved weakly in the first bounce, 7-April, will do much better in this second jump. These pairs will also move fast and stronger compared to the ones that already moved strong between April and May.
There are many pairs and many projects. In each wave, a different set of pairs moves strong and becomes top performers. The ones that didn't move last time can move this time. Those that did move can move again but they tend to lag behind. The energy moves around the entire market and never gets stuck in one place.
Adapt and change. The market is always changing... Choose wisely.
This is a huge opportunity. It is time to trade.
Buy the bottom and hold; you will be happy with the results.
Namaste.
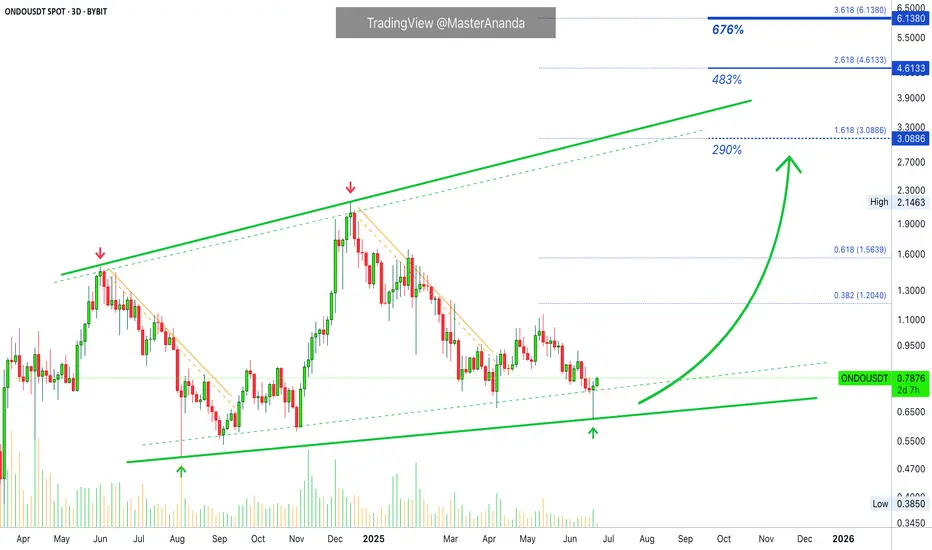
Ondo Finance: 290%, 483% & 676% Summer & FallBullish momentum right now is building up so fast that I can hardly share a chart before prices are up 5 to 10%. If you try to buy, prices can runaway from you specially when using leverage. That's what I mean when I say that the bottom, bottom prices, will only last a few days at max. The time is now.
Here we have Ondo Finance with a great pattern, the ascending channel. This chart structure clearly reveals a very strong, long-term bullish bias. And the logical conclusion is always obvious based on price action.
Each time there is a drop, the lowest point is a higher low.
Each time there is an advance, the market ends up producing a higher high...
I know, people are allergic to bottom prices so right now everybody is away but, there is good news; soon the market will be trading really high up and once prices are high, everybody is ready to trade.
Huge potential for growth on this chart. These target can be hit within 1-3 months, 3-6 months with the potential open for higher than what is shown.
Namaste.
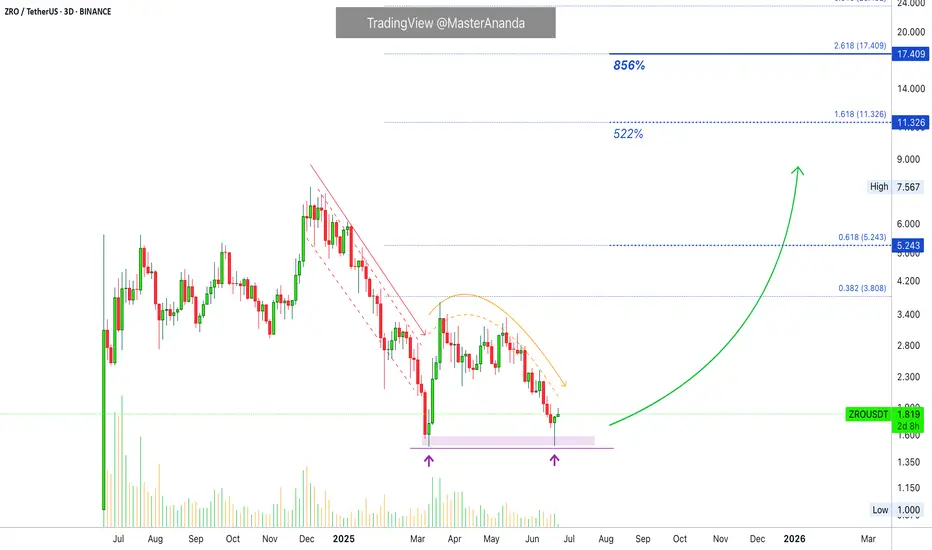
LayerZero, Exposing The Bottom, NEW Uptrend in The MakingNotice how a very steep decline suddenly becomes flat. The bottom that is. As ZROUSDT was crashing down from December 2024 we have lower lows. Then something changes; market dynamics, price action, the trend, instead of lower lows the bottom goes flat and yesterday we have a double-bottom. This means that bears are no longer in charge. Buyers were present at support.
Truly, that's all we need to know.
No complexities, no hundreds of indicators, no "fundamentals," nothing, none.
Just this small amount of information tells us that the downtrend is over, with the downtrend being over we know a reversal can happen any day. We are expecting this reversal to start to shape itself now. A new uptrend will show up in the coming weeks. Bullish action will start within days.
LayerZero is going up.
Thank you for reading.
Namaste.
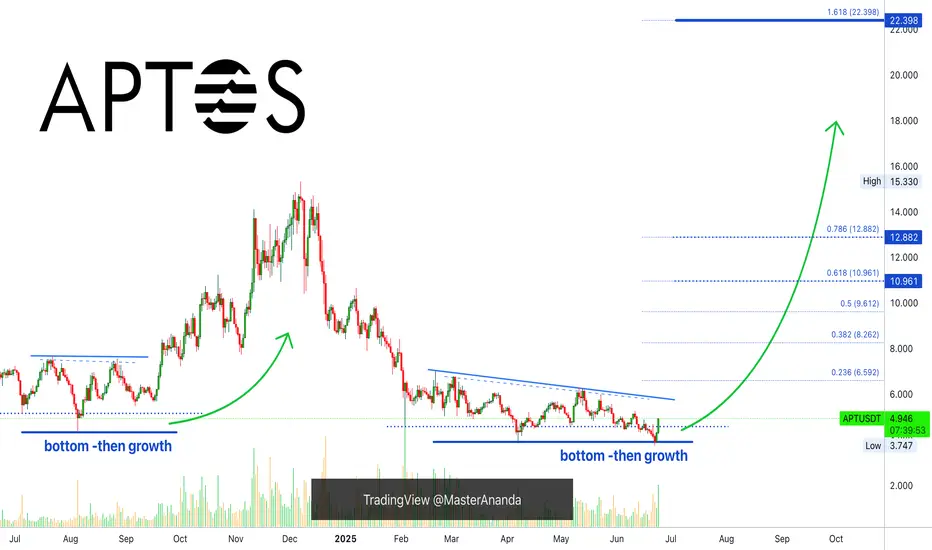
Aptos Bullish, Altcoins BullishThe best is yet to come. Do not despair my dear friend, patience is key.
Aptos is breaking bullish right now after a final low with the highest volume since February. This confirms the latest double-bottom as the market bottom.
The high bullish momentum developing on today's candle, full green, coupled with the fact that a major flush is present on the chart reveals really good news. Today, things might seen down and quiet; everything can change in a day.
The bullish wave is on, it is starting now and it will be strong. Bottom prices will be gone within hours but we will experience long-term growth. Keep in mind that 100%-200% can happen within a matter of days. This is because the market is set to grow in excess of 1,000-2,000%, so the first jump is very strong but only signals the start. Getting bottom prices can be life changing.
This is a friendly reminder; the best is yet to come.
Aptos bullish means the altcoins are bullish.
The altcoins going bullish means that Bitcoin will soon resume with new all-time highs and additional growth.
Trust crypto, trust the market, trust your plan. You will be rewarded long-term.
The time to buy is now. Profits are on their way. To you!
Namaste.
Bitcoin Recovers...What we've learned in the past few years is that Bitcoin's demand is just too strong. Retraces and corrections are no longer wild like before, these are limited and capped. Nobody wants to take the risk of selling too much and being left out or losing their Bitcoins for good, they are just too valuable. Many times more valuable than the USD Dollar or Gold. It is the most valuable asset in the whole digital world.
Other than food and toilet paper, nothing is more valuable than Bitcoin.
Technical analysis
Ok, let's focus on the chart.
The retrace has been ongoing for 31 days, since 22-May.
Total drop amounts to 12.33% (-12%).
The action moved below the 5-June low around $100,400. Bitcoin is now back above this level. Clearly showing that this is a stop-loss hunt event.
Stop-loss hunt and liquidity hunt because thousands, if not millions, of over-leveraged traders have been liquidated. They were betting on the wrong side short-term. Long-term yes, bullish is the trend, the direction and the win. Short-term, it was SHORT but not anymore.
Never trade with 20X that's crazy. Imagine going LONG 20X at the all-time high? Isn't that stupid?
I can bet you the same people didn't want to buy LONG when Bitcoin was trading at $75,000. In fact, I can bet that these people that just got liquidated were selling below $80,000 and buying LONG with 20X at $110,000. A recipe for disaster.
Anyway, I am calling it early. This is it, we are going up.
I got my signals, as you already know, from the altcoins.
If you agree boost and follow.
Thanks a lot for your continued support.
Namaste.
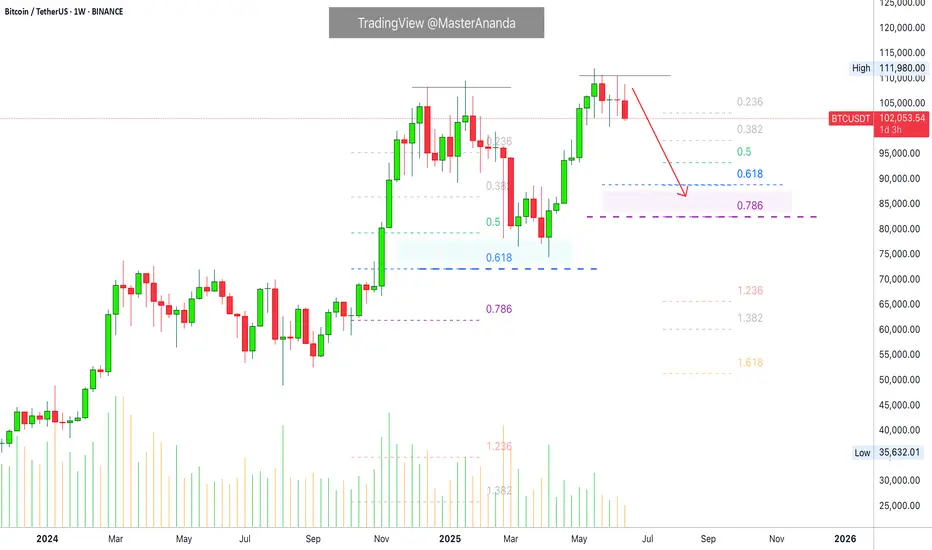
Bitcoin Weekly Ultra-BearishThe 100K support is still valid but the weekly timeframe chart isn't looking good.
Good afternoon my fellow Cryptocurrency trader, how are you feeling today?
Bitcoin peaked the week 19-May. Then we have bearish action only.
The week after 19-May was red, then two neutral weeks and a continuation this week. It looks pretty bad right now, terrible to be honest.
» The main support range sits between $82,500 and $88,888.
Thank you for reading.
This support zone will only become active is 100K breaks on the weekly timeframe.
Namaste.
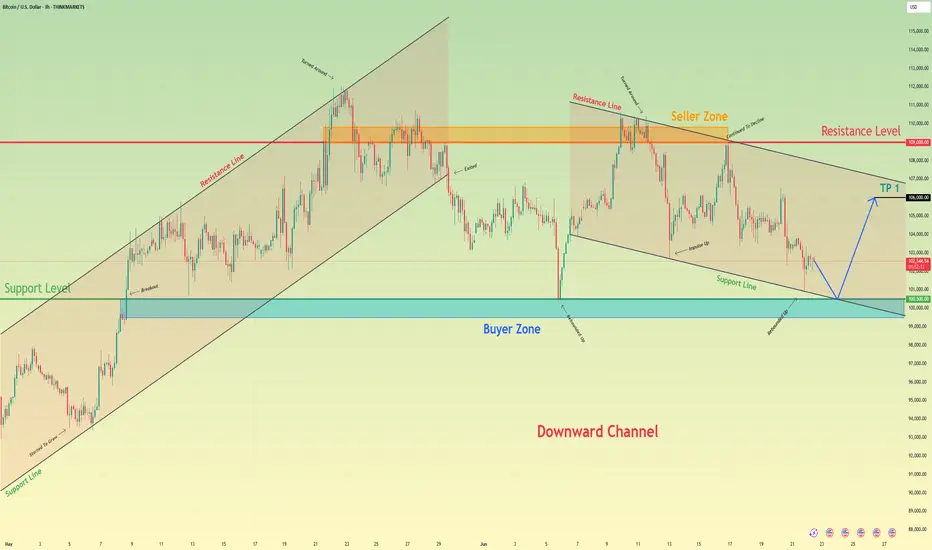
Bitcoin can correct to support line of channel and start to growHello traders, I want share with you my opinion about Bitcoin. The price was moving inside a strong upward channel, where it managed to break through the support level and then the resistance level, eventually reaching the seller zone. After that, BTC started to turn around and declined, once again breaking through the 109000 resistance level, this time from above. That movement also marked an exit from the upward channel. Following that, the price made a correction move down to the support level — the same zone that previously acted as a breakout area. From there, BTC showed strength again with a bullish impulse upward, returning to the Seller Zone. However, that rally was short-lived. The market started to decline again, this time forming a downward channel. Now the price is approaching the support line of this channel, which coincides with the support level around 100500 and the buyer zone between 99500 and 100500. I think BTC can decline a bit further to test this support line, and then rebound from this area, starting a new upward move toward the channel resistance line. That’s why I’ve set my TP at 106000 points, just below the resistance line. Given the structure and past reactions from these zones, I remain bullish and expect further growth after this local pullback. Please share this idea with your friends and click Boost 🚀
Disclaimer: As part of ThinkMarkets’ Influencer Program, I am sponsored to share and publish their charts in my analysis.
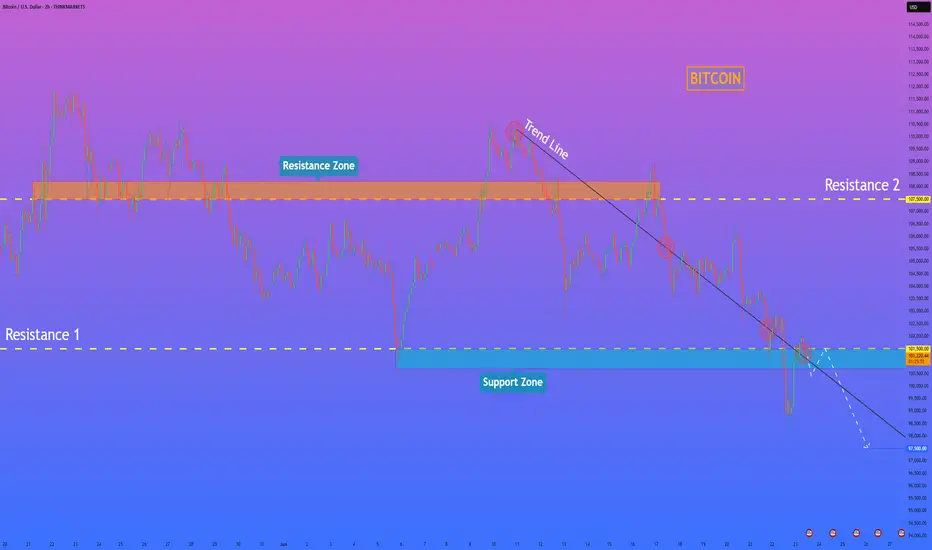
HelenP. I Bitcoin may break trend line and continue to move downHi folks today I'm prepared for you Bitcoin analytics. After testing the resistance area between 107500 and 108200 points, the price started to form a clear descending pattern, respecting the downward trend line with multiple touches. The price consistently failed to break above it, confirming bearish pressure. Eventually, it dropped below the 101500 support level and entered the support zone down to 100700 points, where it found temporary relief. From there, BTC attempted a short-term rebound and moved back toward the 101500 resistance area. However, it now trades just under the trend line again, signaling that the sellers are still in control. The structure suggests a potential pullback toward the trend line or the lower boundary of the resistance zone before further downside continuation. In my opinion, BTCUSD is preparing for another move lower. That’s why I expect a slight upward correction, followed by a new bearish impulse that could push the price toward the 97500 level, my current goal. Given the ongoing pressure from the trend line and the failed breakout attempts, I remain bearish and expect further decline. If you like my analytics you may support me with your like/comment ❤️
Disclaimer: As part of ThinkMarkets’ Influencer Program, I am sponsored to share and publish their charts in my analysis.
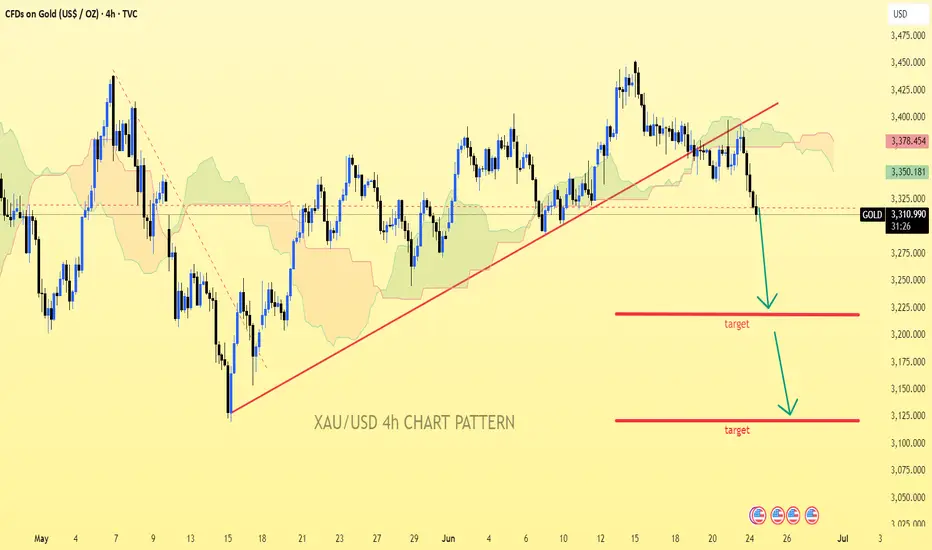
XAU/USD 4h chart patternXAU/USD (Gold) 4H Chart, the price has clearly broken below the ascending trendline, indicating a bearish structure.
Visual Targets from My Chart:
1. First Target Zone: Around 3,210 - 3,215 USD
2. Second Target Zone: Around 3,130 - 3,135 USD
Price Action Breakdown:
Current Price: Around 3,310 - 3,335 USD
Trendline break confirmed with strong bearish candles
Momentum suggests price is heading towards the first support zone around 3,210
If bearish momentum continues, price may reach the second target around 3,130
Summary:
✅ First Target: 3,210 - 3,215 USD
✅ Second Target: 3,130 - 3,135 USD
If you want precise Fibonacci or support/resistance levels calculated, I can assist further—just let me know!
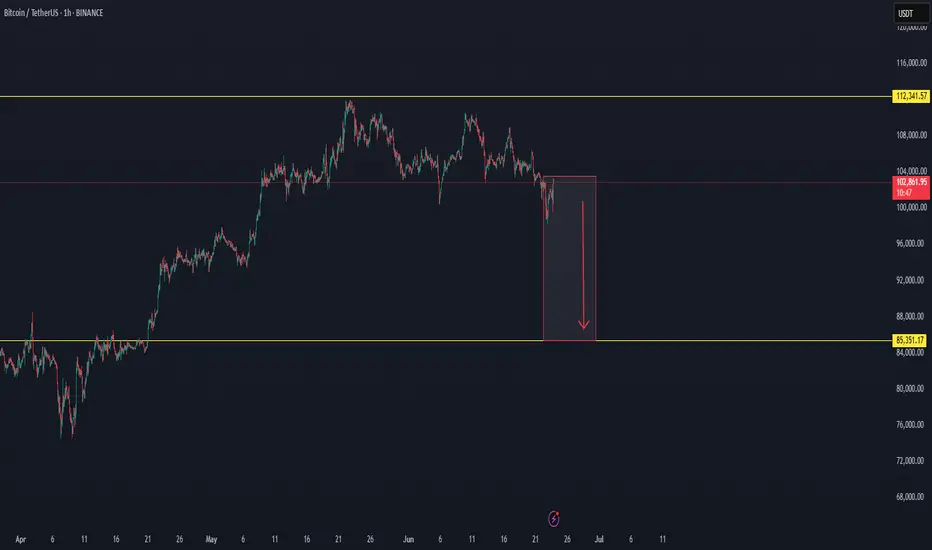
Market SIGNALS SHOW THAT BTC CAN FALL TO 85K USDMarket follow-up study shows that there is a good chance BTC can fall to 85K in the coming time period. The market cycle seems to end the green trend and to enter a new red zone.
Time will show what really can happen with BTC.
The market can make a fake trend, with a trend fall on a high time frame.
The crash can also happen on the main markets.
This is not trading advice, trade always only depending on your plan.