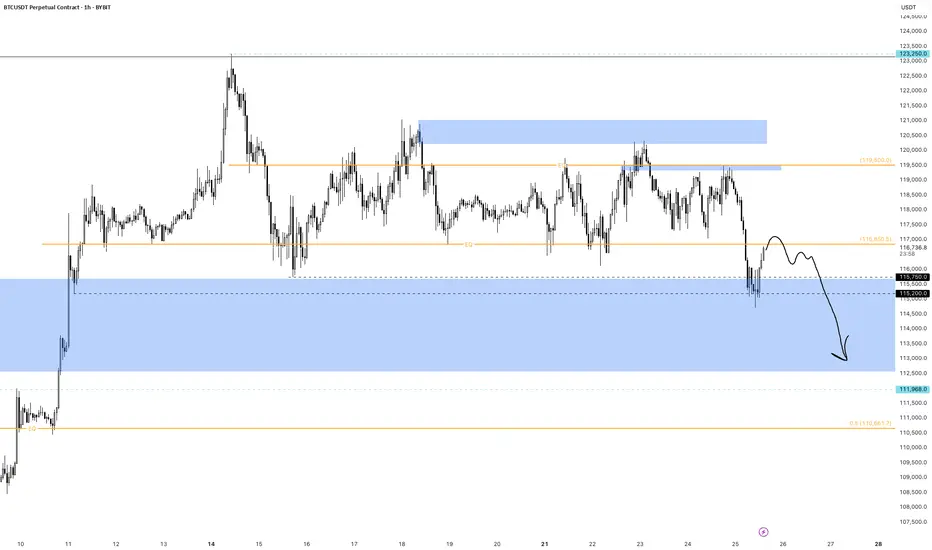
BTC - Trap, Tap, and Blast Off!BTC has been overall bullish, trading within the rising blue channel (1). After reaching a local high, it entered a short-term correction, forming a falling red channel (2).
👀All eyes are now on the key demand zone (3), which aligns with the lower bound of both the red channel and the rising blue structure.
🔎As long as this confluence holds, we anticipate a potential bullish impulse in August.
A retest of the $111,500–$112,000 zone could serve as the trigger for the next leg toward $128,000. Let’s see if BTC is gearing up for another breakout or if a deeper correction is in play.
🔔 Disclaimer: This analysis is for educational and informational purposes only. It does not constitute financial advice or a recommendation to buy or sell any asset. Always do your own research and manage your risk accordingly.
📚 Always follow your trading plan => including entry, risk management, and trade execution.
Good luck!
All strategies are good, if managed properly.
~ Richard Nasr
Crypto

BTC setup looks good for 5R.Looks like BTC is about to make another leg up toward 135K. Playing a 5:1 R:R on this setup
Entry: 119,000
Stop Loss: 116,000
Target: 135,000

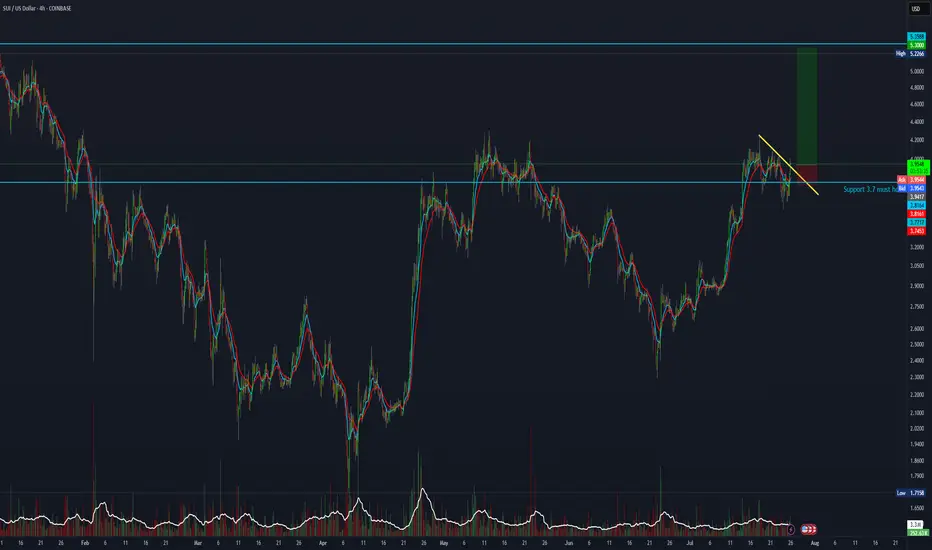
Sui Works To Break Resistance · Play To Win · No StressA flat bottom is bullish because support can be confirmed as found when sellers (bears) fail to move prices past a certain point. A flat bottom produces the double-bottom and triple-bottom reversal signals. When the bottom is flat, depending on the phase the market is going through, we can easily say bullish. A flat top is not bearish, it is a completely different story.
A flat top does not confirm resistance being found and thus a new bearish wave. We need context, it all depends on the phase of the market cycle. A flat top with a rising bottom is bullish. Resistance has been found and is being challenged. It is getting weaker because the action is converging towards the resistance point based on the rising bottom.
Here we have a flat top with a rising bottom (higher lows). The market is bullish. SUIUSDT has been bullish and growing since late 2024. This is the content we need. A bullish tendency, a rising market and resistance being challenged more than once starts to reveal a picture. Next this resistance won't have enough strength to hold. Next time SUI moves up it will continue rising to produce a new all-time high and this will unleash a price discovery phase.
SUIUSDT is trading above EMA55 and EMA89. The last challenge of resistance produced a rejection but this rejection did not lead to a test of the above mentioned support. Another signal of strength.
Sellers cannot push prices lower because buyers are active, or simply put, there are not enough sellers to start and thus the retraces become smaller and shorter. Price dynamics favoring the bulls.
The lows are getting higher, the top remains the same. When the low meets the top that is when resistance breaks. Sui is going up, it will continue to grow; the targets on the chart can be hit short-term.
There is no sense of urgency, but a major advance can be happening within days.
Are you ready to trade and hold? Prices going up aiming high trading requires no effort.
The effort is mental, the mind can be trained to succeed and avoid stress. Mental stress = lack of knowledge. If you know prices are going up and you feel certain about it, no effort is required to win because the mind doesn't have to struggle with questions relating to the strength of your position. The mind does not need to answer, should I buy or should I hold? Since you know prices are going up based on the chart, you can sit back and relax watching your profits grow. Reading relaxes the mind. Knowledge is food for the soul. The more you learn, the more you know the wiser you become. Wise means effortless. Trading can be effortless if you read the right stuff. Play to win. Plan before trading and you already won.
Answer the question before the situation shows up. That's it, you've just removed the complexity out of the game. When there is no complexity, there is no mental stress. Since you are sitting on a chair in front of a device, trading becomes effortless. To trade with peace in your mind you just need the right knowledge and that is what you are getting here. No stress.
Continue reading and watch your profits grow. Increase your peace, free up your time and enjoy better results.
Namaste.

6:1 R:R trade setup for SUIAnother attempt at a 6:1 R:R setup with a target at the all-time high of 5.3.
Entry: 3.9417
Stop Loss: 3.745
Target: 5.3
REI/USDT CYCLE UPDATE $0,90 by 2025 - Price prediction📈 REI/USDT CYCLE UPDATE – $0.90 by 2025
REI could break above its old ATH, targeting $0.90 in the upcoming cycle. Why?
Upcoming
✅ Ultra-fast blockchain (⏱️ 1.5s block time)
✅ Gas-free or near-zero fees – perfect for DeFi, NFTs & gaming
✅ EVM-compatible – easy migration for Ethereum dApps
✅ Low market cap → high upside potential
✅ Clean tokenomics with staking + resource model
✅ Built for speed, scale & adoption
DATA
Data shows that there is a structural trend going on, where this coin can break soon.
If the altcoin market heats up, REI has the fundamentals & tech edge to explode past previous highs. 🚀
🧠 Watch this one closely.
#REINetwork #Crypto #Altseason #EVM #PricePrediction #Web3
This is not trading advice, but a view from a side of study.

The End of the Altcoins Bull Market? BTC.D Turns Bullish?Bitcoin Dominance produced a bullish trend that was more than 1,000 days long. While this was a major development, the action never happened just straight up. There were always fluctuations.
Bitcoin Dominance broke out of a major rising wedge pattern. A pattern that lasted years in the making.
Recently, Bitcoin Dominance produced the highest bearish volume since 2021. A strong chart signal.
The major breakdown following the multiple years long uptrend signals the start of a change of trend. A downtrend. This downtrend is extremely bullish for the altcoins market because BTC.D only goes down when the altcoins are going up and doing so faster than Bitcoin.
What we are seeing now is an inverted correction, a pullback. Simply put, BTC.D already made a strong drop and it needs some relief. This relief is not the end. Bitcoin Dominance can move just a little higher to later resume its newly developing downtrend. Which means that the altcoins market bull market has not reached its end, it is only getting started.
Thank you for reading.
Namaste.

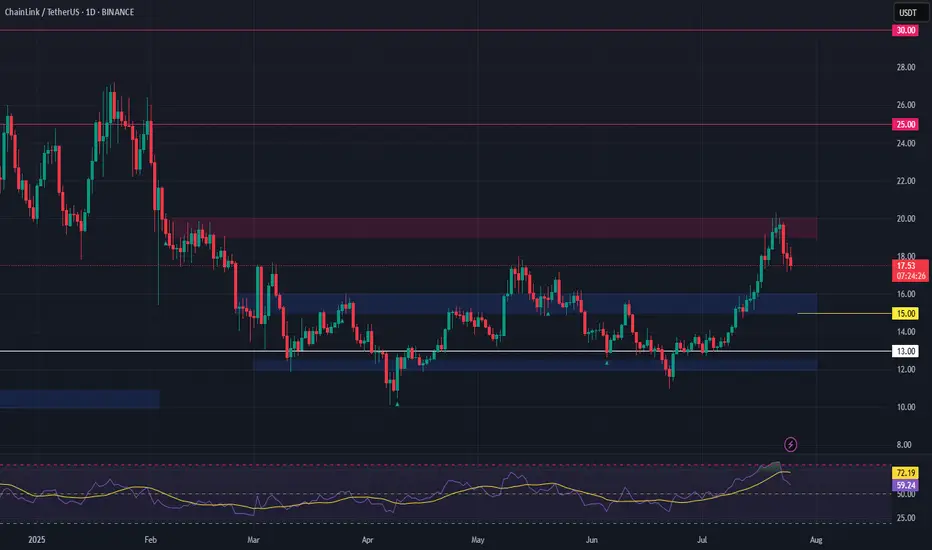
LINK Swing Trade – Watching for a PullbackLINK has rallied 58% since June 24th and is now consolidating after making a higher high. Price action is facing resistance and looks overheated, so a pullback toward support could offer a fresh long entry.
📌 Trade Plan:
• Entry Zone: $15.00 – $16.00 (on pullback)
• Take Profit Levels:
o 🥇 $20
o 🥈 $25
o 🥉 $30
• Stop Loss: Close below $13
XRPUSD - Target reached. Reversal on the plateSo, that was a nice long trade.
Now price is stretched at the Upper Medianline Parallel (U-MLH).
As of the time of writing, I already see price pulling back into the Fork. A open and close within the Fork would indicate a potential push to the south.
Target would be the Centerline, as it is the level where natural Meanreversion is.
Observation Hat ON! §8-)

Bitcoin is correcting ┆ HolderStatBINANCE:BTCUSDT compresses inside a triangle between $132K and $137K. Breakout above $137K could initiate a run toward $143K. Breakdown exposes $132K. Watch for decisive move.

Ethereum will retest the $3,500 level ┆ HolderStatOKX:ETHUSDT is trending upward with $3,100 as the next resistance. Breakout aims for $3,250. $2,875 remains critical support. Bullish momentum intact.

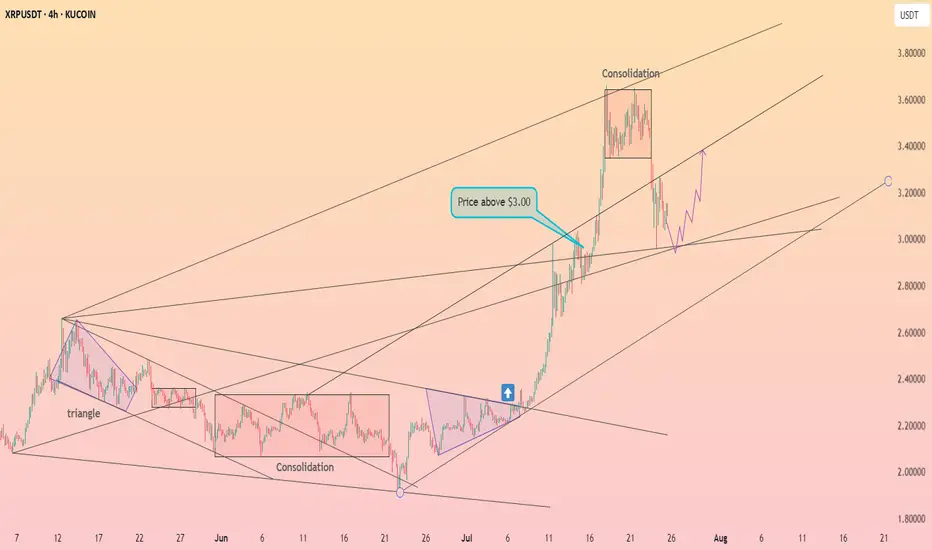
XRP stays above $3 ┆ HolderStatBYBIT:XRPUSDT is printing higher lows into the $3.44 resistance. Breakout could activate $3.60 target. Watch $3.30–$3.28 for possible pullbacks. Bullish pressure mounting.
Solana is bouncing back from $175 ┆ HolderStatOKX:SOLUSDT is testing the $180 barrier. Breakout could extend gains to $186. If rejected, $172–$173 may act as reentry zone. Market structure favors continuation.
Now We WaitTrading Fam,
In my last video, I mentioned how I had been learning to trade more patiently, giving myself those high-quality, high-probability winning trades. This is a perfect time to illustrate that strategy.
With our altcoin market overheated, I am expecting more rest, accumulation, and pullback in many of our alts. The selection of even decent entries is very slim. It's time for us to sit back, wait, and let the trades come to us again.
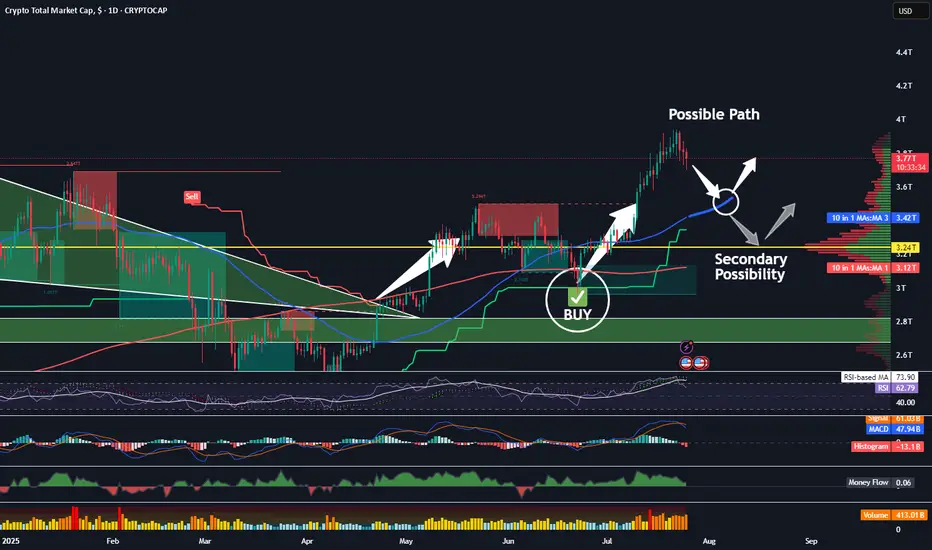
The TOTAL chart shows us more clearly what may occur. Let's discuss a few important indicators on this chart.
First of all, we see my indicator popped a BUY signal right around 3T. We had a safe bet at that point; we were going to see quite a bit of buying action in the altcoin space. Indeed, we did. The altcoin market increased by about 25 percent and went all the way to 4T, at which point the sellers came back in. Now, we are in the middle of a little bit of a pullback, and I think there could be more to come. I am expecting at least a touch of that rising 50-day SMA, currently at 3.4T.
Supporting my thesis here are the crossover of the RSI to the downside of its 14-day MA, the MACD cross, the Chalkin money flow decrease, and the HMV indicating high volume during these sell-offs. Leverage is being liquidated. This is healthy!
It is possible that the total market cap could drop even further, all the way down to that 3.24T PoC on the VRVP. That is where we see most of our volume in alts has occurred. Keep these two targets in mind. Once hit, I will begin looking for more trade entries once again.
✌️Stew
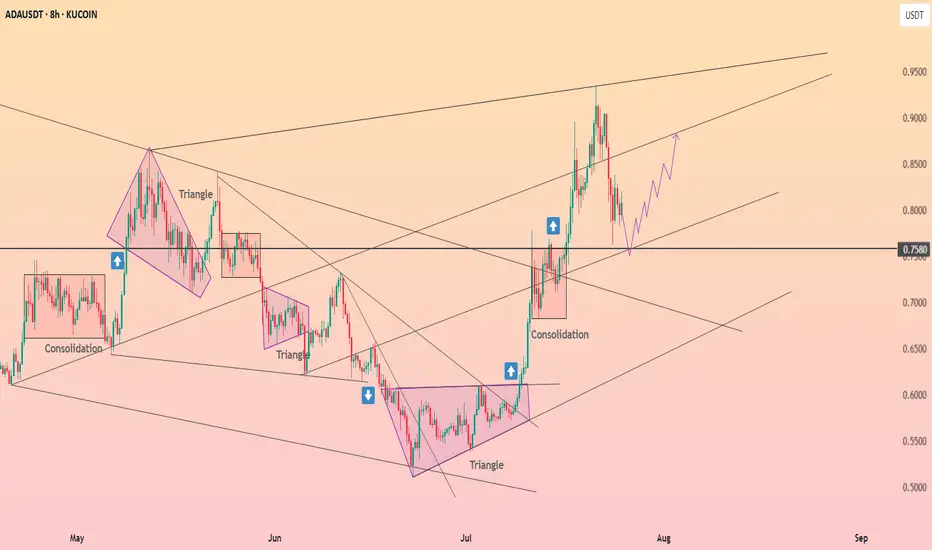
Cardano held above $0.76 ┆ HolderStatBINANCE:ADAUSDT is compressing under $0.44 with support from $0.418. Breakout from wedge structure may target $0.462. If $0.418 breaks, downside risk opens to $0.40. Watch for volatility.
ETH on the 1H
After rejecting the 0.236 Fib level, price found support at the 200MA.
RSI cooled off slightly, giving room for another move before hitting overbought.
MACD just flipped bullish, pushing price higher.
MLR > SMA > BB Center — structure confirms upward momentum.
Now price is back at the Fib level.
It looks fresher than yesterday, but needs clean closes above to build traction for a real breakout.
We’ll be here watching.
Always take profits and manage risk.
Interaction is welcome.

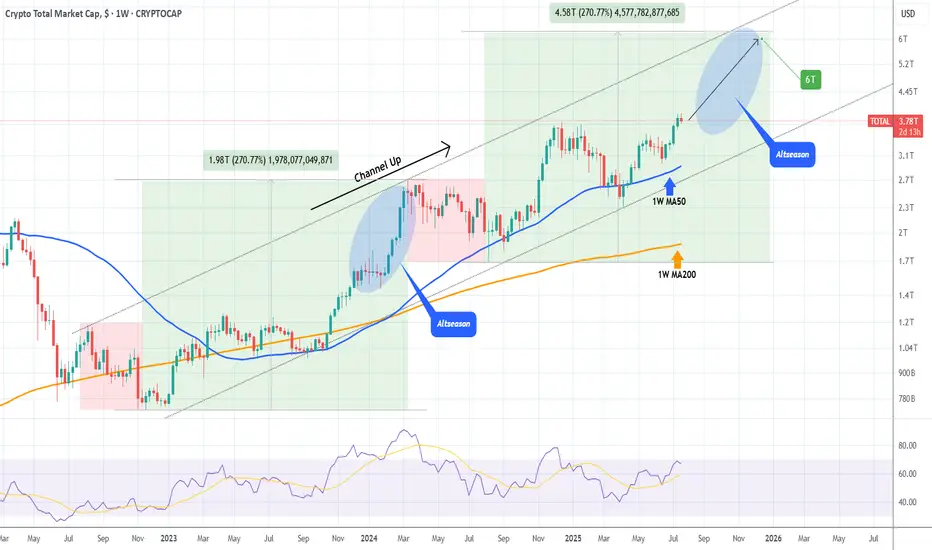
TOTAL CRYPTO MARKET CAP expected to hit $6 Trillion!The Crypto Total Market Cap (TOTAL) has been on a Channel Up since the 2022 market bottom and since the April 07 2025 Low (Higher Low for the pattern), it's initiated the new Bullish Leg, already turning the 1W MA50 (blue trend-line) into Support.
As long as this holds, we expect it to complete a +270% rise from the August 05 2024 Low, similar to the Bull Cycle's first Green Phase, and reach at least a $6 Trillion Market Cap!
More importantly, we expect this final part (blue ellipse) to be what is commonly known as an Altseason, where the lower cap coins show much higher returns and disproportionate gains to e.g. Bitcoin.
-------------------------------------------------------------------------------
** Please LIKE 👍, FOLLOW ✅, SHARE 🙌 and COMMENT ✍ if you enjoy this idea! Also share your ideas and charts in the comments section below! This is best way to keep it relevant, support us, keep the content here free and allow the idea to reach as many people as possible. **
-------------------------------------------------------------------------------
💸💸💸💸💸💸
👇 👇 👇 👇 👇 👇
#1INCH Setup Favors Bears | Can Bears Pull it Down Further? Yello Paradisers! Are you prepared for what might be the next big move on #1INCHUSDT? The #1INCHNetwork is flashing clear warning signs:
💎#1INCH is currently trading inside a Descending Triangle, a pattern that historically favors bears. The price has broken down the lower support and is coming to retest it. If #INCHUSD retests the lower support and doesn't enter the descending triangle, the probability of the bearish pressure will increase.
💎The 50 EMA is acting as a strong dynamic resistance, reinforcing the bearish bias. Every attempt to reclaim higher levels has been rejected, and as long as we remain capped below the descending resistance, bulls are at a clear disadvantage.
💎A successful retest of the lower support trendline will significantly increase the probability of a breakdown. If this triangle finally breaks to the downside, we should be watching the $0.2116 support zone as the first key level to catch any temporary reaction.
💎But the real danger — and opportunity for patient traders — lies lower. If $0.2116 fails, the next strong demand zone sits at $0.1582, which could be the level where real buyers finally step back in. Until then, any bullish scenario remains invalid unless the price breaks and closes above the strong resistance at $0.3332.
Trade smart, Paradisers. This setup will reward only the disciplined.
MyCryptoParadise
iFeel the success🌴

Bearish retest or deviation for Bitcoin117000 is key. it’ll decide whether this is a bearish retest or just a deviation. i believe it’s a bearish retest and we’re setting up for 110-114 next.
last drop came when price kept failing to hold above EQ. now we’re below the EQ of the ath/previous ath range. if price can’t reclaim that either, a deeper drop is likely. a 12h close above EQ could open the path toward 120-121k, but that’s the less probable case in my view.
why? nasdaq and spx are in premium zones (fib extensions), and holidays are near for big players. as profit taking hits there, pressure will echo here. simple cause, predictable effect.
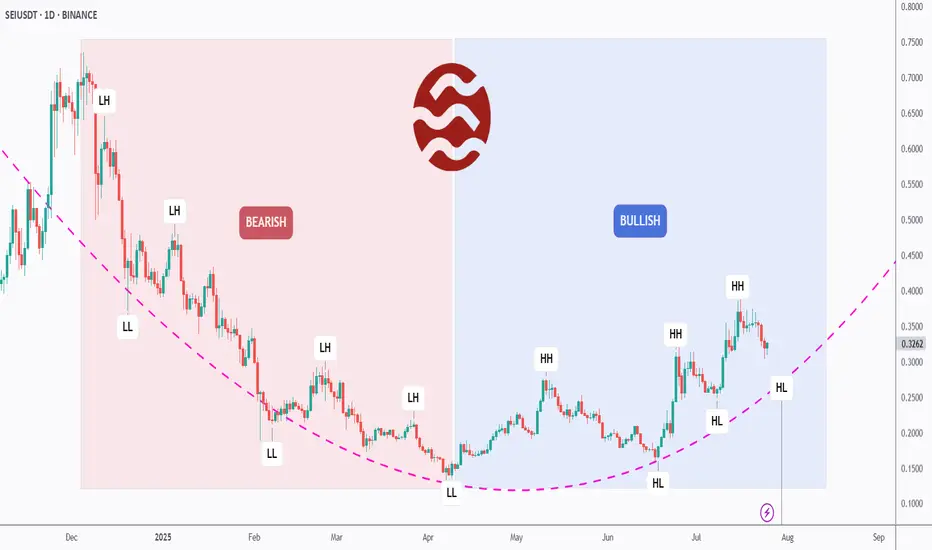
[Deep Dive] SEI – Edition 2: From Pain to Power: A Bull Cycle?SEIUSDT may have just flipped the script.
After months of consistent lower highs and lower lows, SEI has officially broken its bearish structure and is now printing clear higher highs (HH) and higher lows (HL) — a textbook sign of a trend reversal.
📉 Left Side: Bearish Breakdown
From late 2023 to Q2 2025, SEI was stuck in a painful macro downtrend. The structure was brutally clean: LH → LL → LH → LL. Each bounce was weaker than the last, reflecting exhausted buyers and relentless supply.
But something changed in late Q2…
📈 Right Side: Bullish Rebuild
Since its final low around April, SEI began to carve a new path. What started as a subtle accumulation quickly morphed into a solid structure of higher highs and higher lows.
The arc-shaped pink trendline tracks this momentum shift — and we’re now watching a potential continuation of the bullish cycle.
The most recent HL is forming exactly on that curve — a critical moment where bulls may step in for the next impulsive move.
🔥 What’s Fueling the Shift?
SEI is gaining traction as a high-performance Layer 1 designed for trading apps, with native parallelization and a focus on speed and throughput.
Its recent ecosystem growth — including projects in DeFi, gaming, and infrastructure — has started to attract both retail and VC attention.
On-chain metrics are showing increased activity, and whispers of upcoming protocol incentives could be the spark that pushes SEI toward the $0.45–$0.50 range.
🧠 What We’re Watching
- The current HL zone — will bulls defend this level?
- If SEI can break above the previous HH, the bullish structure strengthens.
- A failure to hold this HL would suggest a range or even deeper correction — so risk management is key.
Let’s recap:
- Structure has flipped bullish ✅
- SEI is riding a fresh higher low ✅
- Fundamental momentum is building behind the scenes ✅
It’s now up to the market to decide if this was just a bounce — or the beginning of a much bigger move.
💬 What do YOU think: Is SEI building steam for a breakout, or just teasing us with a fakeout?
🔔 Disclaimer: This analysis is for educational and informational purposes only. It does not constitute financial advice or a recommendation to buy or sell any asset. Always do your own research and manage your risk accordingly.
📚 Always follow your trading plan => including entry, risk management, and trade execution.
Good luck!
All strategies are good, if managed properly.
~ Richard Nasr
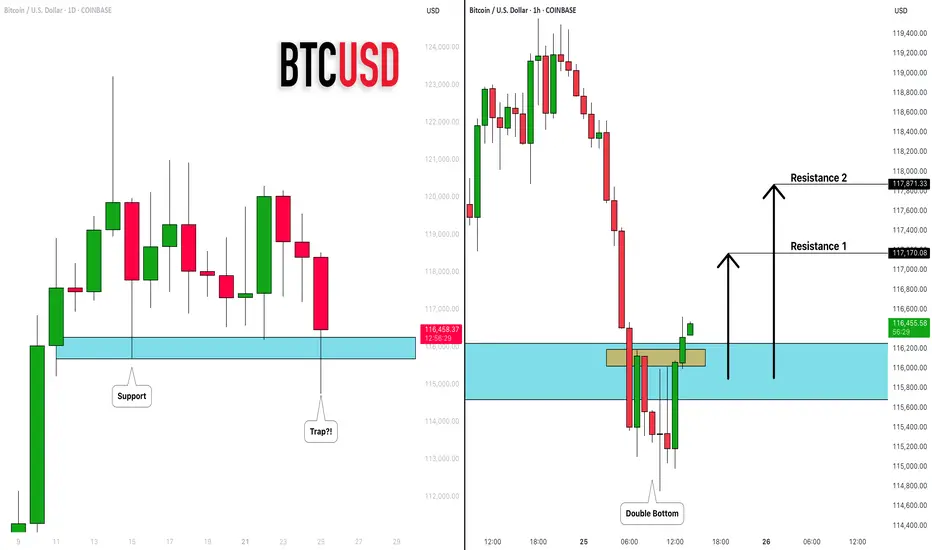
BITCOIN (BTCUSD): Recovery Starts
Bitcoin is going to rise from a key daily support.
After a liquidity grab, the market shows a clear strength,
forming a double bottom on an hourly time frame.
I expect a bullish movement at least to 117100
❤️Please, support my work with like, thank you!❤️
I am part of Trade Nation's Influencer program and receive a monthly fee for using their TradingView charts in my analysis.
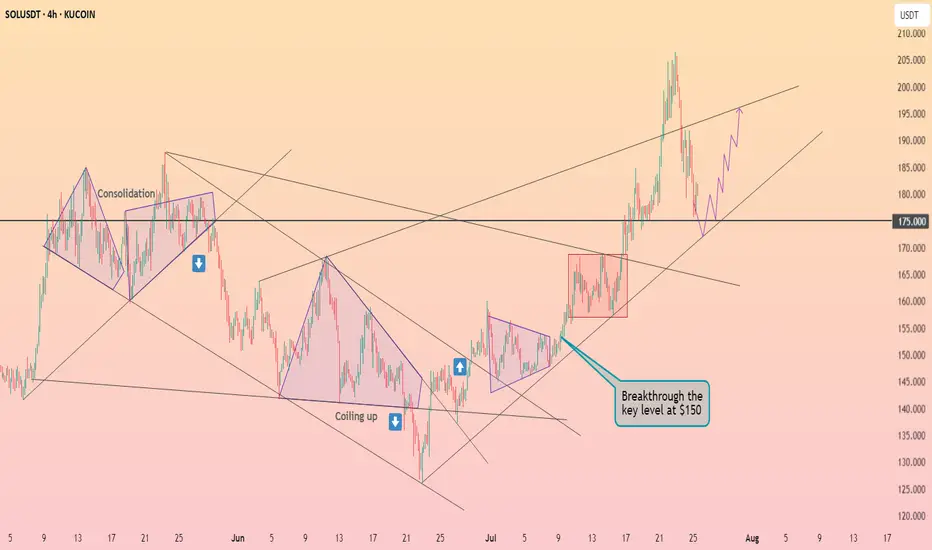
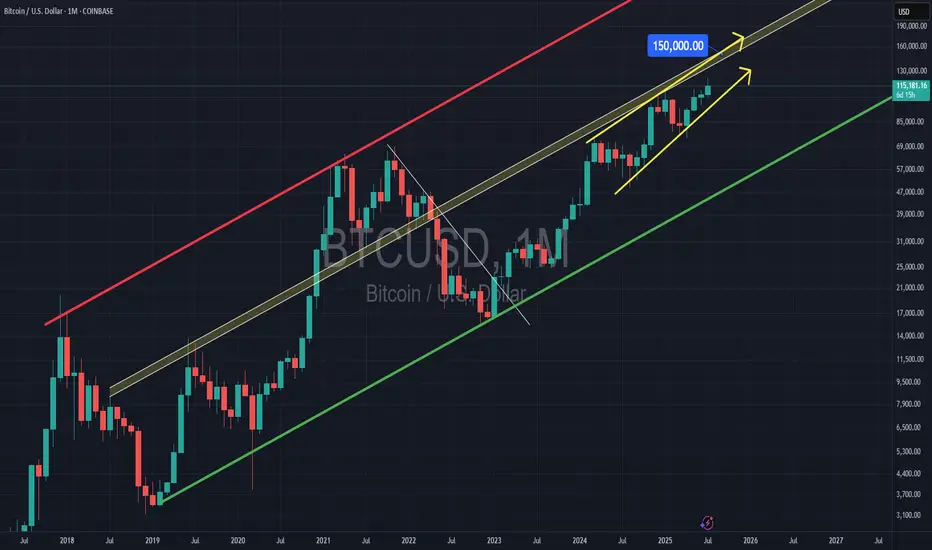
Bitcoin & 150k TOPBitcoin has been trading within a rising channel for a long time, with resistance at $150,000. The middle support/resistance line also indicates $150,000, suggesting a potential significant rejection at this level.
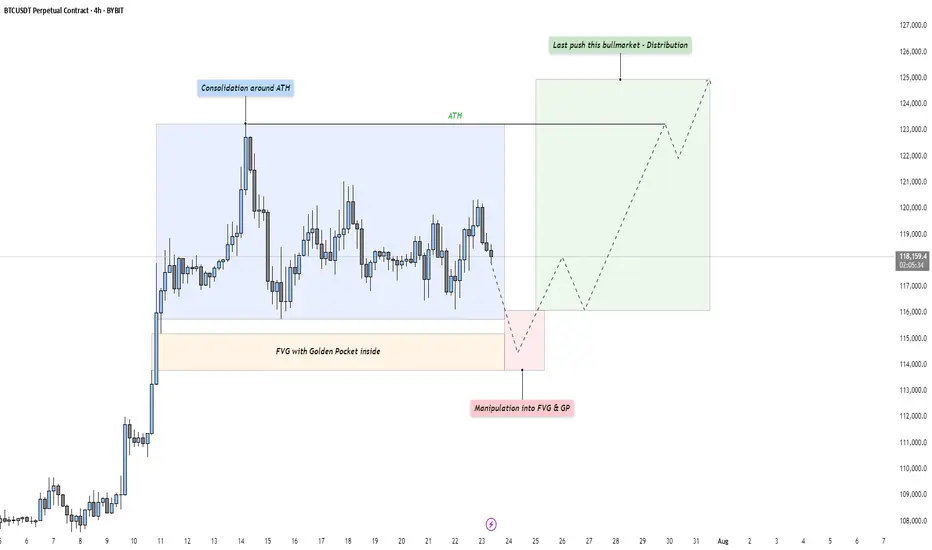
BTC - Last Push: Consolidation, Manipulation & DistributionMarket Context
After a strong upward impulse, Bitcoin has entered a mid-term consolidation phase just below its all-time high. This kind of price action is typical as the market digests recent gains and larger participants prepare for the next move. These pauses in momentum often precede either trend continuation or a reversal — and the structure here suggests we might be witnessing the former, but not without a final shakeout.
Phase 1: Consolidation Around the All-Time High
The first phase is defined by a tight range just beneath the all-time high, where price moves sideways in a balanced struggle between buyers and sellers. This is often where retail participants become overly bullish, anticipating a breakout. However, the lack of a sustained move higher indicates that smart money may be waiting for better entries — or preparing to engineer liquidity to fuel the next move.
Phase 2: Manipulation Into the Fair Value Gap and Golden Pocket
Directly below the range lies a clean Fair Value Gap, with a Golden Pocket retracement nestled inside it. This zone represents a strong area of interest. A sharp move into this area would likely sweep late long positions and trigger stop-losses from range traders — a classic manipulation pattern. This phase serves two purposes: collect liquidity and offer favorable pricing for larger players looking to position themselves before expansion. Watch for signs of absorption or reversal as price enters this zone.
Phase 3: Expansion – The Last Push of the Bull Market?
Following the liquidity sweep and reaction from the Fair Value Gap and Golden Pocket zone, we could see a renewed expansion toward higher highs. This is the phase where volume returns, sentiment shifts, and price accelerates. If this plays out, it could mark the final leg of this bull cycle — potentially driving Bitcoin to new all-time highs with strength.
Execution Thoughts
If you're looking to participate, it's wise to wait for a confirmation signal on a lower timeframe — like the 5-minute or 15-minute chart — once price enters the Fair Value Gap and Golden Pocket zone. Watch for a strong bullish reaction, break of structure, or shift in order flow to signal that buyers are stepping back in.
Final Thoughts
Let the market come to your level and don’t chase moves without context. These three phases — consolidation, manipulation, and expansion — are timeless patterns seen across all markets. Stay patient, stay objective, and react with clarity.
If this breakdown helped you see the setup more clearly, a like would mean a lot — and I’d love to hear your thoughts in the comments! Are you watching the same zone, or do you see something different?
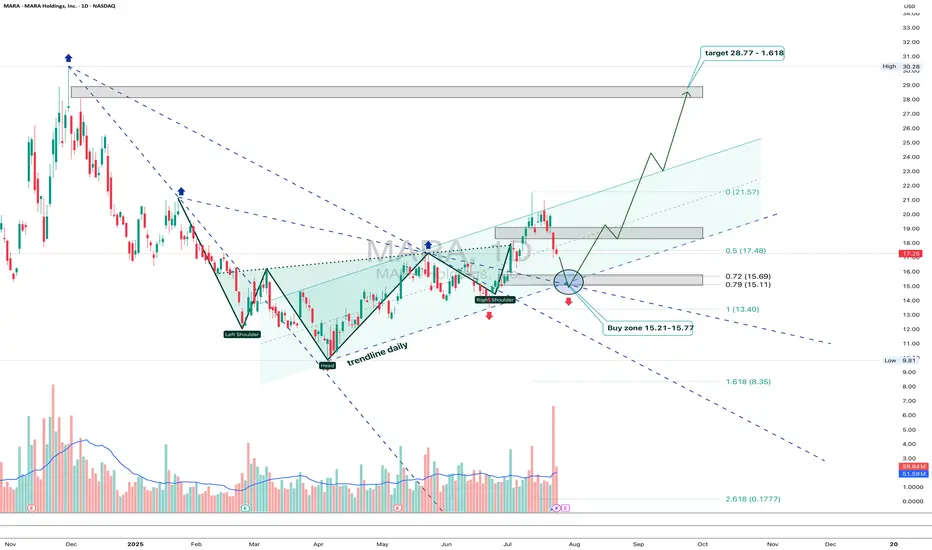
MARA: shoulders done, now walk toward the targetOn the daily chart, MARA completed a textbook inverse Head & Shoulders reversal with a clear breakout above the descending trendline. A corrective pullback followed, and the price is now heading into the key buy zone at 15.21–15.77 - aligning with the 0.72 and 0.79 Fibonacci retracements, and the upper boundary of the broken channel. This is the area to watch for a potential continuation of the bullish impulse.
Volume on the breakout was above average, confirming strong buyer interest. The EMAs are trending below the price, supporting the upward structure. The first target is located at 21.57 (previous resistance), with a potential extension to 28.77 (Fibonacci 1.618).
Fundamentally, MARA remains highly correlated with BTC and crypto sentiment. As interest returns to crypto-related assets due to ETF flows and possible Fed easing, mining stocks like MARA gain attention. Recent reports also show improved production efficiency and lowered costs - a tailwind for bulls.
Tactically, the best setup would be a confirmed reaction from the buy zone — whether a strong candlestick formation, volume surge, or reclaim of a key level. If that happens, aiming for 21.57 and 28.77 becomes a solid plan.
The pattern played out - now it's time for the market to walk the talk.