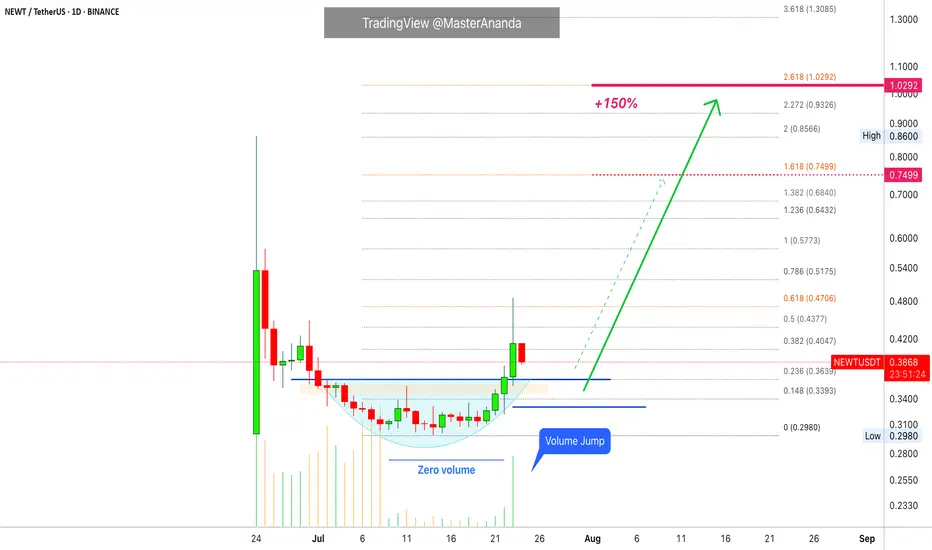
Newton Protocol · Volume Signal · 150% PP Short-TermI will show you now a successful choice on a volume signal as we look at Newton Protocol (NEWTUSDT) on the daily timeframe.
Notice how trading volume is flat while NEWTUSDT is producing a rounded bottom with the daily candles. It reads "zero volume" on the chart.
Now notice the strong "volume jump" today, 23-July, as soon as the action moves outside the rounded bottom, also a Fib. extension resistance. The strong jump confirms the start of a bullish advance. Our short-term target gives us 150% profits potential.
I will end this series soon and go back to our usual schedule.
These charts show the altcoins market being full of opportunities at this point in time. There is something for all types of market participants, active or passive traders. Risk lovers or risk averse. We are only getting started.
Your support is appreciated and all feedback is welcome.
Do you enjoy short-term trades?
Did you know, you can hold these pairs long-term once the bullish trend develops. Selling for profits is only optional, the market is set to grow until late 2025 or maybe into Q1 2026 or beyond.
The things that are happening worldwide in relation to Crypto are a first in the history of humanity. It is the first time that money is free from a tiny controlling monopoly. It is the first time in our history that you can create your own money. Decentralized finance. No middle men. The greatest financial and technological development in our history.
Namaste.
Crypto
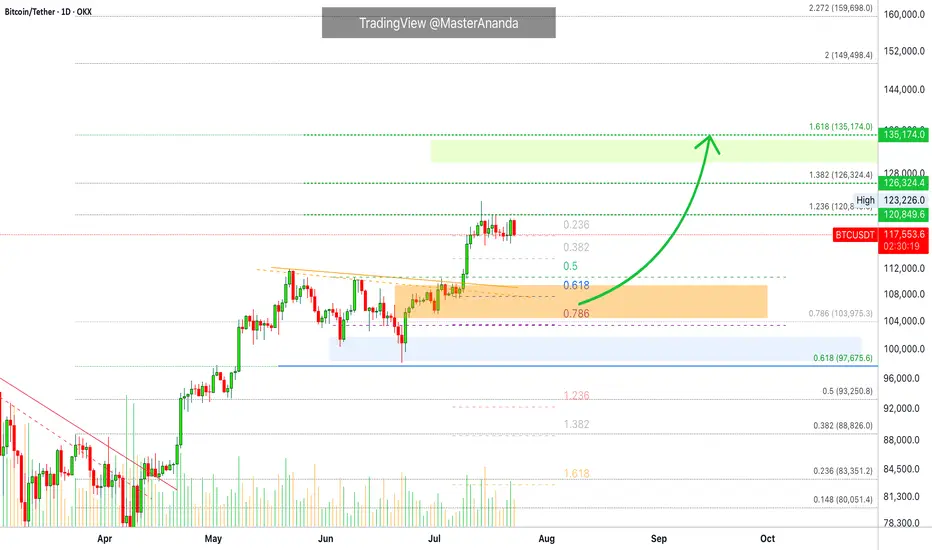
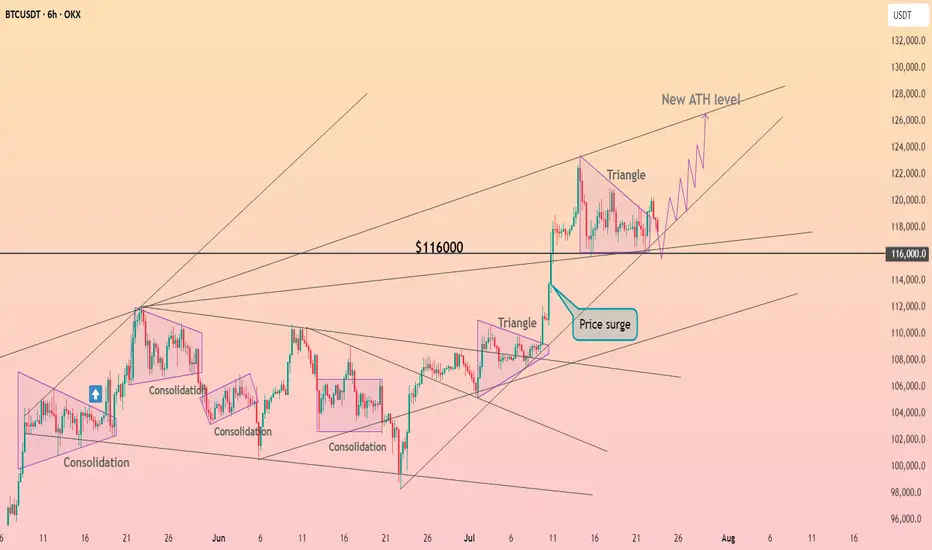
What's The Lowest Bitcoin Can Go? (Top Altcoins Choice —Comment)Bitcoin just hit a new all-time high recently and is consolidating just below resistance. I have a question: How far down can Bitcoin go on a sudden retrace?
That's a great question. Assuming that Bitcoin will continue growing mid-term and long-term, we can expect some more consolidation before higher prices. A retrace is not mandatory but is possible. A correction is almost impossible; low probability; not likely.
The worst case scenario Bitcoin does go down and the action should stop right at the previous high. Resistance turned support. That is, $112,000 to $110,000 would the first and main support range. Harder for Bitcoin to move much lower but these levels are not active yet.
If Bitcoin were to produce an extreme shakeout before additional growth, I would say the worst possible would be a touch of $104,000, but this is still a low probability setup. The chances are that Bitcoin will continue sideways while the altcoins grow. The fact that the altcoins are bullish means that Bitcoin will resume growing in due time. The next major move is another advance exceeding $130,000. It can happen within weeks or next month.
Patience is key on Bitcoin, the altcoins need to catch up.
Sometimes, Bitcoin can go sideways for months wile the altcoins grow. Prepare to wait or switch yourself to some mid-sized and small-cap altcoins. The big pairs tend to move like Bitcoin. Each chart needs to be considered individually.
Thanks a lot for your support.
Feel free to leave a comment with your favorite altcoin for an update. I will do an analysis for you in the comments section below.
Namaste.
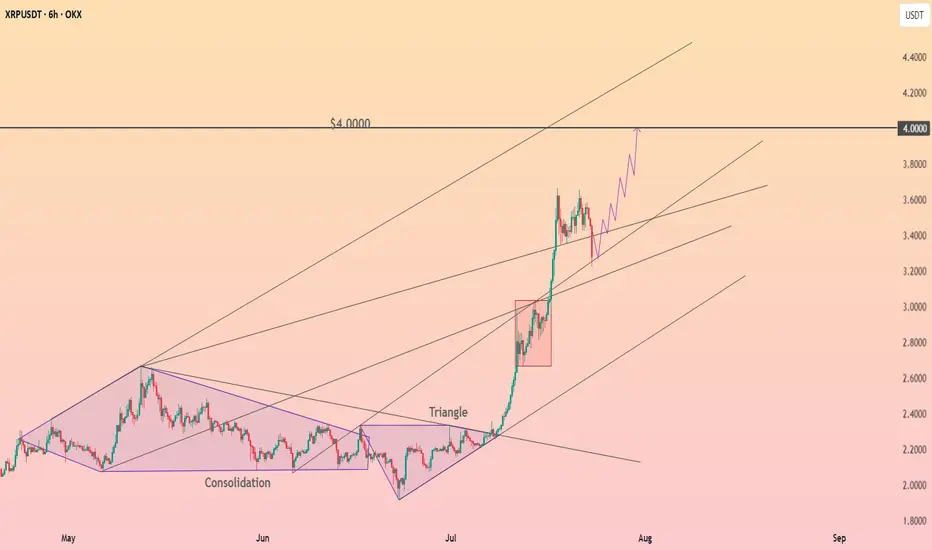
XRP Temporary Pull Back Followed Bu Move Up To $4.00XRP Created a new high. Looking for a pull back to the 50% retracement level. Followed by a move up to the 141 fib level of around $4.00

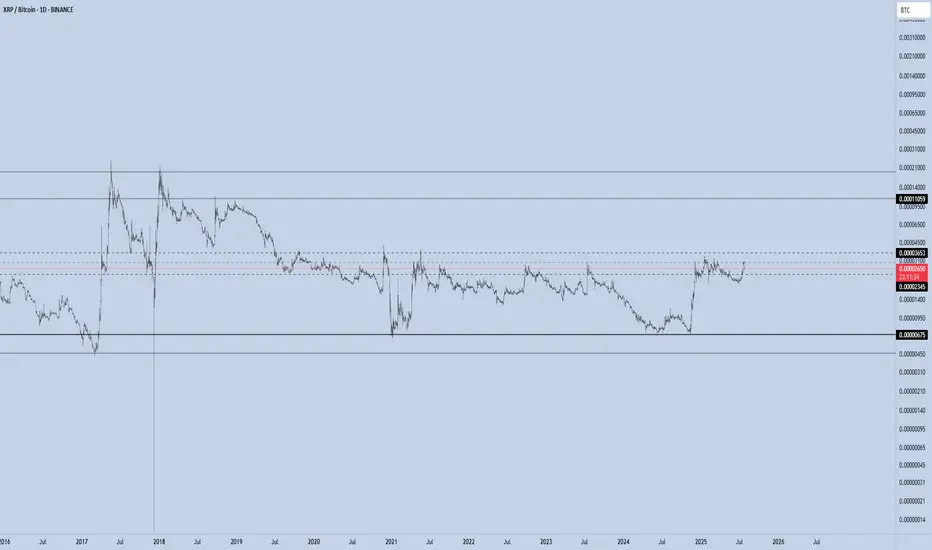
XRP/BTC – Channel Midline in Play The XRP/BTC pair trade inside a multi-year channel, with price currently testing the midline of this structure — a pivotal level that could define the next macro leg.
If bulls manage to break the midline to the upside and successfully retest it as support, the upper boundary of the channel becomes the next major target.
🔼 Upside Scenario:
A confirmed breakout above the midline would signal structural strength and likely lead to a rally toward the upper channel resistance.
If this move aligns with BTC dominance dropping below the 60% threshold, we could see a full-blown altseason emerge.
Under such conditions, historical XRP/BTC behavior suggests that XRP/USD could reach $12–$24.
🔽 Downside Risk:
Losing the mid-channel from here would weaken the structure and invalidate the breakout thesis.
In that case, XRP/BTC would likely rotate back toward range lows, and a defensive strategy is warranted.
Macro Implication:
The 60% BTC Dominance level remains critical. A clean breakdown below it historically marks the beginning of altseason, where high-beta plays like XRP against BTC have outperformed. XRP’s current posture within the channel reflects this high-stakes moment.
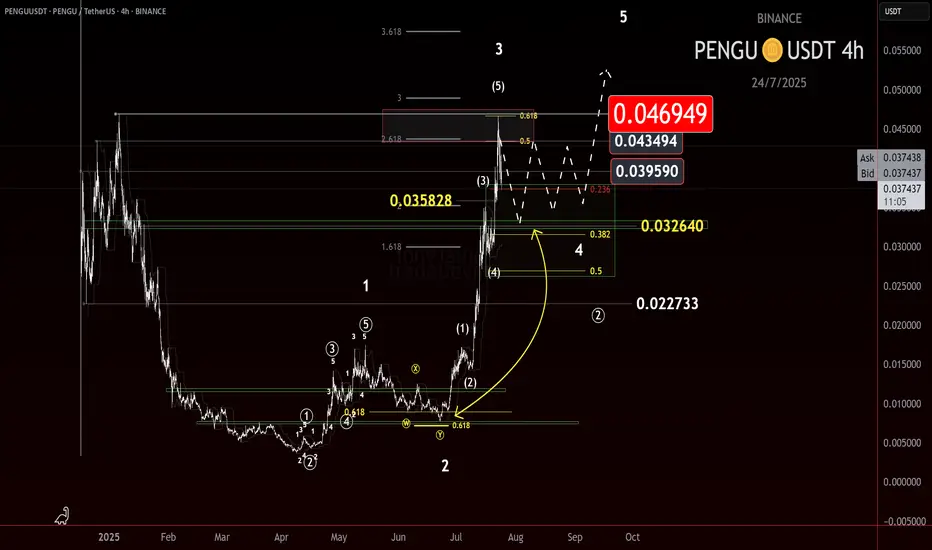
Is $PENGU Cooling Off?CSECY:PENGU continues to deliver, respecting structure and printing some clean price action. After breaking out of consolidation beneath the LOI at 0.032, price extended sharply, reaching as high as 0.0469—where we just saw a firm rejection, previously identified in the last update.
That level wasn’t random. It aligned with a Most Likely Target (MLT) for a wave 5 at a lesser degree and a wave 3 at a higher degree. That kind of confluence usually draws in some heat—and it did.
So what now?
The conservative bull outlook is that we may be entering a wave 4. How this pullback unfolds could tell us a lot. The last retrace was shallow, and if this one digs a bit deeper or breaks certain levels with pattern clarity, that might signal a higher degree wave 4 is underway. The key level here is the 0.0325 level we were watching before.
The raging bull scenario is that we’re still in a lesser degree impulse up. A hold and bounce off the key level could be enough to continue the move higher. But I’m watching the conservative outlook here until we get more print.
Here’s what I’m watching:
• Wave 4 Behavior
Is this a pause or a pivot? The next leg depends on how corrective this gets.
• 0.027
A break here would raise eyebrows. That’s a deeper level of interest and could hint at something more than a minor pullback.
• Pattern Depth & Structure
Each retrace tells a story. More complex wave 4s tend to show themselves through drawn-out corrections or deeper fib targets.
I’m still holding partial from the original 0.012 entry, having taken some profit on the way up. If we get a clean W4 print, I’ll be scouting for the next add.
Trade what’s printed. Stay flexible. Let the wave show its hand.
Trade Safe.
Trade Clarity.
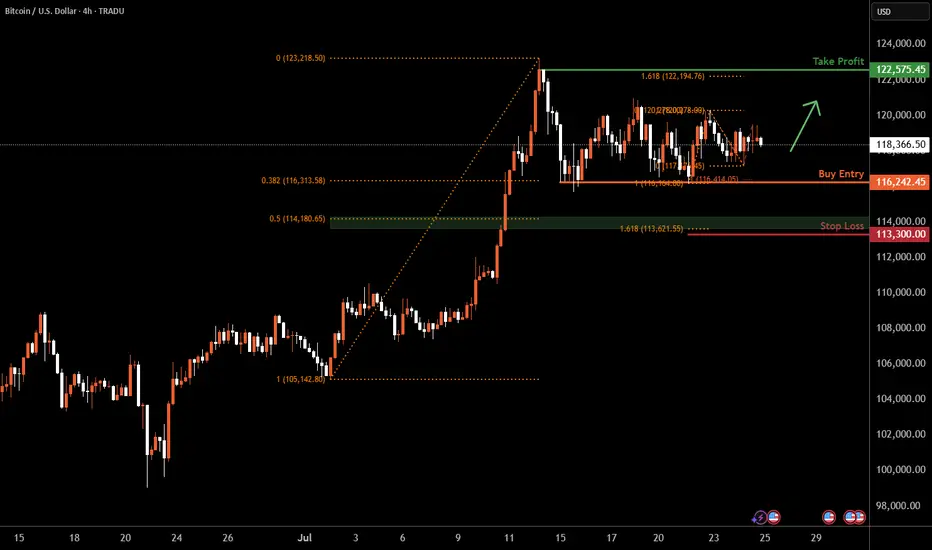
Bitcoin H4 | Falling toward a multi-swing-low supportBitcoin (BTC/USD) is falling towards a multi-swing-low support and could potentially bounce off this level to climb higher.
Buy entry is at 116,242.45 which is a multi-swing-low support that aligns with a confluence of Fibonacci levels i.e. the 38.2% retracement and the 100% projection.
Stop loss is at 113,300.00 which is a level that lies underneath a support zone that is identified by a confluence of Fibonacci levels i.e. the 50% retracement and the 161.8% extension.
Take profit is at 122,575.45 which is a swing-high resistance that aligns close to the all-time-high.
High Risk Investment Warning
Trading Forex/CFDs on margin carries a high level of risk and may not be suitable for all investors. Leverage can work against you.
Stratos Markets Limited (tradu.com ):
CFDs are complex instruments and come with a high risk of losing money rapidly due to leverage. 66% of retail investor accounts lose money when trading CFDs with this provider. You should consider whether you understand how CFDs work and whether you can afford to take the high risk of losing your money.
Stratos Europe Ltd (tradu.com ):
CFDs are complex instruments and come with a high risk of losing money rapidly due to leverage. 66% of retail investor accounts lose money when trading CFDs with this provider. You should consider whether you understand how CFDs work and whether you can afford to take the high risk of losing your money.
Stratos Global LLC (tradu.com ):
Losses can exceed deposits.
Please be advised that the information presented on TradingView is provided to Tradu (‘Company’, ‘we’) by a third-party provider (‘TFA Global Pte Ltd’). Please be reminded that you are solely responsible for the trading decisions on your account. There is a very high degree of risk involved in trading. Any information and/or content is intended entirely for research, educational and informational purposes only and does not constitute investment or consultation advice or investment strategy. The information is not tailored to the investment needs of any specific person and therefore does not involve a consideration of any of the investment objectives, financial situation or needs of any viewer that may receive it. Kindly also note that past performance is not a reliable indicator of future results. Actual results may differ materially from those anticipated in forward-looking or past performance statements. We assume no liability as to the accuracy or completeness of any of the information and/or content provided herein and the Company cannot be held responsible for any omission, mistake nor for any loss or damage including without limitation to any loss of profit which may arise from reliance on any information supplied by TFA Global Pte Ltd.
The speaker(s) is neither an employee, agent nor representative of Tradu and is therefore acting independently. The opinions given are their own, constitute general market commentary, and do not constitute the opinion or advice of Tradu or any form of personal or investment advice. Tradu neither endorses nor guarantees offerings of third-party speakers, nor is Tradu responsible for the content, veracity or opinions of third-party speakers, presenters or participants.
Bitcoin, SPX, Ethereum, Tesla: Whats Next? BTC appears to be showing distribution signs.
I do believe BTC local top is in, but alt coins like Ethereum can still push a bit higher.
Ethereum short around 3900-4000 looks promising
Tesla fell sharply on the back of cash flow burn and expenditures.
Investors are also fearful of sales decline and loss of EV credits.
SPX hit major long term resistance today. Coupling this with a depressed Vix we are likely setting up for a pullback in the market.
Small caps saw distribution today on the back of rising yields. A failed breakout observed on IWM chart.

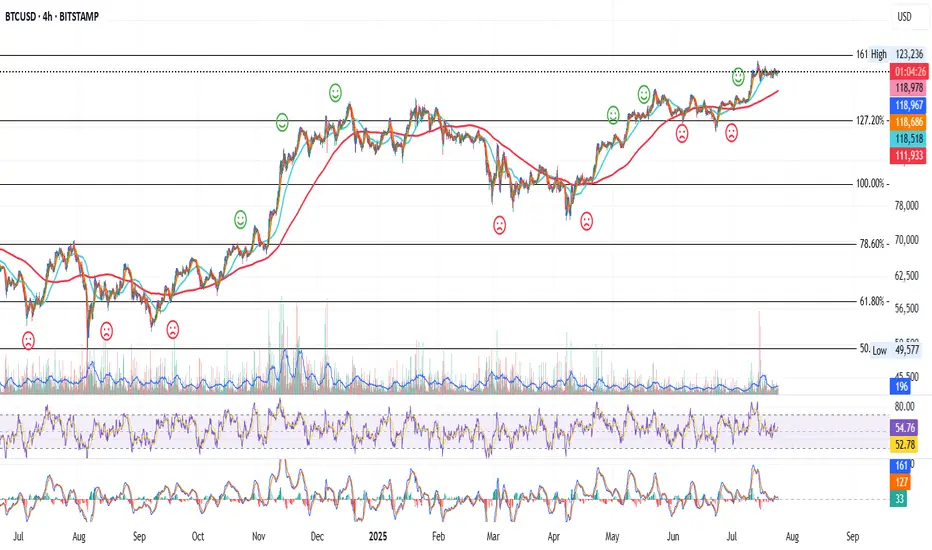
BTC 4H – Dance with the 200MA
Bitcoin continues its strong relationship with the 200MA.
Each time price dips below it, fear spikes — but bounces off key Fib levels have followed, with price then riding higher alongside the 200MA.
Right now, price is caught between the 200MA and a nearby Fib level.
Here’s what could happen next:
– Price flips the Fib into support, ideally with help from a rising 200MA.
– Price waits for the 200MA to catch up, and they break the Fib together.
– Or, we get another panic dip, and the bounce comes after another test from below.
Whichever path it takes, we’ll be here watching it unfold.
Always take profits and manage risk.
Interaction is welcome.
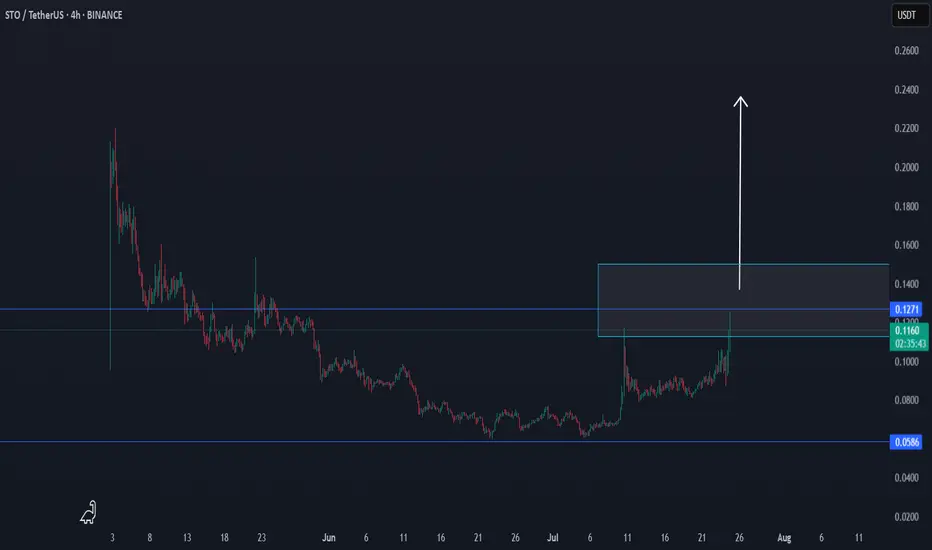
STO/USDT THE FLY EFFECTSTO/USDT are in a trend, which can break.
We will follow the confirmations in the coming time frames.
Volume looks interesting.
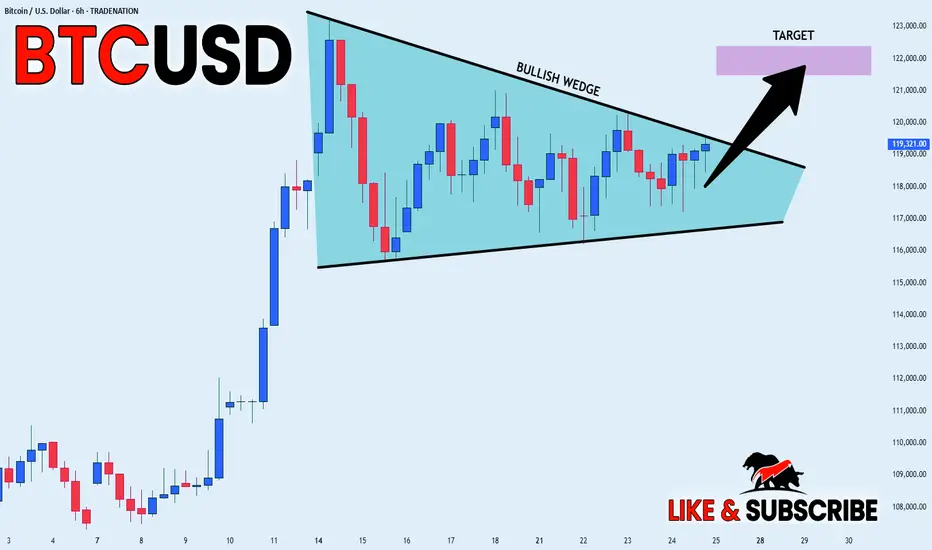
BITCOIN BULLISH WEDGE|LONG|
✅BITCOIN is trading in a
Strong uptrend and the coin
Has formed a massive bullish
Wedge pattern so we are
Bullish biased and IF we see
A bullish breakout we will
Be expecting a further
Bullish move up
LONG🚀
✅Like and subscribe to never miss a new idea!✅
Disclosure: I am part of Trade Nation's Influencer program and receive a monthly fee for using their TradingView charts in my analysis.
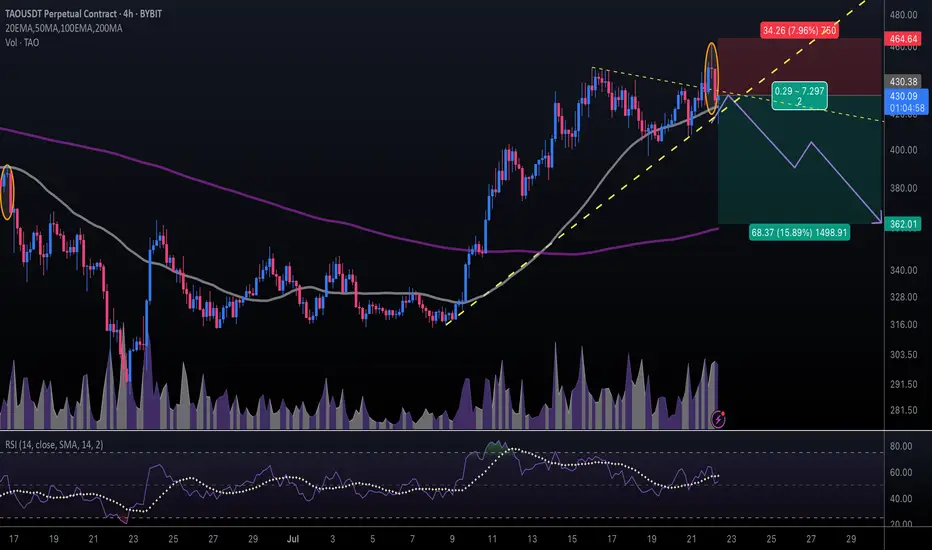
#TAOUSDT #4h (ByBit) Ascending trendline near breakdownBittensor printed an evening doji star deviation, a retracement down to 200 MA support seems next.
⚡️⚡️ #TAO/USDT ⚡️⚡️
Exchanges: ByBit USDT
Signal Type: Regular (Short)
Leverage: Isolated (5.0X)
Amount: 5.0%
Entry Targets:
1) 430.38
Take-Profit Targets:
1) 362.01
Stop Targets:
1) 464.64
Published By: @Zblaba
GETTEX:TAO BYBIT:TAOUSDT.P #4h #Bittensor #AI #DePIN bittensor.com
Risk/Reward= 1:2.0
Expected Profit= +79.4%
Possible Loss= -39.8%
Estimated Gaintime= 1 week
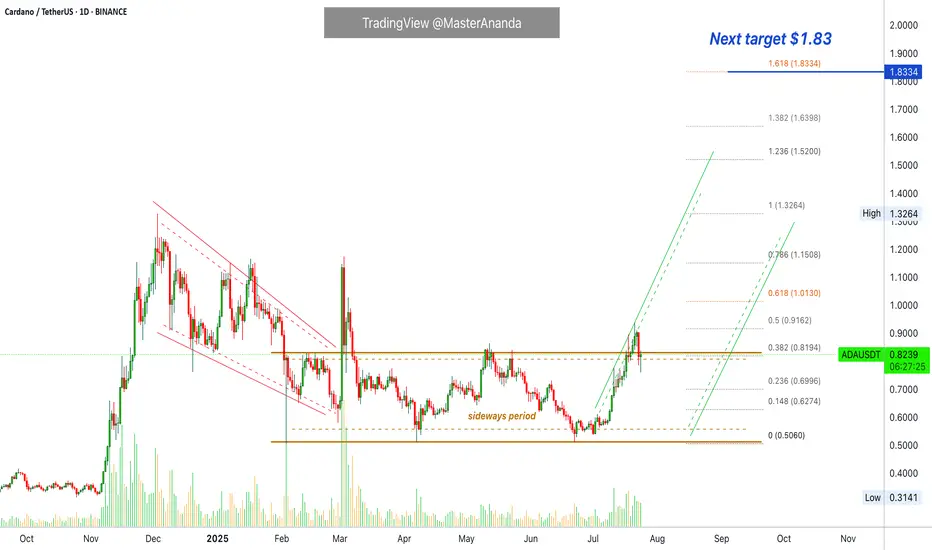
Cardano Has Plenty of Room To Grow · Will Hit Beyond $4 EasilyCardano's all-time high is $3.10. Cardano is currently trading at $0.82. Pause. You will be a genius when ADA is trading at $4 if you decide to buy below $1. It is not too late. This is only the start.
Good afternoon my fellow Cryptocurrency trader, how are you feeling in this wonderful day?
The first major advance for Cardano after the last bull market happened November 2024 and peaked December; we are still getting out of the consolidation that followed the correction of this bullish wave.
Only now Cardano is breaking a sideways channel and still trades below its December 2024 peak. Bitcoin is trading at a new all-time high and is preparing for a major move above $130,000. XRP is trading at a new all-time high and is not dropping. Ethereum is very close to a new all-time high and will certainly continue to grow, only days away. Cardano still has to break its March 2025 high, its December 2024 high; this is not bad, it only means that is still early for this amazing pair.
A bullish advance started 8-July and lasted only 13 days. We are seeing a small retrace now, three days with only one day red. Cardano will recover and continue growing. This growth will not be exhausted in a matter of weeks, it will go for months. Cardano has to grow straight up, daily, weekly, for a prolonged period of time to move beyond $4. But $4 is not the top, $7 and $8 are also possible.
The reason why the action might seen slow, is because this is only the start. Give it time, the market is giving us an opportunity to join. The market is giving everybody the opportunity to buy Cardano while prices are still low. You know how Crypto operates. When it starts moving, it goes so strong and so fast that there is no time to react. Act now and you will reap the reward.
The bullish cycle is confirmed. Just look around, what do you see?
Our sisters and cousins are rising. Our young children are growing; Crypto is going up.
Cardano is one of the main projects in this market and it will not stay behind. You will not be disappointed, you will be happy with the results.
Namaste.
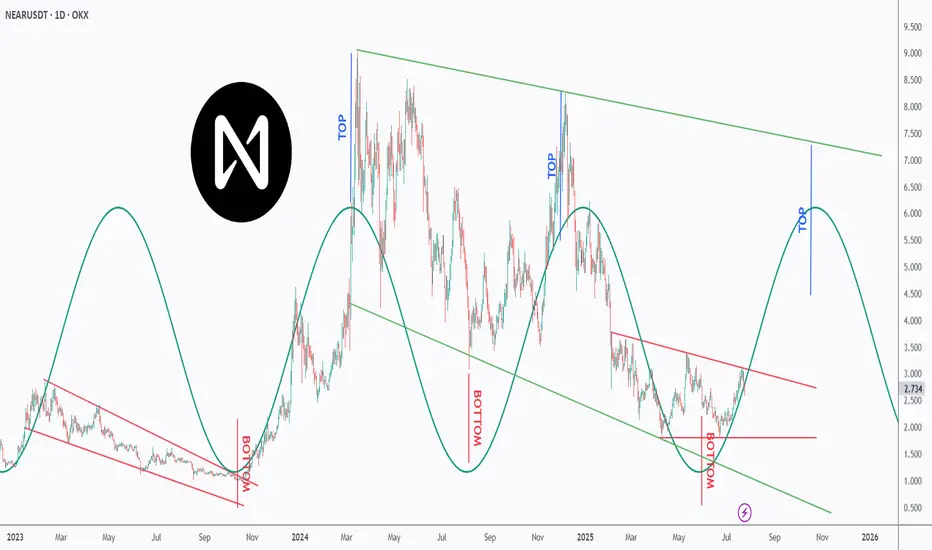
Is NEAR NEARing Its Next Explosion? Watch This Perfect Pattern!NEAR is dancing to a powerful rhythm — and it’s all in the cycles 🔁
This chart uncovers a repeating top-bottom cycle that has held since early 2023, with precise peaks and valleys emerging every few months 📉📈.
After bouncing off a major bottom at ~$2, NEAR is now approaching the mid-line of the descending red channel, suggesting a potential trend reversal is underway 🔄.
Each previous “BOTTOM” aligned with strong recovery waves 🚀, while the projected “TOP” now points toward the $6–7 zone — aligning perfectly with the upper green trendline resistance 🎯.
If the pattern continues, we could be looking at another macro push before year-end 2025 📆.
📊 Will NEAR ride this wave to new local highs — or is it just another lower high in the making? Either way, the rhythm of this chart is too clean to ignore.
📚 Always follow your trading plan regarding entry, risk management, and trade management.
Good luck!
All Strategies Are Good; If Managed Properly!
~Richard Nasr
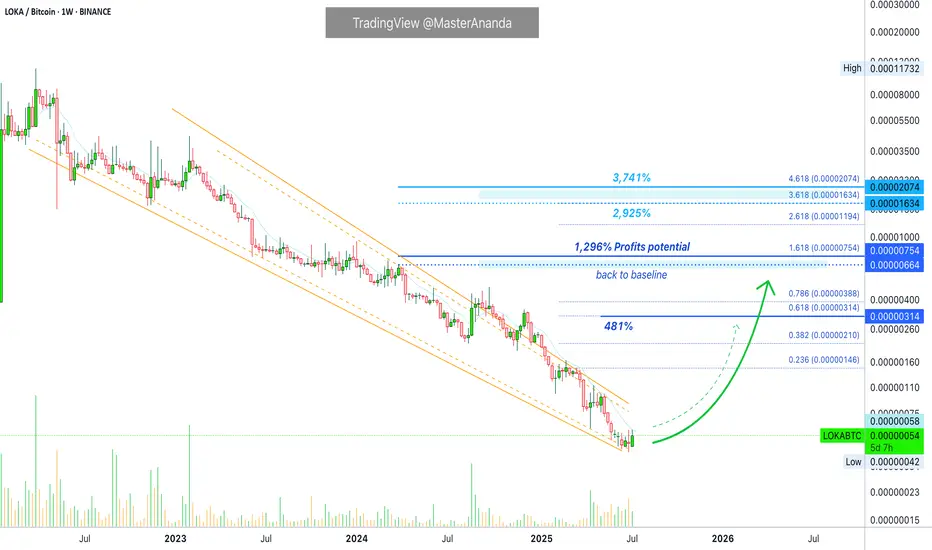
League of Kingdoms · Back to Baseline 1,300% Profits TargetLeague of Kingdoms has been dropping since March 2022 vs Bitcoin, LOKABTC. A more than 3 years strong downtrend. The chart is telling me that this downtrend is coming to an end. We have a volume signal, together with price and marketwide action.
Growth potential is huge, it goes beyond 3,700%. For this chart setup, we are going to be focusing only on the "baseline." That is, 1,296% profits potential. This is an easy target.
To get a better picture of this chart you can always disable the log. scale and you will get a better view of reality. LOKABTC is trading at true bottom prices. Once the bottom is in, a reversal can happen any day. The reversal can lead to long-term growth. It will be the first bull market for this pair.
We do not use leverage on this type of setup, very low risk. The strategy is simply to buy and hold. Accumulate long-term as much as you can and want.
Make sure to do your own planning before trading. Market conditions can always change.
Thank you for reading.
Namaste.
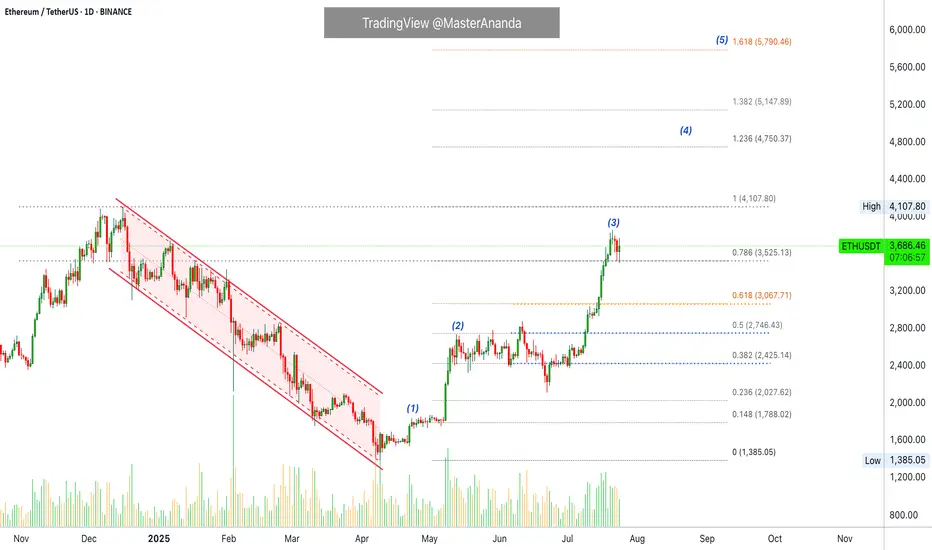
Why Ethereum Will Continue Growing · Trading Above ResistanceEthereum started its latest bullish on the 9th of April. Each advance has been preceded by a period of consolidation.
ETHUSDT (Ether) recovered from its bottom range 23-April, immediately it went sideways for 14 days before moving forward (1). As soon as Ethereum reached $2,700, we have the same pattern but extended, more sideways before moving forward. See this as (2) on the chart. This time the consolidation period lasted 57 days.
The last advance was even stronger (3), Ethereum peaked at $3,860 and we can expect another sideways period, a pause, repeating the same pattern as before. Now, there is an interesting part. The first is a prediction: This consolidation period wont be as long as the second one. The second is related to resistance and support. Notice how ETHUSDT peaked above 0.786 Fib. and this level is being tested as support. The fact that bullish action managed to conquer this level and stop above it, not below, favors the bulls. This means that the market is strong and set to continue growing. There is no significant bearish volume on the red days and the action is neutral so we can expect an advance; the next high will be a new all-time high. We will name it (4) on the chart.
This price pattern should repeat giving us additional growth. After a new all-time high, there will be resistance shy of 6K. And then we expect higher prices with Ethereum peaking around $8,500. Depending on how this level is handled, we can look for $10,000 or even $11,000.
Right now the chart is bullish and points higher.
Continue to hold long-term. It is still too early to fold; it is too early to sell. We are going higher.
Thank you for reading.
Namaste.

Bitcoin Bullish Structure Holds: Focus on Support Entries & Brea__________________________________________________________________________________
Technical Overview – Summary Points
__________________________________________________________________________________
Momentum: Uptrend synchronization on all timeframes (MTFTI Strong Up). Risk On / Risk Off Indicator: strong buy on larger TF, neutral intraday.
Supports/resistances: Main HTF supports well below current price (115,736–117,000, 111,980). Key resistances to break: 120,998.7 and 122,318.
Volumes: Normal to moderate, no climax, no distribution detected.
Multi-TF behaviour: No behavioural excess, no sell signal, intraday phases are consolidative just below resistance, which is normal.
__________________________________________________________________________________
Strategic Summary
__________________________________________________________________________________
Overall bias: Strong bullish, no end-of-trend alert. Buying retracement towards the Pivot Lows is preferred.
Opportunities: Entries on dips to 115,700–117,000 (2H/4H); breakout above 120,250/122,300.
Risk zones: Return below 115,700 or 111,980 = structural alert. Increased vigilance for macro releases (ECB/PMI/Jobless Claims).
Macro drivers: Fed in focus (no move expected), volatility risk around July 29–30 (FOMC).
Action plan: Entry on retracement, dynamic management. Stop-loss under 115,736 then 111,980. Partial exits on excess or confirmed breakout.
__________________________________________________________________________________
Multi-Timeframe Analysis
__________________________________________________________________________________
1D: Resistances 122,318, 120,998.7; supports 115,736.9, 105,100.2. Risk On / Risk Off Indicator: strong buy, all synchronized bullish, no exhaustion. Daily bias: robust uptrend.
12H/6H/4H: Bullish confluence. Strong momentum, stable volume, validated supports. No ISPD excess, sectoral strength intact.
2H/1H: Consolidation below resistance; healthy structure. Supports to be favored for swing/intraday positioning. Minor intraday hesitation, no reversal.
30min/15min: Behavioural neutrality, lateral movement. Volume normal to mildly elevated, no overheating. Structural risk absent.
Additional indicators:
Risk On / Risk Off Indicator: Strong buy up to 2H; neutral on short TF.
ISPD DIV: Neutral, healthy market, no excess detected.
Volume: No climax or distribution, multi-TF structural support.
Cross-timeframe synthesis: Multi-timeframe bullish alignment, no structural weakness. Opportunities on retracement, breakout plays above all-time highs.
__________________________________________________________________________________
Synthesis & Strategic Bias
__________________________________________________________________________________
BTC trend and momentum remain aligned, sector leadership (Risk On / Risk Off Indicator) intact.
Strong HTF support, major resistances must break for extension.
External risk: macroeconomic catalysts (Fed, ECB, US PMI).
Premium opportunities on dips to supports, dynamic management essential around macro events.
Final bias: as long as supports and indicator alignment hold, bull run continues. Partial exit at resistance; stops below validated pivots.

ETH 1H — Decision Point Ahead
ETH just confirmed a bullish RSI divergence, with price finding support at the 200MA.
MACD supports the move, and the trend structure is clean: MLR > SMA > BB Center.
Now, price is hovering at the 0.236 Fib level.
A few strong closes above it could open the door for more upside.
If rejected, we might revisit the 200MA for another test.
Either way — we’ll find out soon.
Always take profits and manage risk.
Interaction is welcome.

Bitcoin is testing the triangle ┆ HolderStatBINANCE:BTCUSDT is ranging $132K–$137K in a triangle pattern. Breakout above $137K may target $143K. Decision point near.
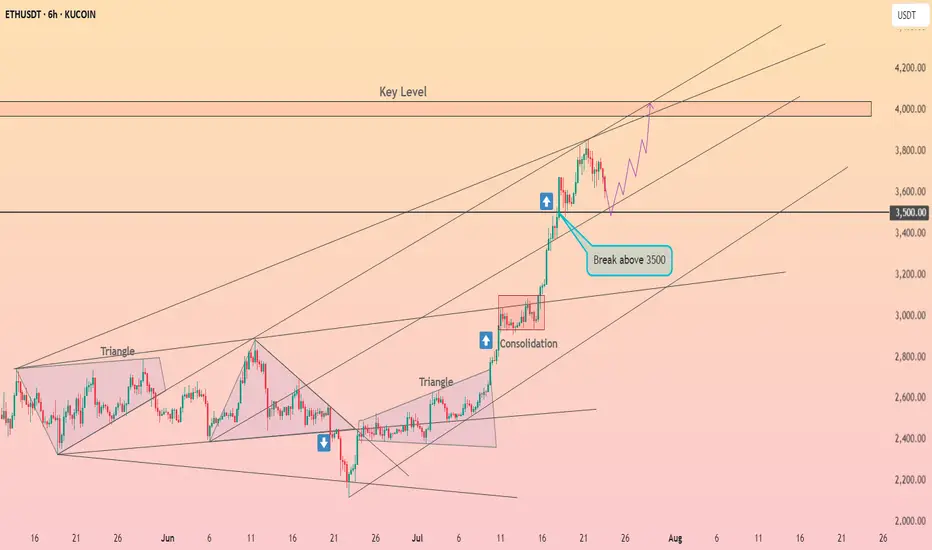
Ethereum will retest $3,500 ┆ HolderStatOKX:ETHUSDT bounced from $2,875 and is approaching $3,100. Breakout may target $3,250 next. Bullish structure remains.
XRP is heading toward $4 ┆ HolderStatBYBIT:XRPUSDT is testing $3.40 for the third time. A breakout targets $3.60, but rejection risks $3.10 fallback.
Solana is preparing to breakthrough $200 ┆ HolderStatOKX:SOLUSDT is trapped between $172 and $180. Break above $180 may unlock $188+. Watch for volume breakout.

ETH Dominance – Golden Cross, New Era?This is ETH Dominance on the Daily chart.
A golden cross just printed, and the last time we saw this, at similar levels, was February 2020. Back then, dominance climbed steadily, bouncing off the 200MA repeatedly.
Today, price is approaching the 0.236 Fib level, which could act as short-term resistance and send us back to retest the 200MA as support.
But unlike 2020, everything has changed:
– ETH is getting institutional support via ETF flows
– The SEC confirmed ETH is not a security
– The RWA narrative is gaining serious traction
That’s why this golden cross could mean more than just a signal, it may be the start of a much stronger structural uptrend.
My humble guess?
ETH Dominance continues climbing with the 200MA as support.
It won’t be a smooth ride, but the direction might be set.
Always take profits and manage risk.
Interaction is welcome.
