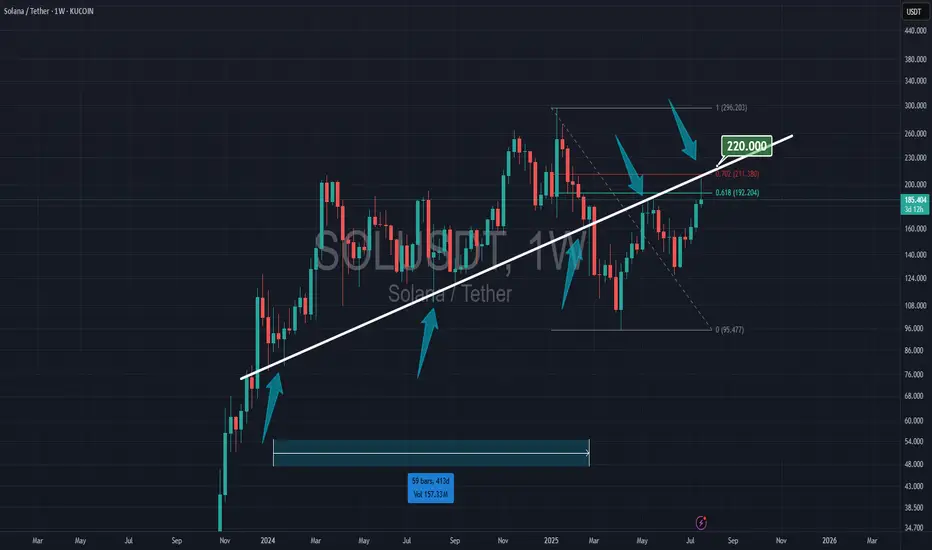
SOLANA & 220 RESISTANCESolana is at 61% of Fibonacci, and the trendline has held since early 2024. To stay in the bull run, Solana must break the 220 resistance.
Crypto
What’s Next? 🚨 $FARTCOIN Cup & Handle Pattern Forming – What’s Next? 📈
$FARTCOIN has formed a bullish Cup & Handle pattern — but is it over?
❌ Not yet. $FARTCOIN hasn’t shown any strong bearish signals for now.
🔍 We’re watching two key green line levels below.
📉 If the price drops toward these zones, we may see buyers step back in — creating a potential entry, but only with confirmation.
✅ Stay patient — no rush to jump in without a setup. Let the chart guide us.

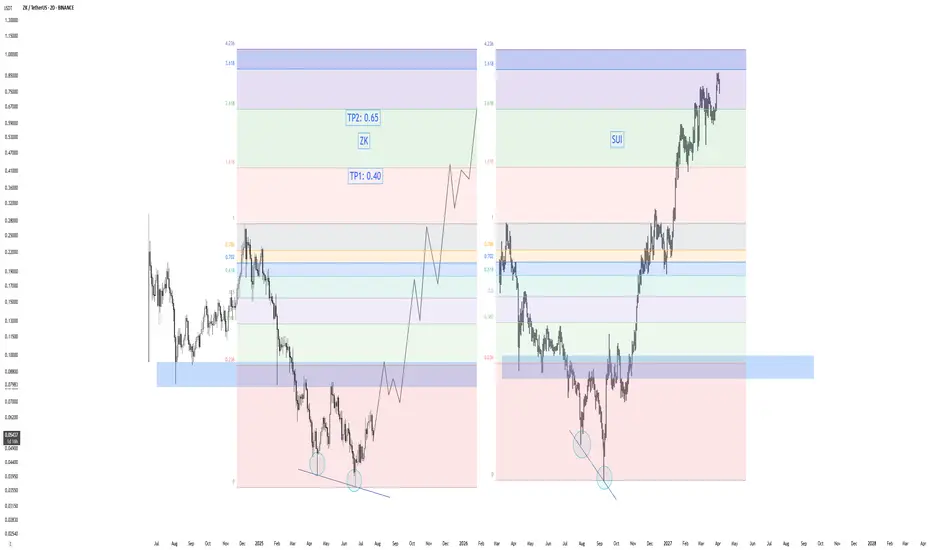
ZK - Golden opportunity? 0.40? Hello everyone, here’s my new analysis on ZK.
Recently, the price surged nearly 80%, followed by an 18% pullback over the last two days. From its all-time high, ZK is currently down about 80%, which in my opinion presents a golden opportunity.
Based on my research, the peaks of altseasons often occur between December–January or April–May. After analyzing the Others Market Cap dominance chart, I believe we’re setting up for a strong altseason in the next 5 months. Over the last few years, BTC has significantly outperformed altcoins—but recently, I’ve noticed a major shift in market dynamics, indicating that capital might be rotating back into alts.
On the chart, ZK is showing a classic crypto crash-recovery pattern. For example, SUI dropped around 80–85% before rallying over 1000% in just 4 months. I see a strong structural similarity between the bottoming pattern of SUI and the current structure of ZK.
If ZK breaks the resistance zone at 0.080–0.095, I expect a rapid move up toward 0.22–0.26. After that, a healthy correction around the previous ATH would be expected—before potentially heading to 0.40 as Take Profit 1 (TP1).
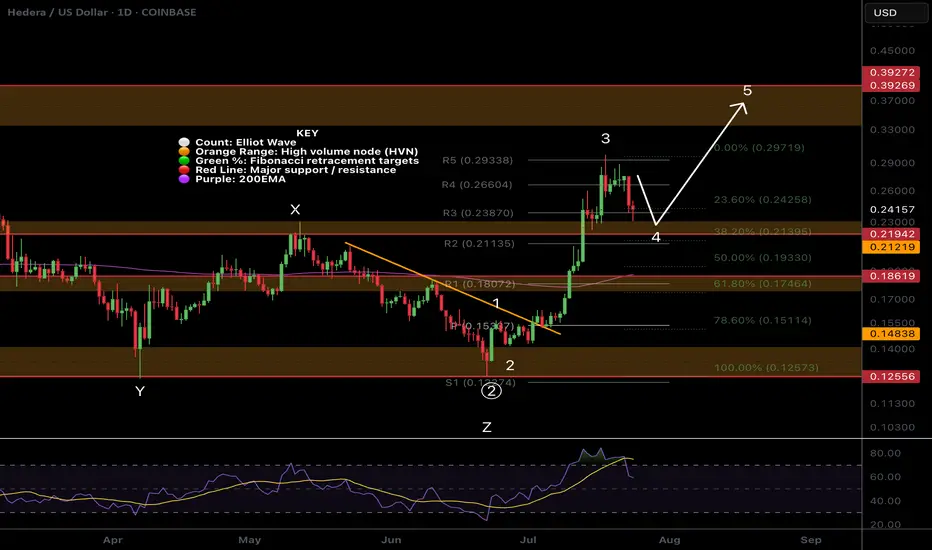
$HBAR Wave 4 finishing soon?CRYPTOCAP:HBAR Hedera appears to have completed wave 4 with the test of the High Volume Node support at the 0.382 Fibonacci retracement.
Wave 5 has an expected target of the High Volume Node resistance at $0.4 before a larger retracement in wave 2 aligning with my summer pump august / September dump view.
Analysis is invalidated below $0.1933 at the 0.5 Fib retracement and will be updated to a wave 2 instead of 4.
Safe trading
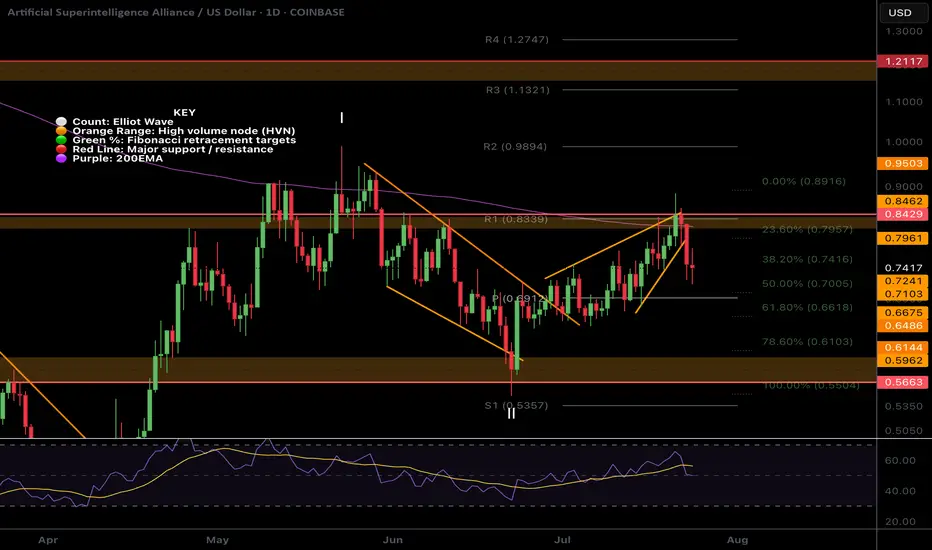
$FET local ending Diagonal and wave 2 near completion?NYSE:FET was rejected for the 4th time at the daily 200EMA! Each time the probability of a breakout increases.
I have adjusted the High Volume Nodes for accuracy.
Locally Fetch appears to have completed a motif wave up with an ending diagonal for wave 5. Wave 2 is expected to find support at the daily pivot and .618 Fibonacci retracement before attempting a breakout of the daily 200EMA once more.
A move below wave II will invalidate this analysis.
Safe trading
$ETH Hit Our Targets and was rejectedCRYPTOCAP:ETH hit our signal take profit target at $3820 and was rejected at the High Volume Node EQ to the penny.
That appears to have completed wave 3 of this motif wave. Wave 4 has an expected target of the R2 daily pivot and 0.236-0.382 Fibonacci retracement, $3260 before continuing to the upside in wave 5 with a target of the all time high.
This aligns with my views of a significant pullback at the end of August and September which is typical after a summer rally.
No divergences yet in daily RSI.
Safe trading

Ethereum is Trending HigherSince April trough, Ethereum has risen by 179%, delivering a higher rate of return than Bitcoin at 66%. But most of our attention is on Bitcoin, breaking above the 120,000 level.
Why is Ethereum quietly gaining ground —and what does the future hold for Ethereum?
Mirco Bitcoin Futures and Options
Ticker: MET
Minimum fluctuation:
$0.50 per ether = $0.05 per contract
Disclaimer:
• What presented here is not a recommendation, please consult your licensed broker.
• Our mission is to create lateral thinking skills for every investor and trader, knowing when to take a calculated risk with market uncertainty and a bolder risk when opportunity arises.
CME Real-time Market Data help identify trading set-ups in real-time and express my market views. If you have futures in your trading portfolio, you can check out on CME Group data plans available that suit your trading needs tradingview.sweetlogin.com

The Edge Of The Fork - The Joker In Your PocketWOW!
\ \ First of all, I want to say THANK YOU for all the boosts, follows, and comments. You guys & gals give me the energy to continue this journey with you.\ \
Today, I want to show you that what we’ve learned with horizontal lines can also be applied to "Medianlines," or Forks.
Listen, I don’t want you to blow your brain with all the rules.
Not at the beginning of this journey, and not later on either.
Don’t ask yourself:
* when to use which Fork
* which swing to measure
* when to trade
* where to set your stop
* what if... bla bla bla
That’s not fun — that’s stress.
I don’t like stress — nobody does.
So let’s just chill and have fun here.
That’s my personal reason for doing all this Trading thing. I want to have fun — the money will take care of itself, just like the destination of a trail takes care of itself, as long as I keep putting one foot in front of the other. And that’s simple, right?
So let’s do it exactly the same way.
Just simple steps, connecting some dots, and BAM! — You’re there before you even know it §8-)
\ Let’s jump to the chart:\
Today, you’ll find out why Medianlines/Forks are a cousin of the horizontal Channel — but NOT the same.
Where are they different?
Forks are different because they’re capable of projecting the most probable path of price. And that’s a HUGE difference.
Yes, you can apply the full rule set of Forks to a horizontal Channel.
But the Channel CANNOT project the most probable path of price.
I hear you, I hear you: "No one and nothing can foresee the future. How is it even possible that Forks can?"
\ Here’s why:\
There’s a thing called "Statistical Importance." And it means that if something happens very often in the same way, we have a higher chance of seeing the same behavior again in the future.
And that’s what the inventor, Allan Andrews, discovered — and he created the rules around his findings.
\ A high probability that price will move in the direction of the projected path, as long as it stays within the boundaries of the Medianlines/Fork.\
That’s the whole "magic" behind Medianlines/Forks.
And the same applies to the "Behavior of Price" within and around Medianlines. That’s really all there is to it.
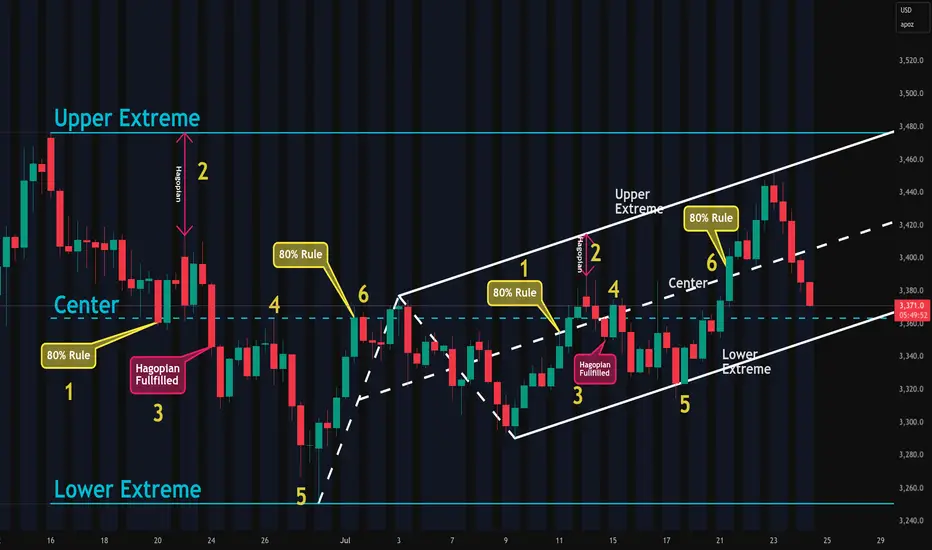
Look at the chart and compare the Channel and the Fork:
1. Price reaches the Centerline about 80% of the time
2. HAGOPIAN → price goes farther in the opposite direction than where it came from
3. HAGOPIAN’s rule fulfilled
4. Price reaches the Centerline again
5. Price reaches the other extreme
6. Price reaches the Centerline about 80% of the time
You’ll see the same behavior inside the Fork!
That’s beautiful, isn’t it? §8-)
And here’s a little Joker in your pocket — if you know the difference between the Channel and the Forks!
Do you know what it is?
Yep! You’d automatically know the direction to trade — giving you another 10% edge right out of the box — LONG TRADES ONLY. Because the Fork projects the most probable path of price to the upside, not down.
That's all folks §8-)
Like this lesson?
With a simple boost and/or a little comment, you load my Battery so I can continue my next step on the trail with you.
Thank you for spending your time with me §8-)
LOOKS CAN ENTER LONG TERM CYCLE AFTER THISLooks seems to make an important trend, which can allow this coin to enter a cycle area.
On the low time frame, it shows breakdown. The main view is that this coin is positive.
$0,035 is an important cycle target, which can be done with time depending on the last confirmations.

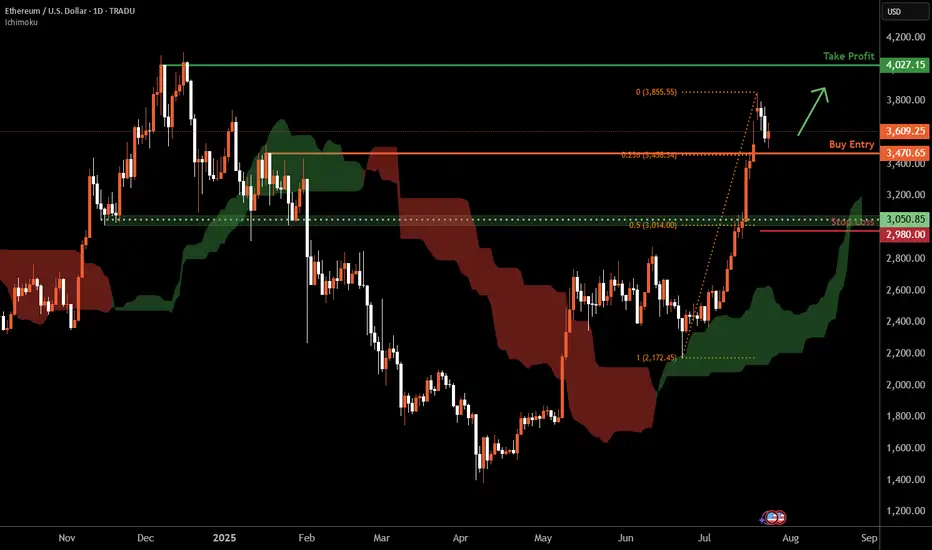
Ethereum D1 | Bullish uptrend to extend higher?Ethereum (ETH/USD) is falling towards a pullback support and could potentially bounce off this level to climb higher.
Buy entry is at 3,470.65 which is a pullback support that aligns with the 23.6% Fibonacci retracement.
Stop loss is at 2,980.00 which is a level that lies underneath a pullback support and the 50% Fibonacci retracement.
Take profit is at 4,027.15 which is a multi-swing-high resistance.
High Risk Investment Warning
Trading Forex/CFDs on margin carries a high level of risk and may not be suitable for all investors. Leverage can work against you.
Stratos Markets Limited (tradu.com ):
CFDs are complex instruments and come with a high risk of losing money rapidly due to leverage. 66% of retail investor accounts lose money when trading CFDs with this provider. You should consider whether you understand how CFDs work and whether you can afford to take the high risk of losing your money.
Stratos Europe Ltd (tradu.com ):
CFDs are complex instruments and come with a high risk of losing money rapidly due to leverage. 66% of retail investor accounts lose money when trading CFDs with this provider. You should consider whether you understand how CFDs work and whether you can afford to take the high risk of losing your money.
Stratos Global LLC (tradu.com ):
Losses can exceed deposits.
Please be advised that the information presented on TradingView is provided to Tradu (‘Company’, ‘we’) by a third-party provider (‘TFA Global Pte Ltd’). Please be reminded that you are solely responsible for the trading decisions on your account. There is a very high degree of risk involved in trading. Any information and/or content is intended entirely for research, educational and informational purposes only and does not constitute investment or consultation advice or investment strategy. The information is not tailored to the investment needs of any specific person and therefore does not involve a consideration of any of the investment objectives, financial situation or needs of any viewer that may receive it. Kindly also note that past performance is not a reliable indicator of future results. Actual results may differ materially from those anticipated in forward-looking or past performance statements. We assume no liability as to the accuracy or completeness of any of the information and/or content provided herein and the Company cannot be held responsible for any omission, mistake nor for any loss or damage including without limitation to any loss of profit which may arise from reliance on any information supplied by TFA Global Pte Ltd.
The speaker(s) is neither an employee, agent nor representative of Tradu and is therefore acting independently. The opinions given are their own, constitute general market commentary, and do not constitute the opinion or advice of Tradu or any form of personal or investment advice. Tradu neither endorses nor guarantees offerings of third-party speakers, nor is Tradu responsible for the content, veracity or opinions of third-party speakers, presenters or participants.
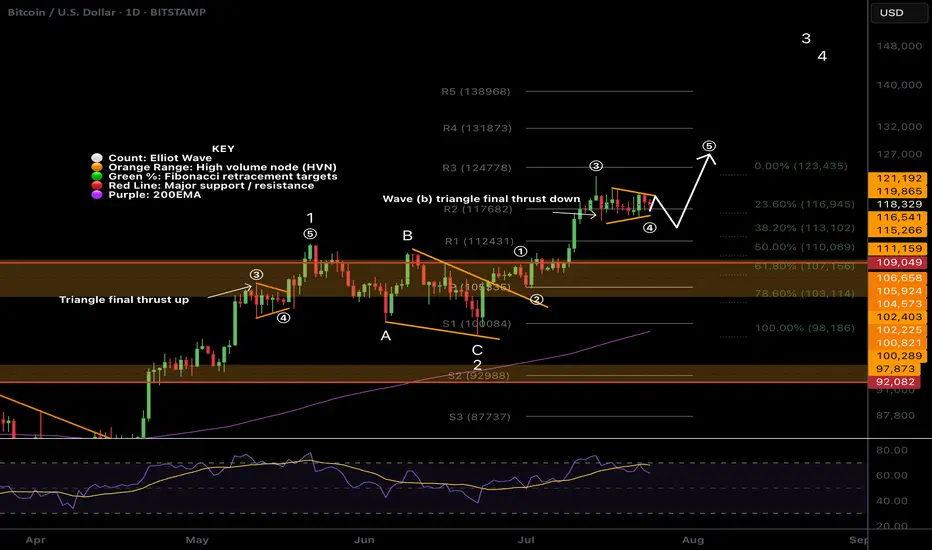
$BTC Wave (b) triangle?CRYPTOCAP:BTC Bitcoin appears to have competed wave 3 up, wave (a) down and now finishing a triangle in wave (b) which would result in a thrust down to around $113k before continuing to the upside in wave (5).
There is slight bullish divergence on daily RSI and wave (4) meets the Fibonacci retracement rules of between 0.236 - 0.382 adding confluence.
Previous all time high is expected to be tested as support on a larger correction, perhaps when the ascending daily 200EMA creeps up to the same level after we blow off.
Safe trading
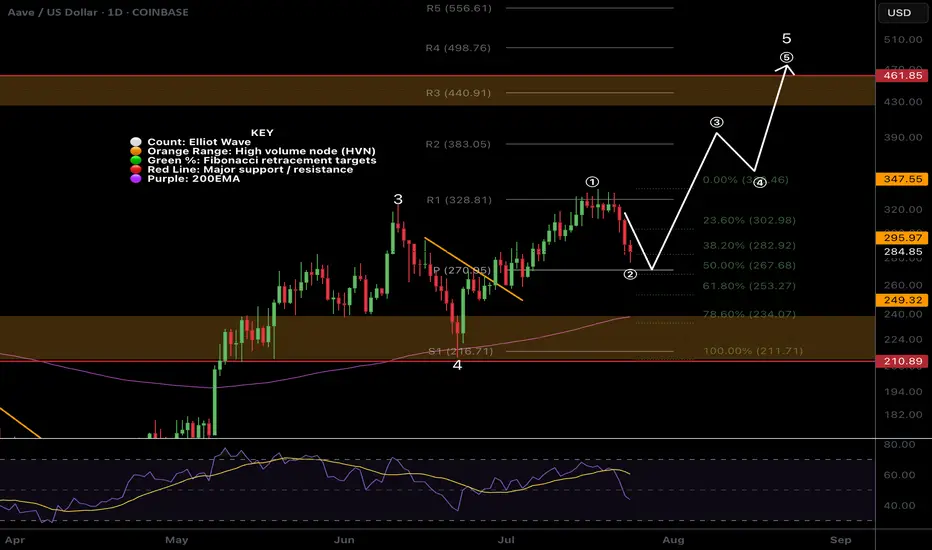
$AAVE Daily Hidden Bullish divergence?CRYPTOCAP:AAVE and alts begin their retracement Wednesday but is this a long term top or just local? Im betting we have a higher to go this summer..
Hidden daily bullish divergence is printing on RSI at the daily pivot and 0.5 Fibonacci retracement which should all act as strong support provided BTC doesn't dump.
The 'alt-coin golden pocket' Fibonacci retracement 0.786 sits at the descending daily 200EMA and High Volume Node support offering a secondary target for reversal and continued upside.
Losing this and closing below would flip me bearish until a new bullish signal emerges.
Safe trading.
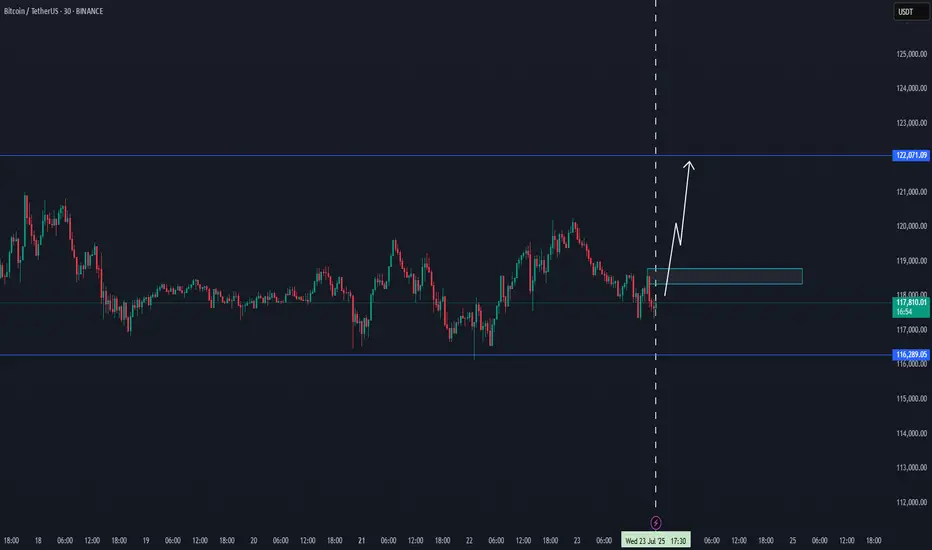
BTC NEW VOLUME TREND 122KThis is a small time frame update, where BTC can try to target 22K again in the coming time frames. Since the last 15H breakdown volume, BTC can enter new uptrend volume
From the box level, there is a good chance for a new uptrend.
LOOKS/USDT NEW INCREASE VOLUMELooks seems to have trending on a low time frame new increase trending, following to see if this coin is able to get confirmed in the next hours.

Solana's Bearish 5-0 is Locking in a Bearish Reversal to $26.40Solana has recently run up to Horizontal Resistance Zone of $195-$210 aligning with the PCZ of a Bearish 5-0 and has begun to impulse downwards with volume to back it. This could be the start of a greater move down that would take SOL back to the low of the distributive range at $95.16. If the level breaks, we would then target a drop down to the $40.72-$26.40 confluence area aligning with the all-time 0.886 retrace as well as the 1.618 extension from previous swing low to high. Only at these levels could we even possibly begin to consider Bullish Entries on Solana.

Bitcoin · $137,000 Next Target Followed by $155,000There won't be a correction for Bitcoin. Not now, not yet. The reasons why I already explained in several earlier publications that predicted the current scenario. The bullish breakout that is from the long-term consolidation range. That's the reason, that's the reason why Bitcoin will not go lower without first going higher.
Since Bitcoin consolidated for 7 months below $110,000, it will continue climbing until it reaches higher.
The next target is $137,000. At this point a correction can develop and if it does, we don't expect this correction to last long. The correction can be strong, deep, surprising, but it cannot be long in duration. That is because Bitcoin is headed toward $155,000 and that's the main level for this bullish wave. Until this target is achieved, nothing can stop the future of finance, Bitcoin is moving ahead.
The proof is in the altcoins market. "The altcoins follow Bitcoin." In the current situation, Bitcoin is consolidating while the altcoins grow. If Bitcoin were to crash, the altcoins wouldn't move one dollar higher. In fact, they would be crashing even stronger and faster.
Bitcoin would need to just falter for one day for the altcoins to crash to new lows. What is happening now? Bitcoin can shake; Bitcoin drops; Bitcoin consolidates, and the altcoins continue to grow. That's the proof that the next main—major—move is an advance for Bitcoin. Never SHORT Bitcoin when the market is bullish and strong.
Bitcoin is a growing phenomenon, it is very young. Just think of the US Dollar or Gold. How old are these instruments? How old are market securities and stocks? Some corporations are hundreds of years old. Countries? Thousands of years and still living... Bitcoin can have a life span of 80 years, 140 years, 200 years, 500... who knows. It is a question market. But there is no doubt that it is young. When you are young, you cannot stop your own growth. Bitcoin is already growing and will continue to do so. I will not be surprised when I see Bitcoin trading at $1,000,000+. It might take several years, but several years back Bitcoin was trading at $5k. What's the price now?
$120,000. Trading near resistance is bullish. No corrections. No drops. No retrace.
Thank you for reading.
Namaste.

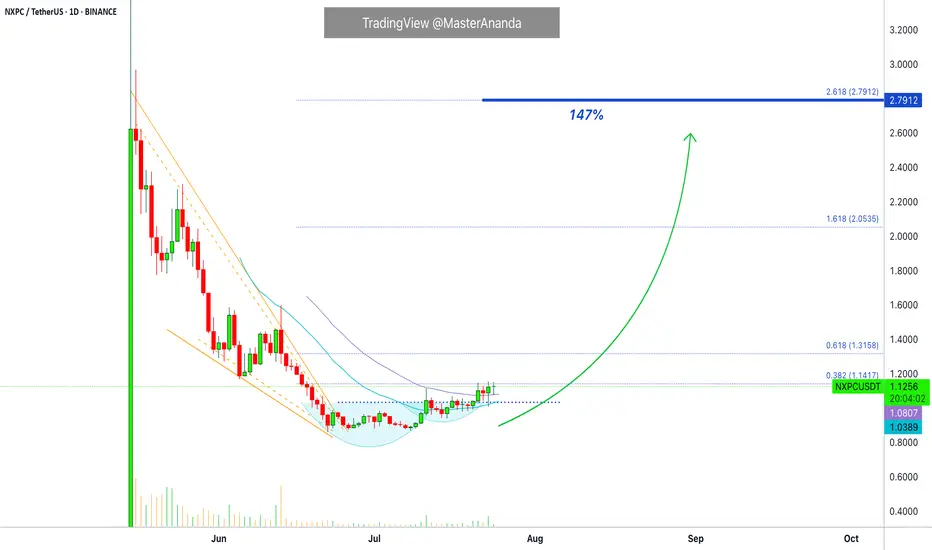
Nexpace Trades At Bottom Prices but Bullish · Easy 147%Here is another trading pair that is trading low and will produce nice growth (profits) in the coming weeks and days. Nexpace (NXPCUSDT).
This one is better than some of the others because it has lower risk. The risk is lower because the action is happening out of the bottom range but prices are still very low. Low prices but with an early bullish bias developing.
NXPC is trading daily above EMA21 and 34 but not EMA55, which means that it is still early. It confirms what I just said above.
Since the entire altcoins market is bullish and rising, Nexpace will also grow. This is an easy short-term trade setup. You can expect to double-up within 15-30 days. Can happen sooner but it can also take a while longer. Be prepared to wait.
Namaste.
MOCA/USDT NEW VOLUME RANGEMOCA/usdt starting with new volume range, which can get confirmed in the next hours.
our follow will here for this coin to see new confirmations.

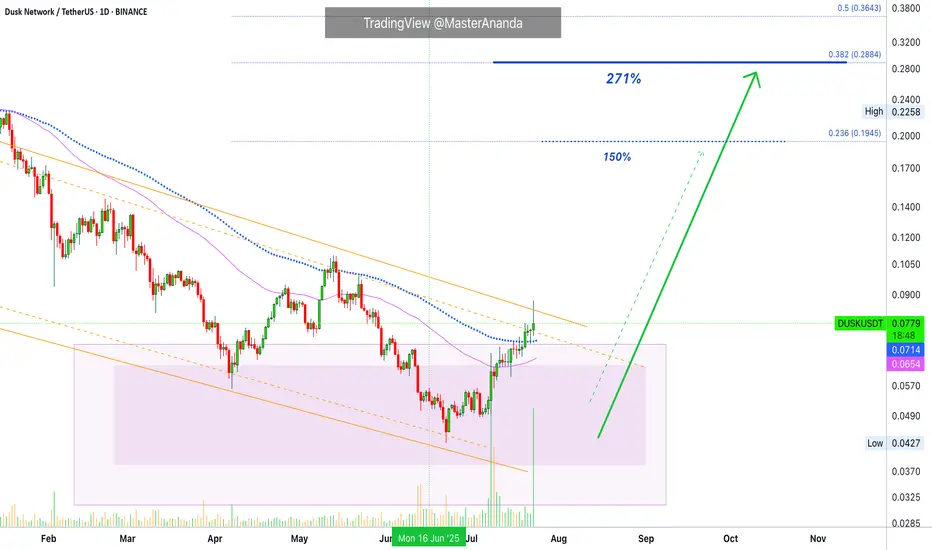
Dusk Network Instant 150% · More Possible · Trading ExplainedThis is a complete setup, I shall explain. Trading long-term vs trading short-term and technical analysis.
We are looking at Dusk Network (DUSKUSDT) on the daily timeframe. You know how I always look for the bottom and trend reversal for all major pairs for long-term trade-numbers; but, when focusing on the short-term you want a fully confirmed setup rather than the perfect bottom. Why?
The perfect bottom can lead to months and months of consolidation before a bullish breakout. A fully confirmed chart setup leads to instant growth.
Here DUSKUSDT has really high volume above EMA89. Full green candles and pushing higher. Already rising, you can see how the bullish bias is only intensifying. This type of setup can produce the much sought after sudden 100% jump. Once this happens, collect profits and move on.
So, long-term, buy and hold. Keep waiting until the cycle top.
Short-term, get in and get out.
Namaste.
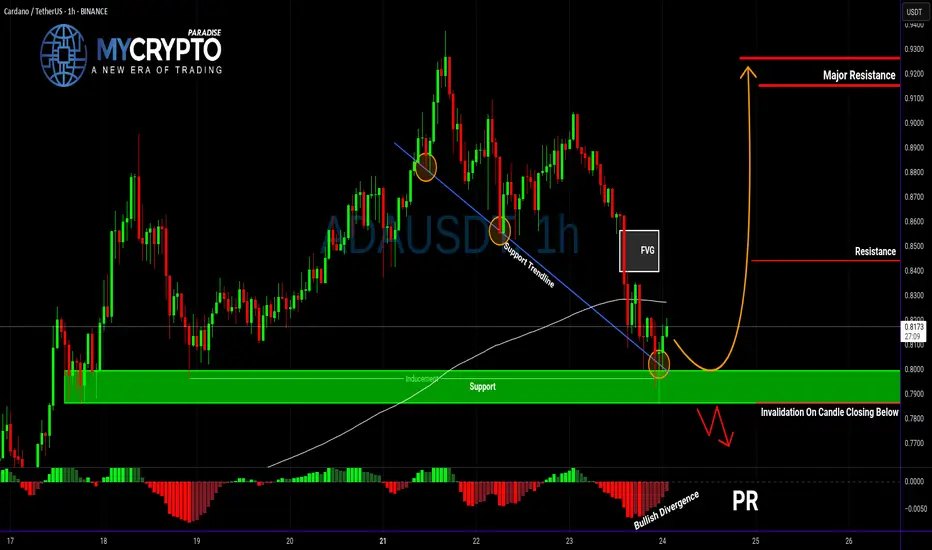
ADA About to Explode or Collapse?Yello Paradisers — is ADA gearing up for a breakout, or are we walking straight into a bull trap? After the recent pullback, the market is throwing mixed signals, but this setup is becoming too important to ignore. Here’s what we’re seeing right now on ADAUSDT.
💎ADA is currently showing positive signs of strength after a solid retracement. Current support zone is not only a historical price pivot, but it's also aligned with a supportive trendline, the 200 EMA, and a developing bullish divergence on the chart. All these factors combined are increasing the probability of a short-term bounce — but that doesn't mean we go in blind.
💎For aggressive traders, entering at the current price might make sense, especially if you’re targeting the first resistance level. However, it’s important to note that this entry offers a relatively limited reward compared to the risk — roughly a 1:1 risk-reward ratio — so it’s crucial to size your position accordingly and keep tight control over your stop loss.
💎If you're looking for a cleaner setup with a better risk-to-reward profile, patience is key. A more favorable scenario would be waiting for a proper pullback and a confirmed retest of the support zone. Ideally, you want to see a strong bullish candle at the support level to signal continuation — that’s when the setup shifts from average to high-probability.
💎But be cautious. If the price breaks down and closes a candle below our support zone, the entire bullish idea becomes invalid. In that case, it’s much wiser to step back and allow the market to develop more structure before re-engaging. Forcing trades in uncertain conditions is where most traders lose, and we don’t want to be part of that crowd.
🎖Strive for consistency, not quick profits. Treat the market as a businessman, not as a gambler. Be patient, Paradisers — only those who follow structured strategies and risk management will thrive in the long run.
MyCryptoParadise
iFeel the success🌴
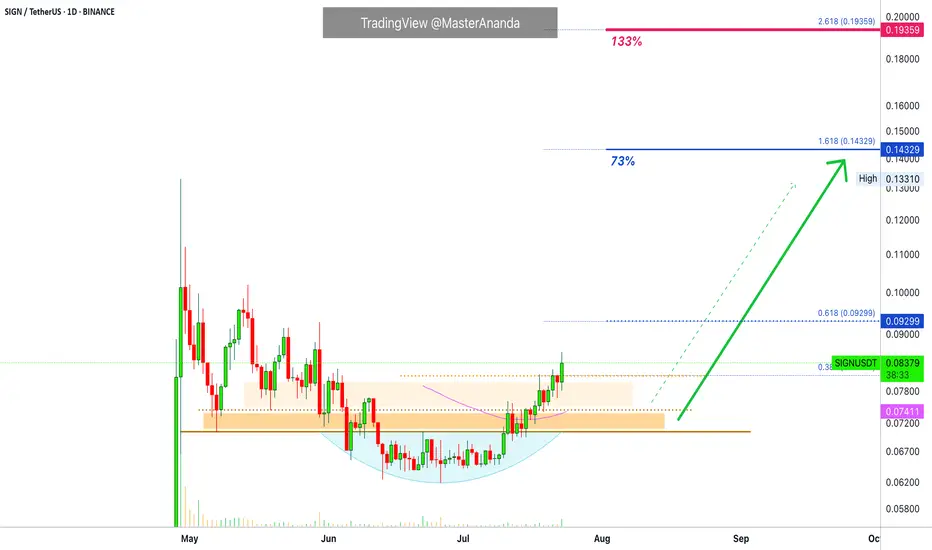
Sign · Same Chart, Same Pattern, Easy Profits · 133% PotentialThe same chart, the same dynamics and the same highly profitable easy to win trading opportunity.
The main low happens 7-May. There are lower prices after this but this is the stop-loss hunt event. We know this based on the rounded bottom pattern.
SIGNUSDT is back above its 7-May low and also trading above EMA55 on a daily basis. Above EMA55 after hitting a major low is as bullish as it gets. On top of that, we can see slow and steady growth; remember, the build-up process that leads to a strong bullish wave.
Notice how each candle, each day, prices are climbing higher and higher. The strongest signal of all is price action. When prices are rising, that is all you need. Supported by a volume breakout and we have another chart setup that will produce profits short-term.
The exchange I am looking at allows up to 5X, but you can do spot; less risk and no stress. If something goes wrong, the worst case scenario is a long wait or a small loss. On the other hand, a mistake with leverage can mean losing your entire position. Which one do you prefer?
There is no right or wrong answer. Higher risk will translate into a higher potential for reward. A lower reward potential translates into less stress and less risk. Whatever you choose is up to you. It all depends on your personality, your capital, your trading style, the available tools and your goals.
I say, start small. If you can secure many small wins, eventually you will be able to handle the big ones. Only go big when you have experience securing the small trades.
If you are in a hurry to win big, then you might end up losing everything; over and over, again and again.
Avoid repeating the same mistakes. Learn from the Master.
Thanks a lot for your continued support.
Namaste.
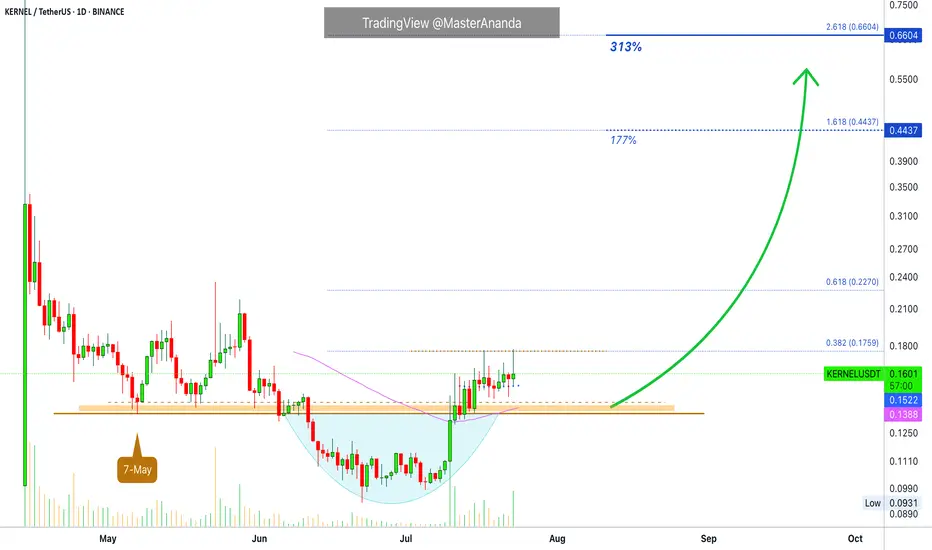
KernelDAO Short-Term Trade Setup · 300% Profits PotentialThis is another strong chart setup. I am looking at the short-term because that is the request I am getting from many of my followers. People are interested now in growing their capital so this can be used to accumulate strong reputable projects later on. Something like double-up, triple-up then grow some more. When enough cash is available; sit back, relax and hold.
The main low here is 7-May. The break below support is the liquidity-hunt event.
After the action recovers above support, bullish confirmed.
Notice KERNELUSDT trading above EMA55 and EMA89 daily.
Trading volume also favors the bullish side. Notice how red days have very low volume. On green days we have the higher numbers of volume spikes. High volume when buying, low volume when selling.
The first target is good and strong for 177%. The second target goes to 300%. This can be achieved easily within 1 month (short-term), or it can extend to two months but not much longer. The trick is to be ready to wait.
If you expect the market to move within hours or days, you might be disappointed. Yes, sometimes it moves fast but this is the exception and not the norm. Better to be prepared to wait a long time and if it moves faster, that's a bonus but we have to be realistic to produce consistent wins. If you want to be in the action, diversification is a good strategy. If you just want to win, patience is key.
Namaste.
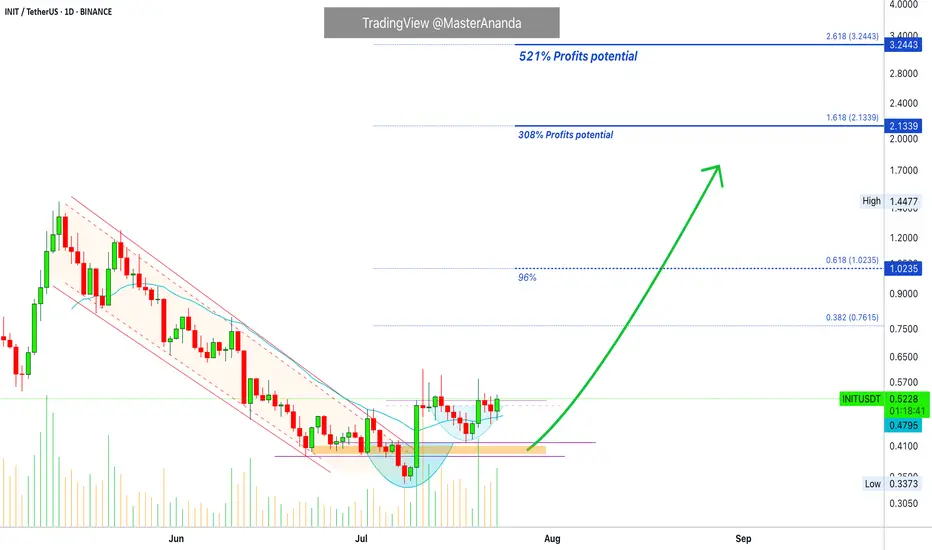
Initia Breaks Downtrend · 300% Profits Potential Chart SetupHere we have a nice chart setup and we are aiming for 144% short-term followed by 300%+ potential profits. Initia—INITUSDT—broke out of a downtrend 10-July with a full green candle and is already trading above EMA21. This is a solid, easy and simple chart setup.
Notice how the new projects continue moving forward while some of the big projects are stalling or retracing. This simply shows that the overall market continues bullish. If the market were to go on a correction, which develops marketwide, everything turns red.
When some pairs remain green in whatever section of the market, it means that money is simply moving from one sector to the next. After just a few hours, the market continues growing. We will see additional growth in the coming days. All is green, all is good, continue to hold strong. This is only the start.
Namaste.