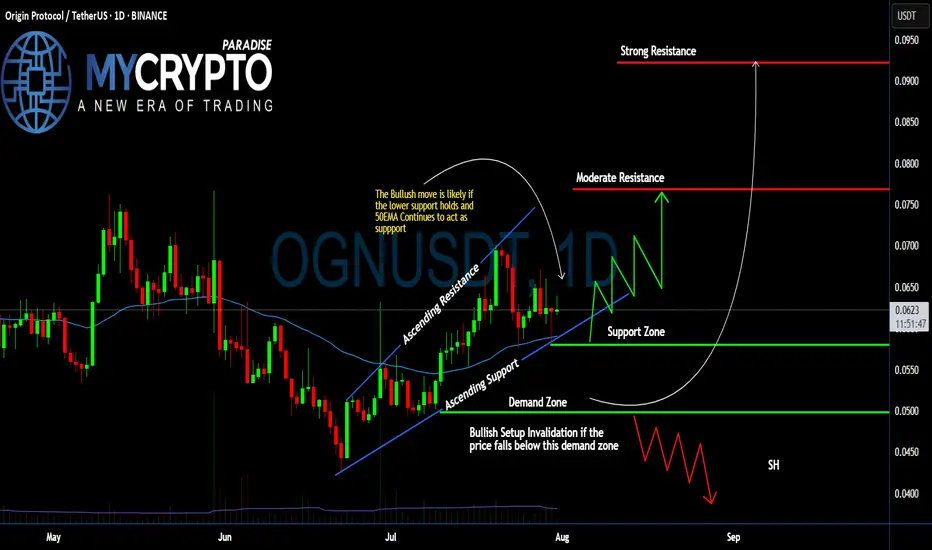
#OGN Ready For a Massive Bullish Move | Must Watch For BullsYello, Paradisers! Is #OriginProtocol about to explode to the upside, or is this a bull trap in disguise waiting to liquidate the impatient? Let’s break down what’s brewing on #OGNUSDT:
💎After forming a clean ascending channel, #OGN has been respecting both the ascending resistance and ascending support levels. Price is currently trading just above the 50 EMA, which has been acting as a dynamic support line since early July. This structure shows clear buyer interest around the $0.058–$0.062 zone—an area that aligns with volume cluster support.
💎The bullish scenario remains valid as long as #OGNUSD holds above the demand zone between $0.0499–$0.0580, and especially if it stays above the 50 EMA. As long as this structure is maintained, we could see a bounce toward the moderate resistance level at $0.076, where previous sellers stepped in and price stalled.
💎If buyers can break through that moderate resistance with strength and rising volume, the next key target lies at $0.092, which aligns with a strong resistance level and high-volume node on the visible range. This area is likely to trigger a reaction, so traders should remain agile.
💎However, if price breaks down below the demand zone, this would invalidate the current bullish setup and open the door for a potential move back toward the $0.045–$0.040 area. A broader shakeout would likely accompany this and could trap many late long entries.
Stay patient, Paradisers. Let the breakout confirm, and only then do we strike with conviction.
MyCryptoParadise
iFeel the success🌴
Cryptoanalysis
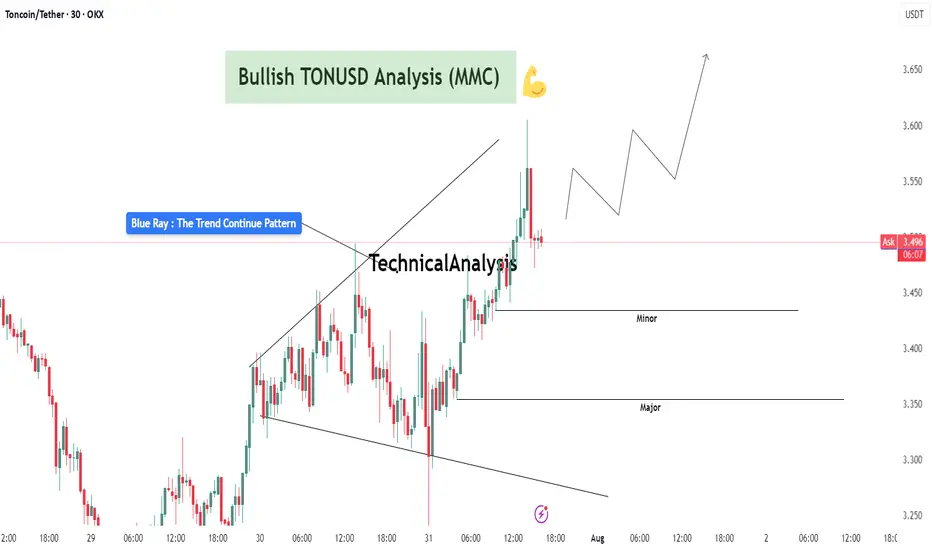
TONUSDT Analysis : Bullish Setup Breakout – Advanced MMC Analyze“Blue Ray Pattern Breakout Confirms Bullish Trend Continuation”
The 30-minute chart of TONUSDT highlights a clean and structured bullish setup based on the MMC (Mirror Market Concepts) methodology. The price action exhibits disciplined market behavior, respecting structural levels, breakout dynamics, and volume-based reactions.
🔷 1. Blue Ray Pattern – Trend Continuation Phase
This chart begins with the formation of the Blue Ray, a visual representation of trend consolidation and energy buildup. This pattern functions as a trend continuation flag or wedge. Prices compressed within a narrowing range, forming higher lows and lower highs, signaling accumulation under buyer control.
Once the pattern matured, we witnessed a decisive bullish breakout, where the price closed above resistance with conviction. This event marked a clear market intention shift and established a new impulsive leg.
🔍 2. Breakout Confirmation and Follow-Through
Post-breakout, TONUSDT experienced:
High-volume candles with elongated bodies, indicating increased buyer participation.
Immediate upside momentum that pushed the asset into a short-term overextended condition – often a healthy sign of strength when followed by a controlled pullback.
The breakout wasn’t just a false move – it was sustained, and the price held above the broken structure, proving that supply was absorbed and buyers were dominant.
🔑 3. Demand Zones (Minor and Major)
Two key MMC demand zones are highlighted:
🔹 Minor Demand Zone (~3.43–3.45):
This is the most immediate support and current price is hovering just above it. It's the first zone of interest for buyers and may serve as a re-entry or scaling point.
🔸 Major Demand Zone (~3.34–3.36):
In case of deeper retracement or volatility, this zone is expected to act as a strong bounce region based on past structure and MMC’s reversal logic. Price memory here suggests accumulation or reactive interest.
📐 4. Structure, Momentum, and Higher Timeframe Confluence
TONUSDT is in a confirmed uptrend, forming a clear sequence of higher highs and higher lows.
The structure supports a bullish flag breakout with minimal overhead resistance.
The projected path drawn on the chart illustrates a stair-stepping price pattern with continuation toward 3.60–3.70, if current levels hold.
📊 5. MMC Strategy Bias – Bullish
Using the MMC lens:
Blue Ray breakout confirms continuation
Volume absorption succeeded at the base of the flag
No signs of dominant supply entering post-breakout
Wave projection supports ongoing momentum
Structure favors buying dips, not shorting spikes
💡 Trader’s Takeaway:
TONUSDT is providing a textbook bullish opportunity under the MMC framework. As long as price stays above the Minor Demand Zone, continuation upward toward 3.60 and beyond remains in play. If price dips to the Major Zone, watch for strong buyer reactions for fresh entries.
Ideal for MMC traders and technical analysts looking to align with structured, logic-based entries and exits. This setup reflects market strength, technical clarity, and volume confirmation – a powerful trio for continuation plays.
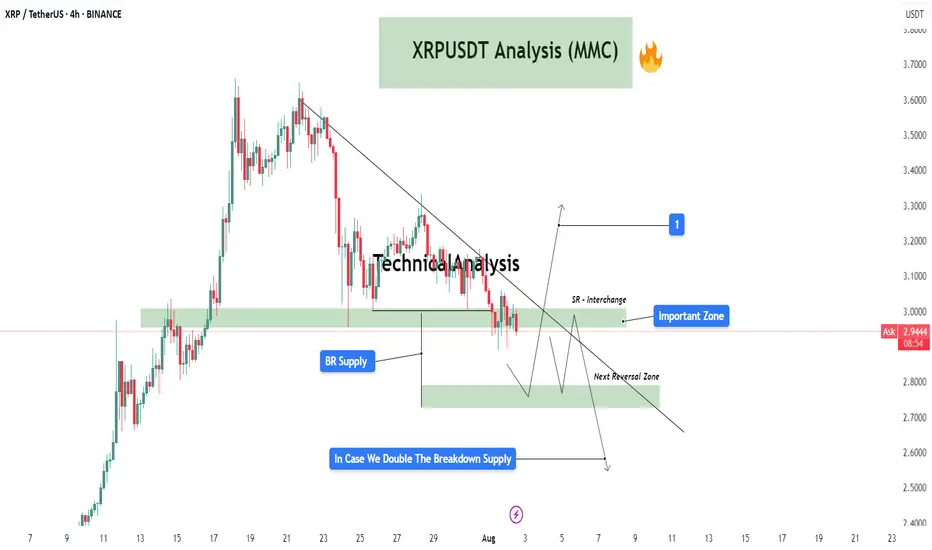
XRPUSDT Analysis (MMC) : Decision Point + Next Move Loading In this 4-hour chart of XRP/USDT, we're observing a critical structure forming under the Mirror Market Concepts (MMC) framework. Price action is compressing near an important descending trendline, suggesting that a breakout or breakdown is imminent. Let’s break it down zone by zone:
🔍 Key Zones & Price Structure:
Important Zone (SR Interchange Zone – $2.95 - $3.05)
This is a major supply-to-demand flip zone. It has served as both resistance and support in the past and is now acting as a potential interchange level. The price is hovering just below this area, retesting it after a significant bearish structure.
BR Supply Zone (Breakdown Retest Supply – $2.93 - $2.98)
After price broke down from this zone, it created a base for a retest. This level has since acted as a cap to further upside movement. It also coincides with the descending trendline, adding confluence to its strength as resistance.
Next Reversal Zone ($2.75 - $2.85)
In case the price fails to reclaim the Important Zone, we could see a bearish continuation move into the next zone of interest. This is a likely reversal or reaction area based on previous demand imprints and price imbalance.
SR Flip Watch
If price breaks above the trendline and sustains above the SR Interchange Zone, this could trigger a potential bullish breakout toward the $3.20+ region (labeled as target “1”). This move would be backed by trapped sellers and liquidity above the descending structure.
📈 Potential Scenarios:
✅ Bullish Case:
Break and close above the descending trendline.
Successful retest of the Important Zone as demand.
Push toward $3.20 - $3.30 where the next supply awaits (target 1).
❌ Bearish Case:
Rejection at the Important Zone and trendline resistance.
Breakdown below $2.90 confirms bearish pressure.
Possible liquidity sweep and reaction from the Next Reversal Zone ($2.75-$2.85).
If this zone fails to hold, continuation toward lower zones becomes likely.
🧠 MMC Perspective:
From a Mirror Market Concepts (MMC) standpoint, the market is currently at a reflection point where a decision between bulls and bears is about to play out. The clean diagonal structure plus clear horizontal liquidity pockets makes this setup ideal for anticipating manipulation traps and smart money moves.
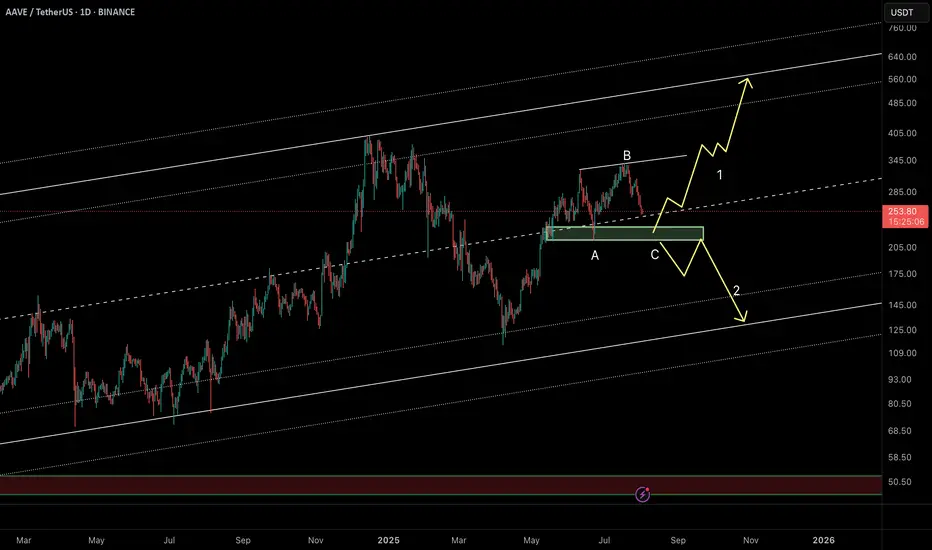
AAVE Daily Chart – Key Buy Zone & Two ScenariosAAVE is currently moving within a well-defined ascending channel on the daily timeframe. The last major bullish leg began from the $120 support and surged nearly +180% to a local high near $330.
Now, after a 25% pullback, price is consolidating around the midline of the channel near $250. More importantly, there’s a strong bullish order block sitting between $220–230, making this a low-risk buy zone with a stop below the order block.
🔸 Scenario 1 (bullish preferred):
Price dips into the $220 OB zone, completes a possible ABC correction, and launches a new bullish leg targeting the channel top above $500.
🔸 Scenario 2 (bearish alternate):
If the $220 order block fails, deeper correction could follow toward the channel bottom near $135.
⏳ This is a critical area to watch for reaction – Smart Money will likely show its hand soon.
🔗 Analysis by CryptoPilot
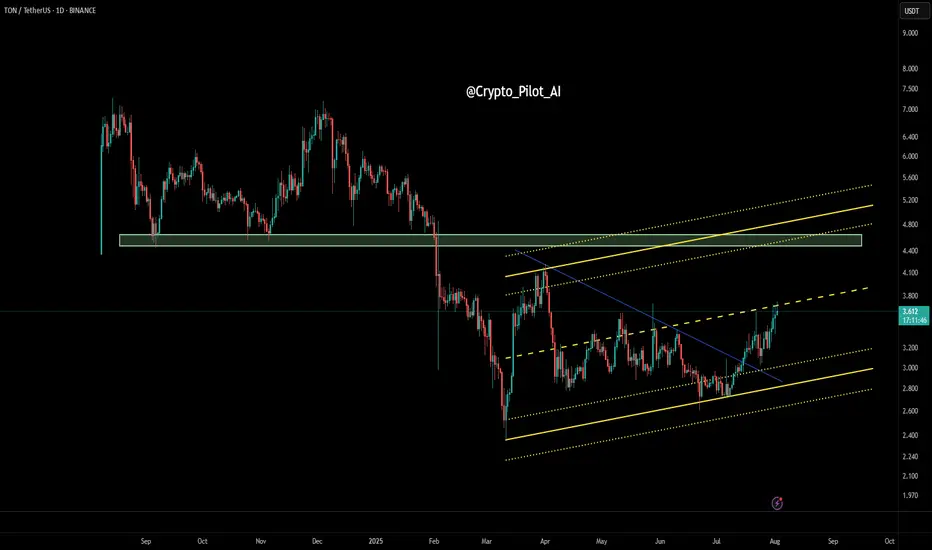
TON/USDT – Daily Price Action Analysis🔹 Price has broken a major descending trendline and entered an ascending channel.
🔹 Currently testing the mid-range resistance zone around $3.60 – $3.70.
🔹 If buyers hold above this area, the next targets could be $4.40 – $4.80.
🔹 If rejected, key supports are at $3.20 and $2.90.
BTCUSD Analysis : Blue Ray + MMC Bullish Scenario + Target Zone🟢 Today’s BTCUSD Analysis (MMC) – Strategic Insight into Institutional Behavior 💪
📊 Chart Breakdown: Understanding Price Through MMC
This 4H BTCUSD chart highlights critical behavior using Mirror Market Concepts (MMC) — where smart money traps, fakes, and flips market participants to create directional moves. Let’s break down the scenario:
🔸 1. Fakeout Zone – Smart Money Trap
Price initially surged to a local high, triggering a bullish fakeout, as shown in the green rectangle.
This move is designed to lure in breakout buyers above resistance, only to reverse sharply.
The sudden drop confirms smart money liquidation, catching retail longs off-guard.
A perfect example of a liquidity grab before shifting back into range.
📌 Fakeouts often mark the beginning of a new range or reversal setup in MMC methodology.
🔸 2. Blue Ray – Trend Continuation Structure
The consolidation after the fakeout forms the Blue Ray pattern, a recognizable trend continuation framework.
This structure signals smart money’s accumulation or re-accumulation phase.
Note how the price oscillates within the pattern, creating both lower highs and higher lows.
These compressions usually lead to explosive moves, either up or down, depending on liquidity build-up.
🔸 3. QFL – Quantity Following Line Event
Price briefly dips below the QFL level — another engineered stop-hunt to shake out premature longs and trap breakout sellers.
The reaction afterward shows strong buyer defense, confirming hidden demand.
MMC traders recognize this zone as a fake breakdown, setting up for the next trend wave.
🔸 4. Central Reversal Zone – The Decision Area
We’re currently hovering around the Central Reversal Zone, a key level of decision-making.
This is where liquidity from both buyers and sellers meets, making it a high-volatility zone.
Price could either:
(Scenario 1) Reject and fall lower to retest the trendline zone (marked with label 1).
(Scenario 2) Break above minor resistance and head toward the Next Reversal Zone (marked with label 2).
This structure aligns with MMC’s "Trap – Absorb – Break" cycle.
🔸 5. Major & Minor Resistance
Above the current price lies:
Minor Resistance (~$120,000): Immediate zone to clear for bullish continuation.
Major Resistance (~$121,000): Strong institutional supply, could act as the final hurdle before reversal.
If price clears these, BTC will likely target the Next Reversal Zone (~$122,500–123,500) for the next MMC reaction or short-term top.
🧠 Strategic Trade Outlook (MMC Logic)
✅ Bullish Playbook (Scenario 2):
Entry: Break and retest above $120,000 (Minor Resistance)
Confirmation: Hold above Central Reversal Zone with impulse
Target: $122,500–123,500 (Next Reversal Zone)
Risk: Close below $117,500 invalidates idea
🔻 Bearish Playbook (Scenario 1):
Entry: Rejection from $119,500–120,000
Target: Trendline support or prior QFL (~$116,000–115,500)
Invalidation: Clean 4H close above $120,500
📐 Key Concepts in This Analysis
Fakeout Trap: Retail euphoria liquidation
QFL Sweep: Smart money’s liquidity grab below structure
Blue Ray: Compression structure before continuation
Reversal Zones: Institutional interest areas where reactions occur
SR Flip Zones: Level conversion confirms trend maturity
📈 Summary
BTCUSD is currently in a smart money-controlled environment, compressing near key structural levels. The next move will be large, and by applying MMC, we’re prepared for both bullish breakout and bearish retest scenarios.
Be patient — traps come before trends.

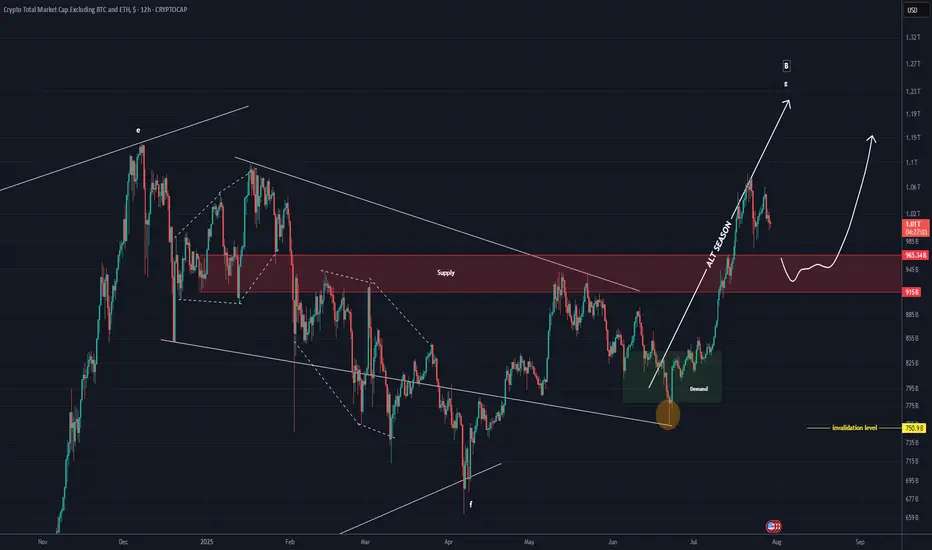
TOTAL 3 New Update (12H)This analysis is an update of the analysis you see in the "Related publications" section
This index has broken below the red zone; if a pullback to this area occurs, it may act as support again and the index could move upward
For risk management, please don't forget stop loss and capital management
Comment if you have any questions
Thank You
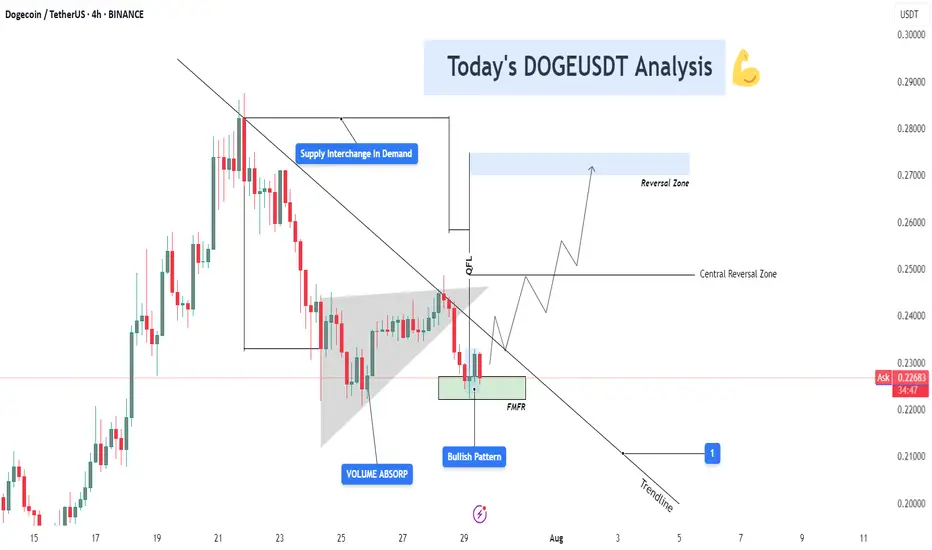
DOGEUSDT 4H – Bullish Reversal Building from FMFR Zone📊 Chart Context & Market Maker Concept Breakdown
DOGEUSDT on the 4H timeframe is setting up for a potential trend reversal, following a structured retracement into a strong demand zone that aligns with multiple smart money confirmations: QFL base, trendline break, volume absorption, and FMFR (Final Move Final Reaction). Let’s dive into the technical layers of this setup:
🔻 1. Downtrend Phase & Structure Setup
After peaking near $0.29, DOGE entered a controlled downtrend, respecting a descending trendline and forming a consistent lower-high structure.
Each rejection from the trendline reflects institutional distribution, gradually pushing price into lower demand levels where value buyers can step in.
🔄 2. Supply Flips into Demand (S/D Flip Zone)
A key level near $0.225 – $0.230 initially acted as a supply zone — but following QFL logic and smart money reaccumulation, it is now showing signs of demand activation.
The chart highlights “Supply Interchange in Demand”, which means that this zone has been repurposed — from distribution to accumulation — another MMC footprint.
📌 Interpretation: This is where large players flip their position bias and start loading for the next leg up.
🔵 3. Volume Absorption Confirmed
Prior to the current bounce, a strong volume absorption phase was detected within a falling wedge or triangular base, shown on the chart.
Despite sell-side pressure, buyers continued to absorb orders — a sign that selling is weakening, and accumulation is underway.
📌 Clue: Volume absorption often precedes an explosive breakout, especially when aligned with FMFR or QFL patterns.
🔁 4. Final Move Final Reaction (FMFR)
Price tapped into the green box zone one final time, marked as FMFR (Final Move Final Reaction) — a key MMC reversal signal.
This occurs when market makers fake a breakdown (creating panic) and then sharply reverse, trapping breakout sellers and scooping up liquidity.
A small bullish candle formation (Bullish Engulfing / Pin Bar) can be seen within this zone — the “Bullish Pattern” label marks this.
🧠 Smart Money Logic: Institutions want liquidity. FMFR fakes weakness to attract retail shorts, then reverses to ride liquidity to the upside.
🔗 5. QFL Base + Break of Structure Setup
A QFL (Quick Flip Level) pattern is forming. This represents a market structure flip, where price first drops from a base, reclaims it later, and continues in the opposite direction.
Breaking this base and confirming above it would mark a true reversal in structure.
🛠️ Technical Confluences at Work
Element Insight
🔹 QFL Structure Base level reclaim in play (structure shift)
🔹 Volume Absorption Smart money soaking up sell pressure
🔹 FMFR Reaction Final stop hunt before the rally begins
🔹 S/D Flip Supply turned to demand near $0.225 zone
🔹 Bullish Pattern Early confirmation of reversal
📈 Projection Path & Reversal Zones
Two projected zones are mapped for price behavior:
🔸 Central Reversal Zone (~$0.250):
First significant resistance where price may pause or react.
Ideal partial profit level or re-entry after pullback.
🔹 Main Reversal Zone (~$0.270–0.275):
Target area for a full liquidity sweep.
This was a previous high-volume supply zone.
If price reaches here, expect potential rejection or distribution unless momentum is strong.
🎯 Trade Setup Strategy (Based on Your Chart)
Entry Area: $0.225 – $0.229 (FMFR Reversal Zone)
Stop-Loss: Below $0.221 (beneath FMFR low)
Take Profit 1: $0.250 (central zone)
Take Profit 2: $0.270 – $0.275 (main reversal zone)
📐 Risk-to-Reward:
TP1: 1:2
TP2: 1:3+ depending on entry timing
🧠 Psychology Behind the Setup
This DOGE setup is engineered to trap emotional traders:
Retail sellers enter late near the bottom.
Smart money waits at FMFR zone, absorbing liquidity.
Volume builds quietly.
Market reverses explosively, catching retail off guard.
By recognizing this setup early, you’re aligned with Market Makers, not against them.
TONUSDT Bullish Reversal from Demand with QFL Base | MMC Setup📊 Technical Breakdown – 4H Chart
✅ Overview
TON/USDT is exhibiting early signs of a bullish reversal after a structured decline into a key smart money demand zone. The setup reflects multiple layers of confirmation—QFL base, multi-supply absorption, liquidity inefficiencies, and a positive reversal pattern—suggesting a high-probability opportunity for upside.
🔹 1. Impulsive Move & Liquidity Sweep
Price rallied aggressively on July 22–23, pushing toward $3.60, breaking short-term highs and triggering liquidity grabs above recent consolidation zones.
This surge absorbed significant buy-side liquidity, leaving a supply zone behind, now marked as the Next Reversal Zone.
After liquidity was collected and orders filled, the market reversed sharply, consistent with institutional profit-taking or engineered liquidation traps.
🧠 Smart Money Insight: Institutions often push price into illiquid zones (above highs) to trap retail and fill large orders. This marks the first phase of the trap.
🔻 2. QFL Base and Multi-Supply Absorption
The price structure created a Quick Flip Level (QFL) — a smart money concept where price forms a base, drops, then rallies, leaving behind an institutional demand zone.
The current pullback has revisited this exact QFL base, now reinforced by 3x supply absorption, enhancing the zone's strength.
This confluence increases the probability of a strong reaction to the upside from this level.
📌 Note: The “If Cross 3x Supply” label shows that this zone has absorbed multiple attempts to break down. It's now acting as a demand pocket.
🔄 3. Reversal Area – The Engine Room of Smart Money
The Reversal Area is carefully marked at $3.20–$3.28 — the ideal discounted price zone where large buyers tend to step in.
This zone is structurally important:
Past breakout level
Aligned with QFL base
Beneath stop levels of breakout traders
A Positive Pattern has now formed within this area—likely a bullish engulfing, morning star, or pin bar, depending on candle confirmation.
📌 Psychology: This zone acts as a trap. Retail traders often panic sell here, while smart money accumulates quietly before launching price upward again.
🧭 4. Dual Scenario Structure – Projected Paths
You’ve beautifully mapped two valid future price scenarios based on reaction to the Central Reversal Zone (~$3.35):
🔵 Scenario 1 – Healthy Pullback Before Continuation
Price climbs toward the central zone, then pulls back slightly to retest support near $3.28–$3.30 (label 1).
This allows further accumulation before price breaks higher.
This is a safer re-entry scenario for patient traders looking for a retest.
🟢 Scenario 2 – Direct Impulsive Rally to Next Reversal Zone
Price continues with bullish momentum, slicing through $3.35 and aiming for the Next Reversal Zone at $3.52–$3.60 (label 2).
This zone contains remaining liquidity, left uncollected from the previous impulse.
Price is likely to reverse or pause at this level again due to heavy supply.
📌 Key Tip: If price reaches that zone without significant resistance or exhaustion, it may signal continuation potential with minor corrections.
💼 Strategic Trade Plan (High-Probability Setup)
Entry Zone: $3.20 – $3.28 (Reversal Area)
Stop-Loss: Below $3.15 (beneath structure + QFL base invalidation)
Target 1: $3.35 (Central Reversal Zone)
Target 2: $3.52–$3.60 (Liquidity Completion & Next Reversal Zone)
🧮 Risk-Reward Estimate:
Conservative: 1:1.8
Aggressive: 1:2.5 or better if price reaches high liquidity zone.
🔄 MMC Flow Summary – What the Market Makers Are Doing:
Create a trap at the top (collect liquidity and fake the trend)
Force price down into demand (scare retail + grab stops)
Absorb sell orders in bulk at QFL/demand zone
Form bullish reversal pattern (positive structure)
Push price upward again, aiming for uncollected liquidity above
📌 This is a classic MMC cycle — engineered by large players, and now you’re aligned with their strategy.
🧠 Why This Matters
This chart isn’t just about entry and exit; it’s about understanding the underlying psychology and structure. By aligning with the smart money footprint — QFL, supply absorption, and liquidity targeting — you're maximizing edge and minimizing guesswork.

Will #TIA Continue to Soar or Bears Can Halt it? Must Watch Yello, Paradisers! Will we see #TIA continue to soar from here, or can bears halt its momentum? Let's see the latest setup of #Celestia to see what's going to happen:
💎Following a textbook ascending channel structure, #TIAUSDT has been respecting both its ascending resistance and ascending support, with each touchpoint confirming trader participation and growing confidence. Price is currently holding above the 50 EMA and within a crucial support zone between $1.80–$1.90—an area that previously triggered a strong impulse move to the upside.
💎The probability of a bullish continuation increases significantly as long as the #TIAUSD respects this support zone and the 50 EMA acts as dynamic support. If this level continues to hold, we expect a move toward the moderate resistance around $2.67, the key area where sellers previously stepped in aggressively.
💎But that’s not all—if bulls gain momentum and break above $2.67 with strong volume, the next price magnet becomes the $3.34 level, where strong resistance and high-volume node overlap. This level would likely be the point of exhaustion unless broader market momentum takes over.
💎However, caution is critical here. If price breaks below the strong demand zone around $1.507, this invalidates the bullish structure entirely and opens the door for a swift move down toward the $1.20–$1.00 range, where a potential market shakeout could occur. Remember, a failed bullish setup often becomes a powerful bear trap for undisciplined traders.
Stay patient, Paradisers. Let the breakout confirm, and only then do we strike with conviction.
MyCryptoParadise
iFeel the success🌴

BTCUSD Analysis (MMC) – Breakout Confirmed + Target Next Zone⚙️ Chart Context (4H BTC/USD)
As part of our Mirror Market Concepts (MMC) strategy, today's BTCUSD 4H chart is a textbook representation of market structure shift, SR interchange, demand reaction, and target projection. After consolidating within a compressed range under a key descending structure, Bitcoin has successfully broken out of bearish control, signaling a fresh phase of bullish momentum.
🧩 Breakdown of Technical Structure
🔹 1. Demand Zone Reaction (July 13–14)
The initial impulse move originated from a well-defined demand zone, marked by a strong accumulation and breakout. This zone—highlighted on the chart—acted as the institutional demand base, where buyers stepped in with volume and aggression. Price respected this zone precisely, confirming it as a valid MMC "Power Base."
Why this matters: Demand zones like these reflect institutional footprints. Once price reacts from such zones, they often become foundational for future bullish legs.
🔹 2. SR Interchange Zone – Structure Flip Confirmed
The descending green channel acted as dynamic resistance for several sessions. Every touch along this zone resulted in a lower high, confirming bearish order flow. However, BTC has now closed decisively above this structure, transforming this zone from supply to support—this is our classic SR Interchange concept in MMC.
Interpretation: This structure flip implies a strong change in sentiment. What was once a zone of rejection now becomes a potential support for continuation.
Expect retests of this zone before price resumes to higher reversal levels.
🔹 3. Minor and Major Resistance Zones
Above current price, two critical zones have been mapped:
Minor Resistance (~$120,000):
Acts as the first liquidity grab area. This is where early sellers may place stops or where short-term traders could book profits. MMC logic expects minor resistance to either cause a pause or a fakeout to lure in shorts.
Major Resistance / Central Reversal Zone (CRZ):
Spanning roughly $121,000 to $121,800, this is a key zone where price will likely meet decision-making. This CRZ is derived from previous structure congestion, imbalance fills, and projected Fibonacci confluence.
Next Reversal Zone (Final Target Area):
Located near $123,000, this is the outer reversal box where the bullish wave may either end, consolidate, or reverse entirely. This is the final target for swing traders or MMC practitioners looking for exhaustion.
🧭 Price Forecast Structure – Predictive Pathway
The forecast path shown on the chart illustrates a stair-step rally, with bullish impulses followed by shallow pullbacks:
First, price may pull back slightly to retest the breakout zone (green SR area).
Then a leg upward to minor resistance (~$120K).
A healthy rejection or small correction before breaking into the CRZ (~$121.2K).
Final move toward the outer reversal zone at ~$123K.
This fractal progression is a common MMC pattern seen during structure shifts—not impulsive straight-line rallies, but controlled, zone-to-zone movements.
🔍 Strategic Insights & Trade Plan
📌 Conservative Entry:
Wait for a retest of the breakout zone (SR Interchange) around $118,200–$118,500.
Look for bullish rejection candles or order flow confirmation on LTF (lower timeframes).
📌 Aggressive Entry:
Break and close above $120,000, confirming liquidity clearance and path toward CRZ.
🎯 Target Zones:
TP1: $121,200 – Central Reversal Zone
TP2: $123,000 – Outer Reversal Zone
❌ Stop-Loss Ideas:
Below $117,000 (structure invalidation)
Below recent bullish impulse candle low
🧠 MMC Concepts in Action:
SR Flip: Strong indication of market shift
Demand Rejection: Institutional footprint detected
Zone Mapping: Controlled zone-to-zone movement
Liquidity Logic: Price moves where orders rest – CRZ = likely reaction
Reversal Framing: Structure analysis ahead of time, not after the move
📊 Conclusion:
This BTCUSD 4H analysis showcases a strong MMC-style breakout scenario. The reaction from demand, shift in SR structure, and projected reversal zones give us a clean roadmap. As long as the structure remains valid and price respects the new SR zone, this bullish move remains high-probability.
Trade with structure. Trust the zones. Mirror the Market.

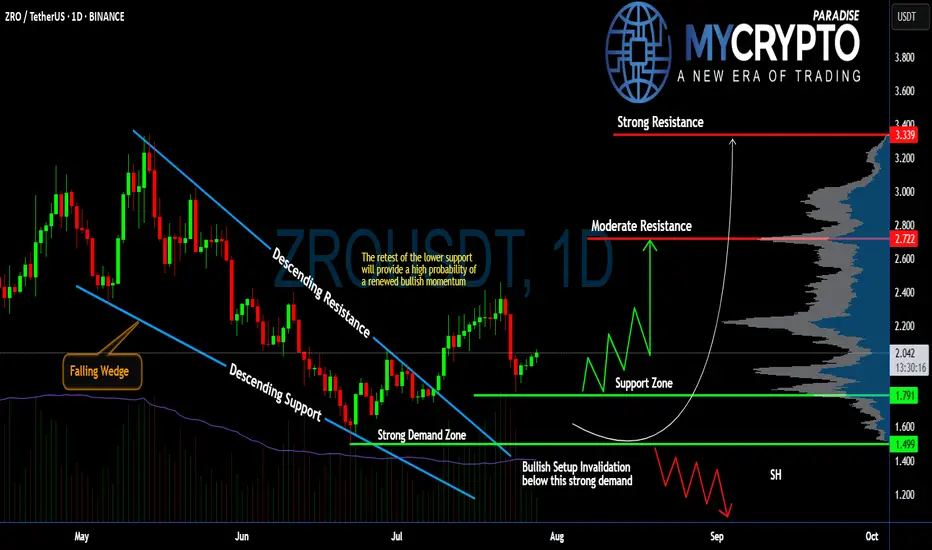
Will #ZRO Continue to Climb or Not? Must Watch For BullsYello, Paradisers! Are we witnessing the beginning of a powerful bullish reversal on #ZROUSDT, or is this just a fakeout setup? Let’s dissect this setup of #LayerZero:
💎After weeks of consistent bleeding, #ZRO has printed a classic falling wedge pattern, often a precursor to bullish reversals. This wedge has now been broken to the upside, with price currently trading around $2.037, suggesting renewed buyer interest following the breakout from descending resistance.
💎What’s crucial here is the retest of the wedge’s descending support, which aligns perfectly with a strong demand zone between $1.499 and $1.791. As long as #ZROUSD respects this zone, the probability of a bullish continuation remains high. This zone also serves as a clear invalidator for the setup—if price closes below $1.499, the bullish thesis will be off the table.
💎From here, if bulls can maintain control, we’re eyeing a potential move toward the moderate resistance at $2.722. That’s the first real hurdle where profit-taking or short interest could spike. A clean break above that level would open the path to the strong resistance around $3.339, where a heavy supply zone is likely to cap further upside.
💎Until then, we expect a series of zigzag corrections above the support zone before any sustained push higher. However, be cautious, losing the $1.499 support turns the structure bearish and could drag the price toward the $1.20 region, or lower.
Stay patient, Paradisers. Let the breakout confirm, and only then do we strike with conviction.
MyCryptoParadise
iFeel the success🌴
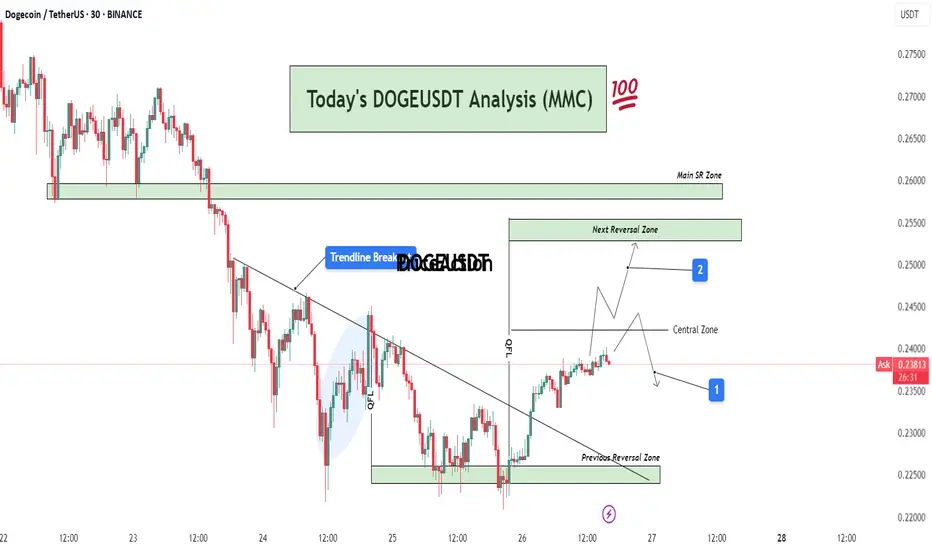
DOGEUSDT Analysis : Bullish Breakout, Reversal Zones + Target📊 Full Technical Analysis:
This chart presents a structured and precise MMC-based analysis of DOGE/USDT on the 30-minute timeframe, integrating key price action zones, trendline structure, and potential market scenarios.
🧩 1. Downtrend Phase and Trendline Formation
DOGE was in a continuous downtrend, creating lower highs and lower lows. A bearish trendline had been acting as dynamic resistance for multiple sessions. Price consistently respected this trendline, indicating strong seller dominance.
However, after repeated taps on the trendline and rejection from lower support, price finally broke above the trendline — marking a potential trend reversal or corrective phase.
🔄 2. Previous Reversal Zone – Demand Zone (0.225–0.228)
This zone acted as the major turning point where buyers aggressively stepped in. The demand was previously tested and respected, indicating strong accumulation here.
From this zone, a bullish reversal was initiated, leading to the current price rally.
This area can now be considered a structural support base – ideal for watching future re-tests or consolidation.
🔁 3. Central Zone – Decision Area (0.238–0.240)
This is a critical intraday resistance zone acting as a central decision-making area for traders.
Two Key Scenarios Could Play Out from Here:
Scenario 1 (Marked by Blue Box 1):
Price could face rejection from this zone and fall back slightly toward minor support levels for a retest or liquidity grab. If bullish pressure sustains, a higher low may form before continuation upward.
Scenario 2 (Marked by Blue Box 2):
If price breaks above the central zone with strong volume, momentum can push it toward the Next Reversal Zone between 0.250–0.255.
In either case, watching price behavior and candle structure near the central zone is critical for confirmation of the next move.
🔼 4. Next Reversal Zone – Supply/Resistance (0.250–0.255)
This zone marks a historical resistance area where DOGE faced heavy selling pressure before.
If price reaches this zone, expect:
Either profit-taking and short-term selling from intraday traders.
Or a possible breakout continuation if broader market sentiment remains bullish.
This zone will act as a key test of DOGE's strength and market conviction.
📌 5. Main SR Zone – Strong Structure (0.258–0.260)
Beyond the Next Reversal Zone lies the Main SR (Support-Resistance) Zone, where price has reacted strongly in the past.
If DOGE manages to break and hold above the 0.255 range, this zone will likely become the next upside target and strong resistance zone.
🔍 Additional Market Context:
Breakout Volume: The trendline breakout was accompanied by rising volume, which suggests stronger conviction behind the move.
QFL Zone: Price structure also aligned with a QFL (Quick Flip Level) bounce within the shaded region before breakout, further validating the bullish pressure.
Psychological Levels: 0.240 and 0.250 are psychological levels, which often act as magnet points and temporary resistance/support.
🧠 Mirror Market Concepts (MMC) Insight:
This analysis is rooted in Mirror Market Concepts, where the market tends to reflect past behavioral zones. Each marked zone (Demand, Central, Reversal, SR) is based on previous reaction points that guide current sentiment.
The market is now in a mirror reaction phase, moving from the previous demand zone toward historical supply zones. If the symmetry continues, the pattern supports a gradual bullish continuation with measured pullbacks.
✅ Trading Plan (Educational Purpose Only – Not Financial Advice):
Entry Zone 1: Breakout traders may have entered after the trendline breakout near 0.233–0.235.
Entry Zone 2: Conservative traders can look for retest confirmation in the Central Zone.
Target Zone: Next Reversal Zone (0.250–0.255) and possibly Main SR (0.260).
Stop Loss: Below the Previous Reversal Zone (~0.224) for swing setups.
Risk-to-Reward: RR setup of 1:2 or higher possible depending on entry strategy.
#1INCH Setup Favors Bears | Can Bears Pull it Down Further? Yello Paradisers! Are you prepared for what might be the next big move on #1INCHUSDT? The #1INCHNetwork is flashing clear warning signs:
💎#1INCH is currently trading inside a Descending Triangle, a pattern that historically favors bears. The price has broken down the lower support and is coming to retest it. If #INCHUSD retests the lower support and doesn't enter the descending triangle, the probability of the bearish pressure will increase.
💎The 50 EMA is acting as a strong dynamic resistance, reinforcing the bearish bias. Every attempt to reclaim higher levels has been rejected, and as long as we remain capped below the descending resistance, bulls are at a clear disadvantage.
💎A successful retest of the lower support trendline will significantly increase the probability of a breakdown. If this triangle finally breaks to the downside, we should be watching the $0.2116 support zone as the first key level to catch any temporary reaction.
💎But the real danger — and opportunity for patient traders — lies lower. If $0.2116 fails, the next strong demand zone sits at $0.1582, which could be the level where real buyers finally step back in. Until then, any bullish scenario remains invalid unless the price breaks and closes above the strong resistance at $0.3332.
Trade smart, Paradisers. This setup will reward only the disciplined.
MyCryptoParadise
iFeel the success🌴

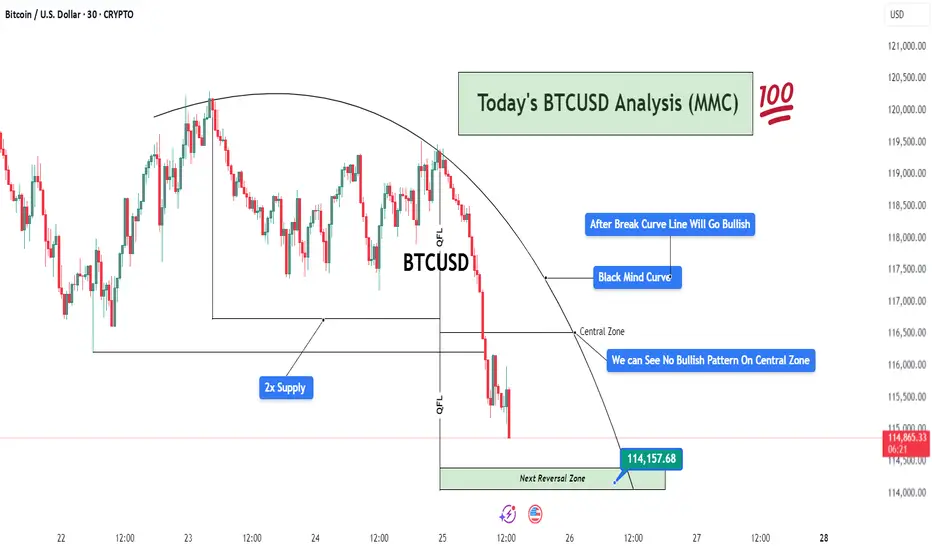
BTCUSD Analysis (MMC) – Bearish Flow Toward Reversal ZoneThis 30-minute BTCUSD chart highlights a well-structured bearish movement following the MMC (Mirror Market Concepts) framework. The analysis centers around the Black Mind Curve, multiple QFL drops, and supply/demand imbalances, presenting a professional outlook on current price action and potential reversals.
🧠 Black Mind Curve – Mapping Market Psychology
The Black Mind Curve is a visual representation of the market’s psychological behavior and serves as a dynamic resistance throughout this structure. Price respected the curvature, slowly losing bullish strength while forming lower highs.
This curve mirrors a distribution phase, where smart money unloads long positions before initiating a downside move.
Your annotation: “After Break Curve Line Will Go Bullish” implies that unless the curve is cleanly broken with strong bullish conviction, the bias remains bearish.
So far, the price is respecting the curve, reinforcing sellers’ control.
🔵 2x Supply Zone – Aggressive Selling Region
The supply zone is tested twice, confirming the presence of institutional-level sellers. This zone becomes critical because:
First touch: Minor reaction, but no follow-through.
Second touch: Strong rejection with extended downside move.
The double rejection clearly shows that buyers are trapped, fueling bearish momentum.
From an MMC view, this confirms the beginning of the “Mirror Market Shift” — where smart money rotates out of longs and traps retail longs near resistance.
📉 QFL (Quick Flip Liquidity) Events – Momentum Crashes
Two major QFL-based breakdowns appear in the chart after price consolidated within ranges. These drops are essential to understand:
QFL reflects market structure breaks where liquidity is engineered, and a sharp sell-off follows.
The first QFL drop occurs after the curve-resistance rejection, and the second confirms continuation.
These are liquidity runs, used to clear stop-losses and maintain bearish pressure.
This creates a domino effect — each QFL level becomes a signal of deeper imbalance.
⚠️ Central Zone – No Bullish Pattern Detected
The Central Zone marks a temporary support or midpoint level — a place where price might find footing if buyers show up.
However, as you noted:
“We Can See No Bullish Pattern On Central Zone”
No bullish engulfing candle.
No pin bar rejection.
No spike in volume.
No market structure shift.
This confirms that buyers are either weak or absent in this zone. MMC traders use this info to stay with the dominant trend (bearish) until proven otherwise.
🟩 Next Reversal Zone – 114,157.68 (Critical Demand Zone)
The green zone marked as “Next Reversal Zone” is a key level to monitor:
This area aligns with historical demand, where BTC previously reversed or slowed down.
Price is likely to hunt liquidity below recent lows before a potential bullish reaction.
It’s a Smart Money zone — designed to trap breakout sellers and absorb volume for a reversal.
Traders should watch for:
Bullish engulfing patterns
Break of structure to the upside
Divergence with RSI/volume
Sweep and reclaim setup
Once the price enters this zone, MMC reversal tactics come into play — buyers may step in aggressively here.
📅 Fundamentals & Timing
At the bottom of the chart, we see upcoming U.S. economic news events, which can act as volatility catalysts. Price could reach the reversal zone just before or during high-impact news, which aligns perfectly with smart money manipulation.
Be cautious of fakeouts around news time.
Confirmation is key before entry.
🧭 Final Outlook & MMC Strategy
Trend Direction: Bearish until 114,157.68 zone is hit.
Momentum Drivers: QFL drops, strong rejection from 2x supply, absence of bullish signals.
Key Watch Level: 114,157.68 – wait for MMC reversal pattern here.
Invalidation: If price breaks and closes above the Black Mind Curve with volume.
📌 Trade Idea Summary (For Caption Use):
BTCUSD respecting MMC Black Mind Curve. 2x Supply Zone triggered QFL breakdowns. No bullish confirmation at Central Zone. Eyes on Next Reversal Block near 114,157.68. Watch for reaction and potential reversal setup. #SmartMoneyMoves
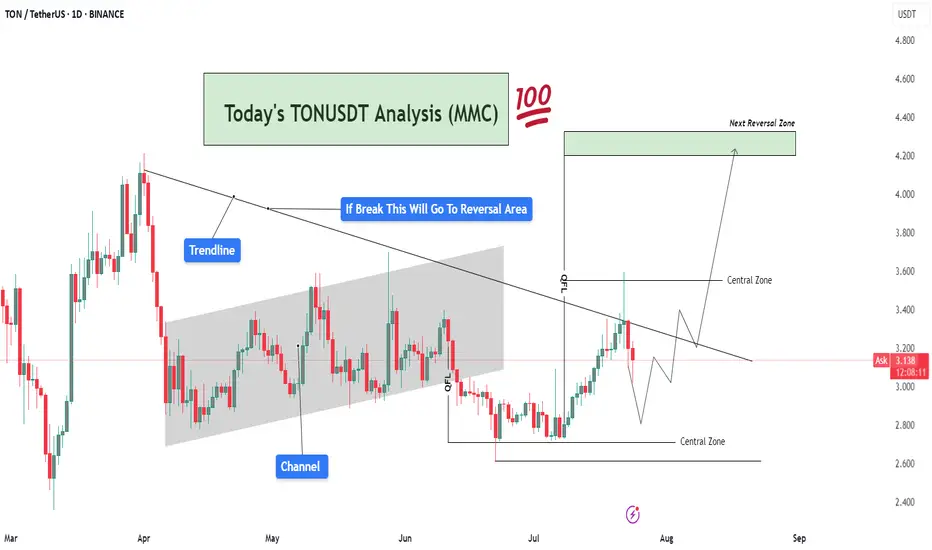
TONUSDT Analysis – Trendline Breakout Target To Reversal Area🧠 Market Sentiment & Context:
TONUSDT (Toncoin vs USDT) is currently trading at $3.13, showing signs of compression within a well-defined MMC structure. After forming a clear QFL (Quick Flip Level) base, the market is approaching a decisive breakout level, with a strong rejection or breakout likely in the coming days.
This chart displays confluence from trendlines, channel breaks, central zones, and QFL demand zones, providing multiple layers of structure-based decision-making. Here's a deeper dive 👇
🔍 Technical Breakdown – What the Chart Is Telling Us:
🔸 1. Major Trendline Resistance – Bearish Control Zone
The descending trendline drawn from prior highs is acting as dynamic resistance.
Price tested this line recently and faced rejection, showing that sellers are still active.
However, the consolidation below the trendline suggests accumulation, not panic selling — a classic sign of smart money positioning before a breakout.
🔸 2. Previous Channel Structure – Broken & Retested
The price previously moved inside a slightly rising parallel channel, reflecting a slow and steady bullish phase.
The channel has now been broken, but TON quickly reclaimed structure via a strong bullish engulfing candle from the QFL base, hinting that this was a liquidity grab (stop hunt) before the real move.
🔸 3. QFL (Quantity Following Line) – Institutional Demand Zone
The QFL base at around $2.85–$3.00 was created after a swift sell-off followed by immediate bullish response.
This is a high-probability MMC reversal structure, where large buyers typically enter.
Since this QFL held firm, it has created a solid foundation for bullish momentum, provided the trendline is eventually broken.
🧭 What's Happening Now – Price Action Update:
Price is caught between two major Central Zones:
Lower Zone: $2.85 – $3.15 (Support)
Upper Zone: $3.50 – $3.70 (Resistance)
The current movement shows price creating higher lows, indicating bullish pressure building beneath the trendline.
Volume remains low, which means the market is waiting for a catalyst (news or breakout) before a directional push.
📌 Key Reversal Zone Ahead – Eyes on $4.20 to $4.40
If price breaks and closes above the descending trendline and crosses the upper central zone, we can anticipate a strong bullish move toward the Next Reversal Zone marked around $4.20–$4.40.
This zone has historical confluence as:
Previous strong supply zone
Psychological round number
Fibonacci extension alignment
This will likely be the profit-booking area for swing traders and early buyers from the QFL zone.
📈 Trade Scenarios Based on MMC:
✅ Bullish Scenario (High Probability If Breakout)
Price breaks the trendline → Pullback → Retest of $3.50–$3.60 zone
Bullish continuation to $4.20–$4.40 Reversal Zone
Ideal entry on retest after breakout
Stop-loss below $3.00
❌ Bearish Scenario (If Rejected Again)
Rejection from trendline leads to re-test of lower Central Zone
Breakdown of QFL level (~$2.85) would invalidate bullish setup
Potential drop toward $2.60 zone for liquidity sweep
🧠 MMC-Based Observations:
🔹 MMC Element 📍 Explanation
🔺 Trendline Key resistance from macro downtrend
🟩 Central Zones Neutral battleground for buyers/sellers
🔻 Channel Break Confirmed bearish momentum earlier, now tested
✅ QFL Strong base, showing early smart money entries
🎯 Reversal Zone High-risk area, expect volatility and profit-taking
📌 Strategic Summary:
Bias: Bullish (as long as price holds above $3.00)
Confirmation Needed: Daily candle close above trendline & $3.50 zone
Target 1: $3.85
Target 2: $4.20–$4.40 (main reversal)
Invalidation: Close below $2.85 (QFL loss)
🚨 Final Thoughts:
TONUSDT is showing clear smart money footprints via the QFL formation and trendline pressure. The setup is ideal for MMC-based breakout traders waiting for confirmation before entering. Volume spike + trendline break will likely spark the next impulsive rally.
Stay patient, and trade the reaction, not the prediction.
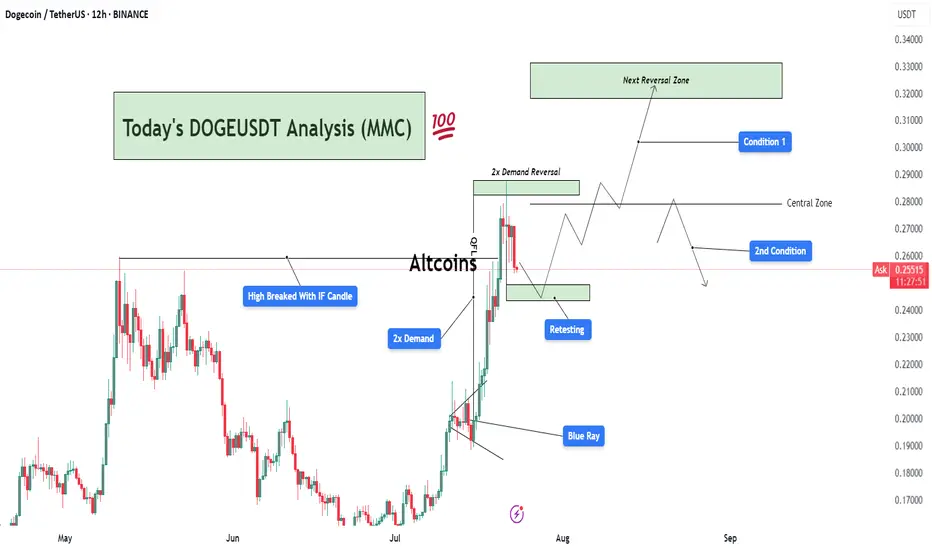
DOGEUSDT Analysis : Demand Zone Retest Before New Highs Target📊 Overview:
Today's DOGEUSDT analysis (12H chart) under the Mirror Market Concept (MMC) framework reveals a potential bullish continuation or corrective phase based on two major conditions. The market structure is transitioning after a strong impulsive move, triggered by a 2x Demand Zone breakout, and is now in the retesting phase.
🔍 Key Technical Breakdown:
High Broken with IF Candle:
A significant previous swing high was broken decisively by an Initiation Flow (IF) candle, indicating institutional activity or aggressive buying pressure.
This confirms a shift in market structure toward a bullish trend.
2x Demand Zone:
This zone has served as a strong base for price accumulation and an impulsive breakout.
The market responded well with a sharp rally post this demand, validating it as a critical support.
Blue Ray Zone (Support Zone):
The bullish breakout was partially driven by this inner trendline zone (referred to as Blue Ray), where price respected the rising support channel before breakout.
This shows smart money liquidity engineering prior to the breakout.
Retesting Zone:
Currently, the price is retracing toward a previously broken demand zone.
If this zone holds, it could provide an optimal entry for continuation.
📈 Two Scenarios (Conditions):
✅ Condition 1: Bullish Breakout to Next Reversal Zone
If the retest holds and price prints bullish confirmation (e.g., engulfing or pin bar), we can expect price to move up toward the next key reversal zone between $0.3100–$0.3300.
This zone is marked as a potential supply/reversal zone, where large sell-offs may occur.
This path follows the continuation structure under MMC, aligning with trend-following buyers.
⚠️ Condition 2: Failure to Hold Demand → Deeper Pullback
If the current demand zone fails to hold and price re-enters below the central zone (~$0.2700), we could expect a deeper correction.
Price may then revisit lower demand regions, potentially toward $0.2200 or lower, depending on rejection strength.
📌 Important Notes:
The central zone acts as a pivot level, defining whether bulls or bears gain short-term control.
Monitor the reaction from retesting area closely — candle confirmation is key before any trade execution.
This chart follows Mirror Market Concepts (MMC), combining smart money behavior, demand/supply reversal logic, and psychological market zones.
💬 Final Thoughts:
DOGEUSDT is currently in a critical phase. The market has shown strength, but now it's about confirmation. Patience is key — wait for a clean break or rejection around the retesting zone to determine the next direction. The analysis favors bullish continuation, but being flexible with both scenarios gives traders an edge.
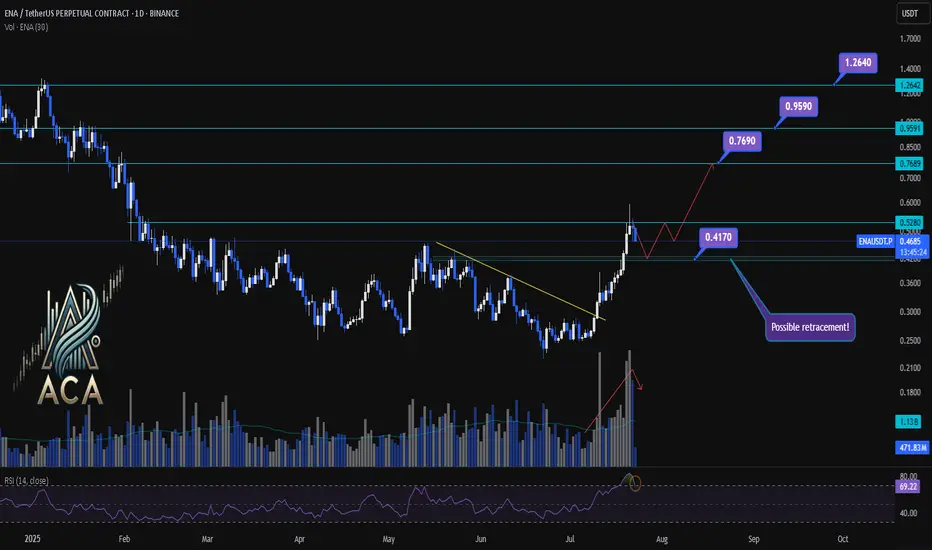
ENA/USDT Chart Analysis | Volatility Signals & Bullish TriggersENA/USDT Chart Analysis | Volatility Signals & Bullish Triggers
🔍 Let’s dive into the ENA/USDT perpetual contract and analyze recent price action, focusing on momentum shifts and key breakout scenarios.
⏳ Daily Overview
The daily chart shows that ENA recently reentered the overbought zone on the RSI, which can serve as a potential trigger for traders watching momentum shifts. Earlier, price action broke decisively above a long-standing descending trendline, resulting in a rapid, nearly 100% surge, a classic RR2 move off the trendline. This breakout coincided with a visible uptick in trading volume, confirming strong demand behind the move.
Now, during the ensuing rest or correction phase, trading volume is decreasing—often a constructive sign suggesting either profit-taking or a healthy pullback rather than panic selling.
🔺 Bullish Trigger & Setup:
- RSI Signal: Reentry into the RSI overbought zone is a potential long trigger, especially if confirmed by price action.
- Confirmation Level: A daily close with strong volume above $0.528 would add conviction to a bullish setup.
- Trendline Reference: The break above the recent trendline fueled the rapid advance, showing the importance of watching such key resistance levels.
📊 Key Targets (on further bullish confirmation):
- $0.769 — First upside resistance.
- $0.959 — Next bullish target.
- $1.264 — Extension target if momentum continues and broader market sentiment remains supportive.
🚨 Conclusion:
Eyes are on the $0.528 level—closing above it with volume, especially while RSI holds in the overbought zone, could provide the next strong entry signal. Current declining volume during pullbacks suggests this is likely a profit-taking phase or standard correction, not bearish capitulation. Keep monitoring RSI, volume profile, and price closes for the next actionable opportunity.
Can #GALA Sustain the Current Bullish Momentum or Will it Fall?Yello, Paradisers! Is this #GALA pullback just a healthy retest before another explosive rally, or are we about to see a deeper drop that will wipe out impatient bulls? Let’s break it down:
💎After weeks of trading inside a descending channel, #GALAUSDT finally broke above the descending resistance, sparking renewed bullish momentum. The breakout has pushed the price toward the $0.020 zone, but now #GALA has encountered a resistance zone (previously support). The question remains: will GALA maintain this level or revisit lower supports before proceeding higher?
💎The current structure shows #GALAUSD attempting to convert its previous resistance into new support around $0.018–$0.020. A clean retest of this support zone would significantly increase the probability of a sustained bullish continuation. The 50EMA acting as support and positive macro trend in crypto market reinforces our bullish bias.
💎If buyers remain in control, the first upside target is the moderate resistance at $0.0253. However, the major profit-taking and strong selling pressure are expected near the $0.0312 zone, where the strongest resistance lies. A successful break and hold above this level would confirm a more aggressive bullish trend.
💎On the flip side, the bullish setup becomes invalid if #GALA loses the strong demand zone at $0.0162–$0.0134. A confirmed close below $0.0134 would flip the structure bearish and open the door for another leg down.
Stay patient, Paradisers. Let the breakout confirm, and only then do we strike with conviction.
MyCryptoParadise
iFeel the success🌴

BTCUSD Analysis – Supply Pressure vs Demand Rejection 📊 Overview:
This BTCUSD 2-hour chart is giving us a clear structure of how price is currently reacting between a strong demand base and a descending trendline supply. We're at a critical decision point, where both buyers and sellers are gearing up for a potential breakout or breakdown. Let’s break it down level by level.
🟢 Demand Zone – Major Support Holding Firm
The Major Support Zone marked at the bottom of the chart is not just any random area—it has been tested multiple times and acted as a launchpad for bullish moves previously. This is also aligned with the Previous Reversal Zone, which adds confluence to this demand base.
Price dipped into this zone and immediately rejected with strong bullish candles, showing aggressive buyer interest.
This is a high-probability area for long setups as long as price stays above it.
You’ve noted on the chart: “If market closes this supply, we will double it” – that makes sense because a confirmed hold above this base increases the probability of upside continuation.
🔻 Trendline & Supply Zone – The Wall Ahead
Moving up the chart, price is being pressured by a descending trendline, acting as dynamic resistance. This trendline is not just drawn for decoration—it has rejected price at least twice already, and is also intersecting with a minor horizontal resistance zone.
This creates a confluence of resistance, making it a tough wall for buyers to break through without strong volume.
You’ve labeled it as “Evidence 1”, meaning the first confirmation of supply reacting here.
If BTC fails here again, we could easily see another pullback to the 116,800 – 116,400 range.
⚖️ QFL Pattern in Play
The QFL (Quick Flip Logic) is in action, where price aggressively dropped and formed a base, followed by a sharp move up. Price is now attempting to return to that base (demand zone) for a potential flip back upward.
If QFL holds and price breaks above the trendline, this will be a strong reversal confirmation.
This aligns with many institutional trading strategies which look for such formations near support zones.
📈 Potential Bullish Scenario:
Break above the descending trendline resistance
Price sustains above Minor Resistance Zone (around 118,800 – 119,600)
Next target: Major Resistance Zone between 120,800 – 121,200
This could create a higher-high structure and resume overall bullish trend
📉 Potential Bearish Scenario:
Failure to break the trendline
Rejection leads to price retesting the Major Support
If that zone breaks cleanly (especially below 116,400), price may drop toward 115,600 or lower
This opens up a possible short opportunity depending on price action and momentum
🎯 Conclusion:
This chart is a textbook example of consolidation between major zones. Bulls are defending hard at the bottom while bears are pushing down from the top. The direction of the breakout will dictate the next major move. Until then, wait for confirmation, avoid early entries, and let the market show its hand.
🧠 Patience = Profits.
🕒 Chart Timeframe: 2H
📌 Strategy in Focus: Supply & Demand Zones, Trendline Breakout, QFL Base Pattern
📍 Sentiment: Neutral-Bullish (Watching Trendline Reaction)

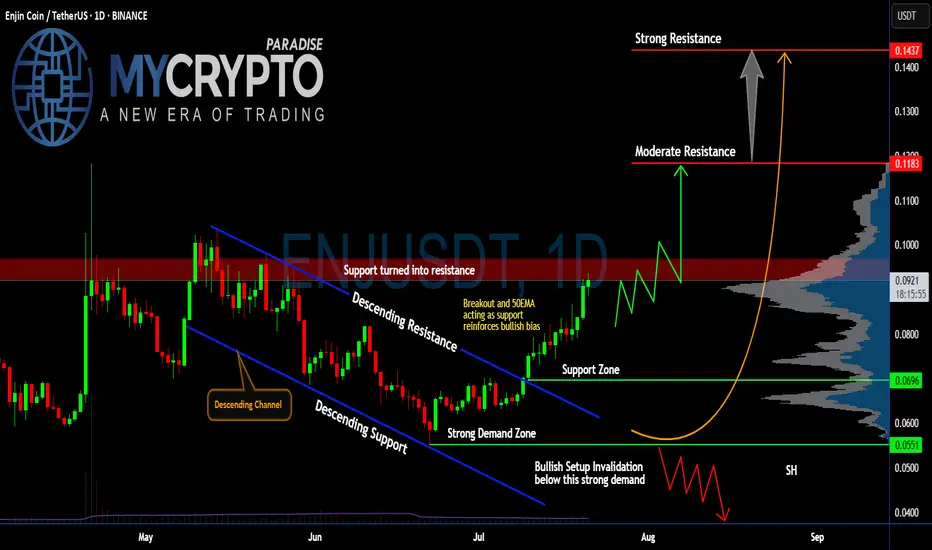
Will #ENJ Soar Further or a Trap is Set Ahead? Watch Closely Yello, Paradisers! Is this breakout on #ENJUSDT the start of a strong bullish reversal, or just another trap before a brutal flush to shake out late buyers? Let’s break it down:
💎After weeks of bleeding inside a clear descending channel, #EnjinCoin has finally broken out of the descending resistance, showing the first real bullish momentum in a while. Price is currently trading around $0.0917, with the 50EMA now acting as fresh support—this adds weight to the bullish bias for #ENJ.
💎If bulls can break above the resistance zone (previously support) between $0.091 and $0.096, we could see a push toward the moderate resistance at $0.1183. That’s the first major hurdle where sellers are expected to step in. A clean breakout above this level would open the door for a larger move toward the strong resistance at $0.1437, where a heavy supply zone sits, and profit-taking will likely accelerate.
💎The strong demand zone between $0.0551 and $0.0696 has been respected multiple times in the past, with aggressive buying every time price dipped into it. This is classic accumulation behavior, which often precedes stronger impulsive legs up—if volume keeps supporting this move.
💎But don’t get trapped, Paradisers. If the price breaks back below $0.0696 and especially loses the strong demand at $0.0551, the bullish setup for #ENJUSD will be invalidated. That would likely trigger a deeper correction, pushing us back toward $0.04. We’ll wait patiently for the next high-probability setup before taking any new positions.
Stay patient, Paradisers. Let the breakout confirm, and only then do we strike with conviction.
MyCryptoParadise
iFeel the success🌴
BTC Weekly Recap & Outlook 20/07/2025📈 BTC Weekly Recap & Outlook
Market Context:
Price continued its bullish momentum, fueled by institutional demand and supportive U.S. policy outlook.
We captured solid profits by following the game plan I shared earlier (see linked chart below).
🔍 Technical Analysis
✅ BTC made a strong bullish move, breaking into new all-time highs.
📊 The daily RSI entered overbought territory, which signaled the potential for a short-term retracement or consolidation.
Currently, price is ranging, and RSI is cooling off. That tells me the market is likely building energy for the next leg up — but not before a significant liquidity run.
🎯 Game Plan
I'm watching for one of two potential setups:
1️⃣ Liquidity Sweep to the Downside
- A run of the daily swing low
- Into the most discounted range (0.75 Fib zone)
OR
2️⃣ Tap into the Weekly FVG Zone (marked with the purple line)
Either move would create the liquidity and energy needed to fuel a breakout above the equal highs (EQHs) marked by the black line.
🚀 Target
First Target: EQHs (Black Line)
Second Target: Price Discovery (new ATHs)
💬 Let me know your thoughts or drop your own chart ideas below!
📌 Follow for Weekly Recaps & Game Plans
If you found this useful, make sure to follow for weekly BTC updates, market outlooks, and detailed trade plans based on structure and liquidity.

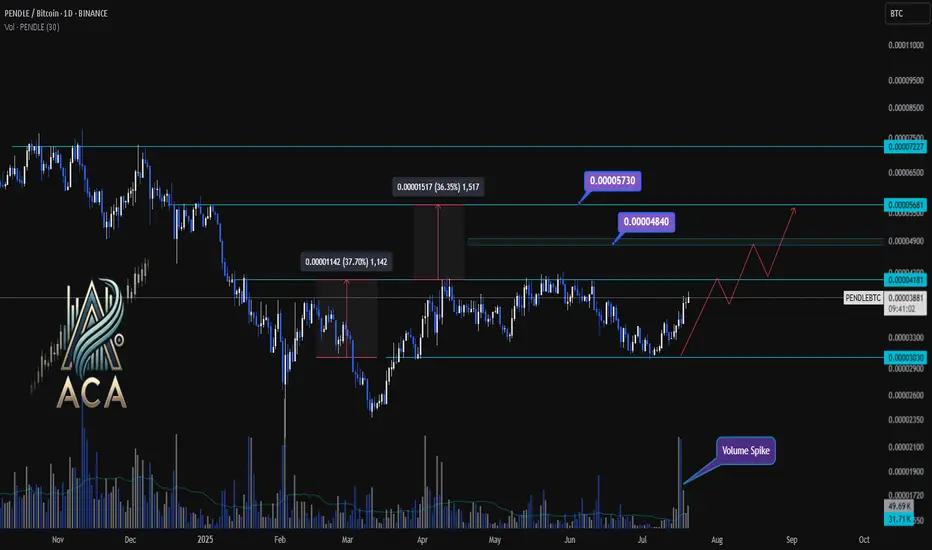
PENDLEBTC 1D Chart Analysis | Accumulation Breakout ConfirmedPENDLEBTC 1D Chart Analysis | Accumulation Breakout Confirmed
🔍 Technical Breakdown
PENDLE/BTC has officially broken out above a key accumulation box, confirming strength as the daily candle closed above the 0.00004181 resistance zone. This marks a significant structural shift after months of sideways consolidation.
📈 Key Observations
Accumulation Phase: The prolonged sideways structure acted as a re-accumulation range. The recent breakout suggests strong hands absorbing supply before expansion.
Breakout Momentum: Prior rallies from this region resulted in +36% and +37% moves. Similar behavior is expected if this breakout sustains.
Target Zones:
🎯 First Target: 0.00004840 (mid-range resistance)
🎯 Extended Target: 0.00005730 (macro resistance)
📊 Volume Spike confirms genuine breakout demand. If BTC remains stable, PENDLE may repeat its historical rally patterns toward the upper resistance zones.
🚀 Conclusion
With a clean close above the range high and confirmed volume, PENDLE/BTC appears poised for further upside. Momentum traders may eye pullbacks into 0.00004180 as potential entries.