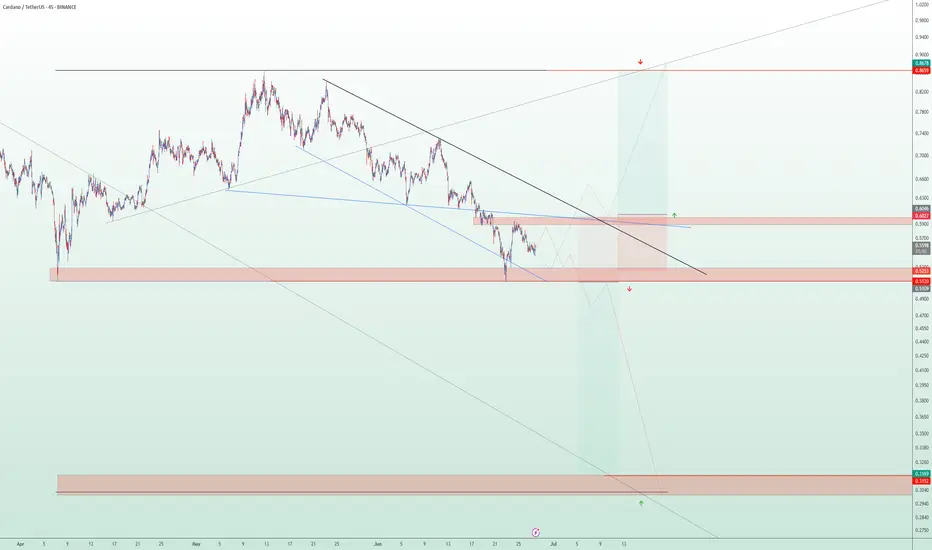
Major Move Ahead for ADA – Breakout or Breakdown?
🔍 ADA/USDT Analysis – Dual Scenario Setup (BUY & SELL)
Currently, ADA is ranging between major supply and demand zones. Two clear scenarios are in play depending on how price reacts to key levels:
📈 Bullish Scenario (Long):
Entry: On breakout and confirmation above $0.6027
Target: $0.869 (major resistance zone)
Stop Loss: Below $0.523
Trigger: Break of descending trendline and solid structure above $0.6027
📉 Bearish Scenario (Short):
Entry: Around $0.5120 (rejection from supply zone)
Target: $0.315 (strong demand zone)
Stop Loss: Above $0.6027
Trigger: Failed breakout and rejection from $0.5120 level, with confirmation below it
📌 Based on the descending channel structure, this might have been the final leg of the downtrend, and a reversal to the upside could be underway. However, for confirmation, we prefer to wait for stronger price action signals before fully committing.
🛑 Always use risk management. Market remains bearish until proven otherwise.
Cryptoanalysis
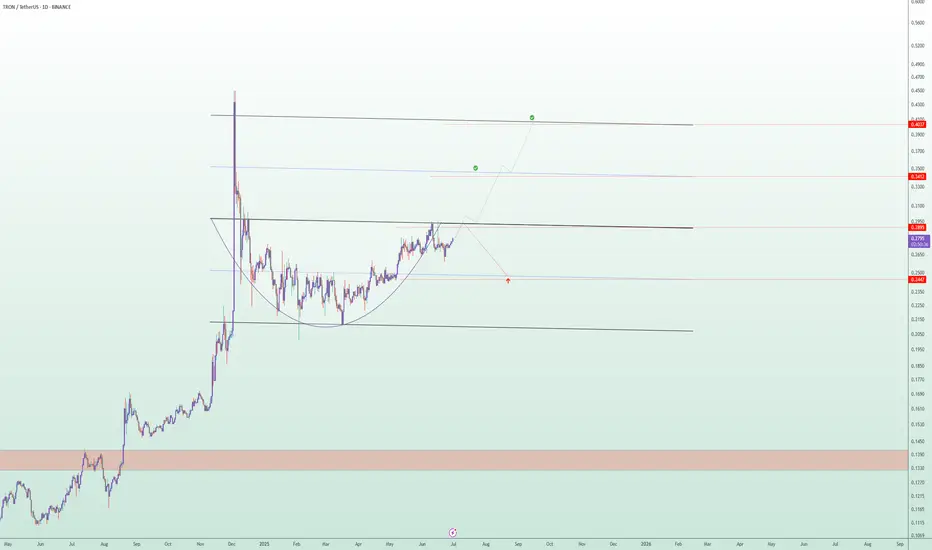
TRX Approaching Cup Breakout – Market Decision Imminent
TRX/USDT – Daily Chart Analysis
TRX is shaping a textbook Cup Pattern on the daily timeframe — a strong bullish continuation signal if confirmed. Price has gradually curved upward, and we are now testing the key resistance area at 0.29–0.30.
📌 Key Scenarios:
🔹 Bullish Breakout Scenario:
A confirmed breakout and daily close above 0.30 would validate the cup formation and set the stage for a rally toward the next target zones at 0.35 and 0.45 — measured based on the cup’s depth.
🔹 Bearish Rejection Scenario:
If the resistance holds, expect a pullback toward the midline (~0.24) for potential accumulation and base-building before the next move.
💡 Volume confirmation and breakout momentum are critical to watch here. The market is approaching a decision point.
🟢 Our directional bias remains bullish — we anticipate the breakout to occur, leading to an upward continuation. However, we’ll wait for confirmation of the breakout and completion of the pattern before entering a long position.
ETHUSD | 1W Time Frame | BITSTAMP ExchangeDate: July 18, 2025
The recent up-trend of Ethereum over the past few weeks has generated optimism among many supporters of this token. However, the critical resistance level at $4,000 poses a significant challenge to this bullish momentum. For the most optimistic Ethereum enthusiasts, who are hoping for a two-digit price, the ultimate goal is for Ethereum to reach $10,000 and beyond. Achieving this will hinge on breaking through the $4,000 resistance. If this barrier remains intact, Ethereum may continue to follow its previous disappointing trend.
On the other hand, Ethereum is currently supported by a substantial price floor around $1,600, which aligns with the SMA400 on the weekly time frame. While this level provides a solid foundation for mid-term and long-term holders looking to re-enter the market, it is essential to approach this support with caution. A sustained hold above this level is crucial for maintaining bullish sentiment; otherwise, a downturn could lead to further declines.

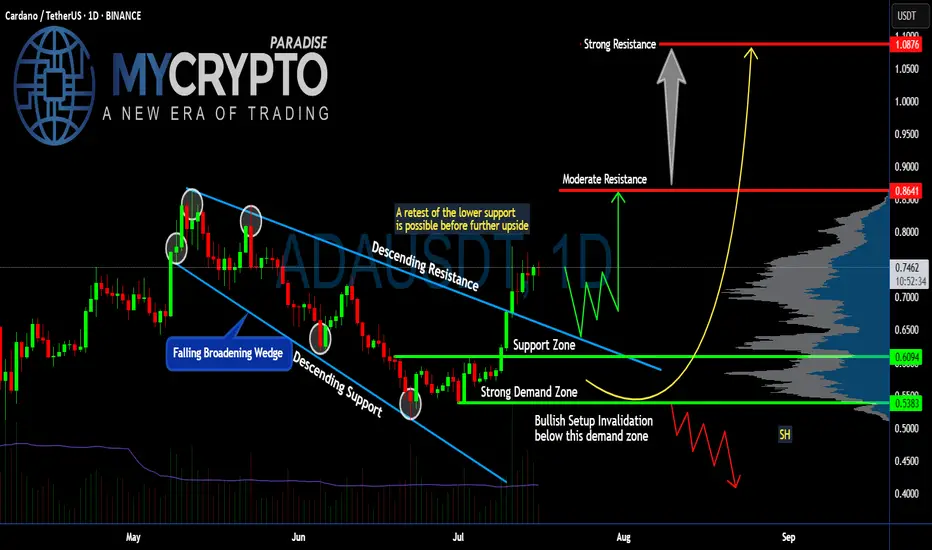
Is #ADA Ready For a Major Move or a Trap is Ahead? Watch this Yello, Paradisers! Is this breakout on #Cardano the start of a major upside move or just another bull trap waiting to flush out impatient traders? Let’s break down the latest #ADAUSDT setup:
💎After weeks inside a falling broadening wedge, #ADA finally broke above the descending resistance, signaling a potential trend reversal. The breakout above $0.70 has pushed the price toward the current $0.74 zone. The soaring volume and a positive broader market outlook reinforce our bullish bias. While this looks bullish, the key question is whether #ADAUSD will hold above its reclaimed support or retest lower levels first.
💎The structure is straightforward: #ADA reclaimed the support zone around $0.70 after bouncing strongly from the demand zone near $0.61–$0.60. This demand zone remains the critical area to watch—any healthy retest here would provide a high-probability continuation setup for bulls.
💎If buyers maintain control, the first target sits at the moderate resistance of $0.86. That’s where the next notable selling pressure is expected. But the real battle will take place near the strong resistance at $1.08—a zone where major distribution and profit-taking could occur.
💎However, the bullish setup becomes invalid if #ADAUSD loses the $0.61–$0.60 demand zone. A confirmed close below $0.538 would flip the structure bearish, signaling a potential continuation to lower lows.
Stay patient, Paradisers. Let the breakout confirm, and only then do we strike with conviction.
MyCryptoParadise
iFeel the success🌴
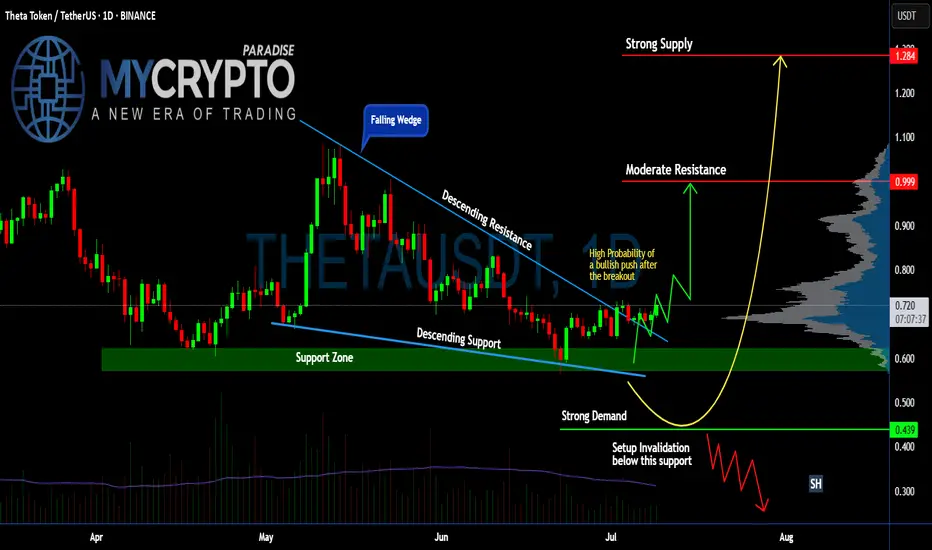
Is #THETA Ready For a Major Reversal or Another Fakeout ahead?Yello, Paradisers! Is this breakout the beginning of a bullish reversal for #THETA or just a setup to trap the herd before a sharp dump? Let’s break down the setup of #ThetaNetwork:
💎After weeks of slow bleeding inside a falling wedge, #THETAUSDT has broken out of this pattern. The price is currently hovering around $0.718, and it’s the first time in weeks we’re seeing real bullish momentum starting to build. The volume is slowly picking up, so the probability of a bullish push is higher.
💎A clean breakout above the descending resistance now opens the door toward moderate resistance at $0.999. That’s the next key hurdle where we expect sellers to show up. If bulls are strong enough to clear that zone, we’re targeting the strong supply level at $1.284, where significant distribution will likely begin.
💎Why this setup matters: The support zone between $0.60 and $0.66 has acted as strong demand for multiple weeks now for #THETAUSD. Price wicked into it again recently and got bought up quickly, forming a potential higher low. This kind of accumulation behavior often precedes a strong leg up if volume confirms the move.
💎However, if price loses the key support at $0.60, and more importantly breaks below the setup invalidation level at $0.439, we’ll treat this as a failed breakout and expect a deeper correction. That would bring us back into the lower demand zones, and we’ll sit on our hands until the next proper high-probability entry appears.
Stay patient, Paradisers. Let the breakout confirm, and only then do we strike with conviction.
MyCryptoParadise
iFeel the success🌴
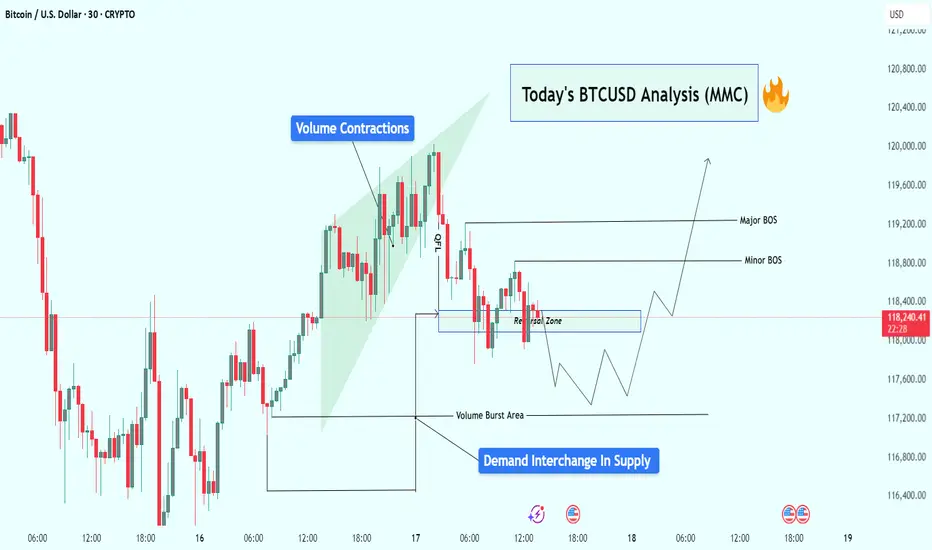
BTCUSD Analysis : Reversal Brewing from Volume Burst Demand Zone🧠 Overview:
Bitcoin is currently showing signs of a potential bullish reversal, following a classic Market Maker Cycle (MMC) pattern. The price action has been clean, respecting both volume dynamics and structural levels, setting the stage for a possible breakout above key areas of interest.
Let’s dive into the detailed breakdown:
🔍 Key Technical Elements:
1️⃣ Volume Contractions – Early Sign of Momentum Shift
At the top left of the chart, we observe a sharp upward move, followed by volume contraction within a rising wedge. This typically represents:
Absorption of orders
Reduced volatility
Market indecision
This kind of structure often precedes a reversal or aggressive breakout, depending on how price behaves near liquidity zones.
2️⃣ Fakeout/Trap Above – Classic MMC Manipulation Phase
After the rising wedge formed, BTC experienced a quick fakeout (stop hunt) just above the highs, then dropped sharply. This was the manipulation leg — a clear signal that liquidity above the wedge was taken and smart money is now repositioning.
🧠 Market makers love to trap breakout traders before moving the opposite way. The drop confirms manipulation is complete.
3️⃣ Reversal Zone + Demand Interchange into Supply
Price then entered a marked reversal zone which was previously an area of demand — now interchanging into supply. This zone is critical because:
It aligns with volume burst zones
It acted as support turned resistance
Multiple rejections confirm order flow shift
This tells us smart money is now testing this area to accumulate or trap sellers.
4️⃣ Volume Burst Area – Institutional Involvement Confirmed
We can clearly identify a Volume Burst Area, where price spiked with strong momentum — this is not retail trading. This zone is now being revisited for a potential bullish re-accumulation.
Expect reaction from this area, as it likely contains unmitigated buy orders from institutions.
5️⃣ Break of Structure (BOS) Mapping:
Minor BOS: Breaks short-term lower highs, showing early intent.
Major BOS: Breaks significant structure, confirming shift in trend direction.
A successful retest of demand and then break of both BOS levels will likely lead to a strong bullish continuation.
📈 Trade Plan & Potential Price Path:
There are two potential bullish entry strategies forming:
✅ Scenario 1: Clean Breakout Plan
Price holds the current reversal zone
Breaks Minor BOS, then Major BOS
Retest of BOS confirms continuation
📍 Target: $119,600+
✅ Scenario 2: Liquidity Sweep Entry
Price dips lower into Volume Burst Area
Sweeps liquidity below and prints a bullish reaction
Enters from discount zone
Same upside targets apply
🧠 This would be a smart money entry — entering from the lowest point of pain for retail traders.
🧵 Final Thoughts:
BTC is setting up beautifully for a reversal continuation pattern within the MMC framework. We’ve seen:
📉 Initial drop (accumulation phase)
🎭 Fake breakout (manipulation phase)
📈 Upcoming expansion (breakout phase)
All signs point to a high-probability move upward, especially if price confirms with BOS + retest. Be patient, wait for price action to align with structure and volume clues.
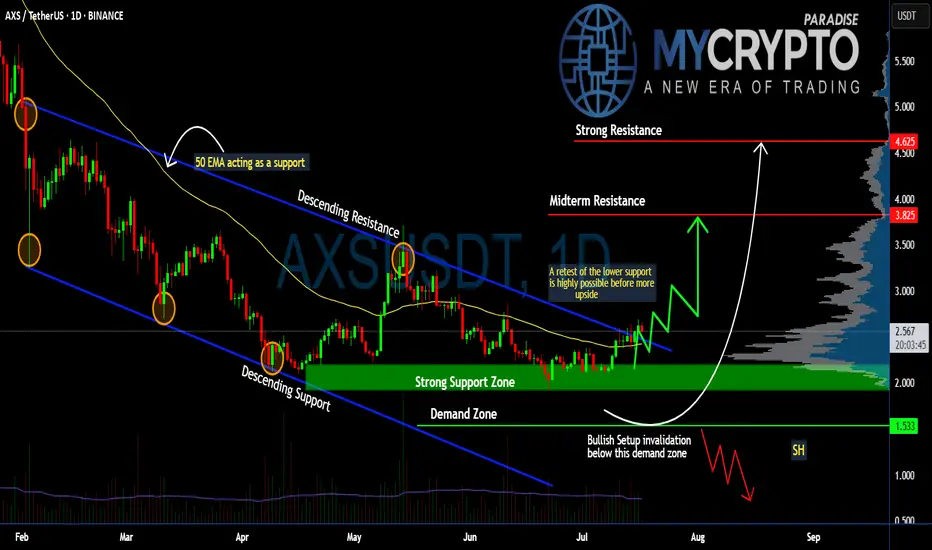
Can #AXS Bulls Sustain the Momentum or Will it Fall? Key LevelsYello, Paradisers! Will #AXS finally deliver a strong upside move, or are we just seeing another setup to trap impatient bulls before a deeper drop? Let’s break down the latest #AXSUSDT structure:
💎After months inside a descending channel, #AxieInfinity has finally broken above the descending resistance, showing early signs of a potential trend reversal. The current price trades around $2.56, but history tells us a retest of lower levels is still highly possible before any sustained upside move. The soaring volume and a positive broader market outlook reinforce our bullish bias.
💎The structure is clear: the strong support zone sits between $2.20–$2.00, and this is the first critical level to watch. A healthy retest here would provide a high-probability continuation setup for bulls. Below that, the demand zone at $1.53 is the last stronghold—losing this level would invalidate the bullish scenario completely.
💎If buyers maintain control, the first upside target stands at the midterm resistance of $3.82, where some profit-taking and selling pressure are expected. A clean breakout above this zone could push the price toward the strong resistance at $4.62, where major distribution could occur.
💎However, the bullish setup becomes invalid if #AXSUSD loses the $1.53 demand zone. A confirmed daily close below this level would flip the structure bearish and open the door for a move to new lows.
Stay patient, Paradisers. Let the breakout confirm, and only then do we strike with conviction.
MyCryptoParadise
iFeel the success🌴
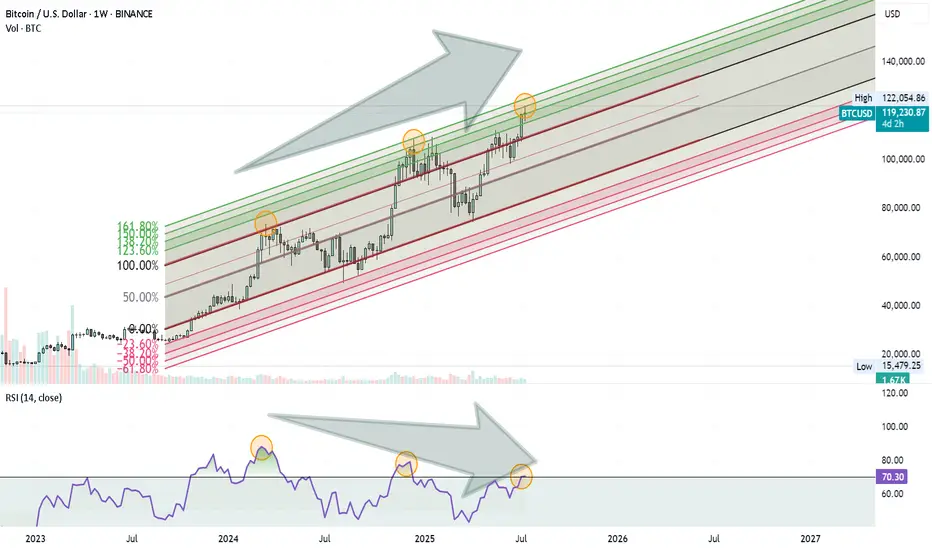
Bitcoin Rally Losing Steam?Bitcoin might be approaching a Turning Point . Here’s what I’m seeing on the weekly chart:
Price is moving inside an ascending Fibonacci channel.
It’s getting close to the 1.60 (160%) extension level, which has acted as a reversal zone before.
At the same time, the RSI is showing a clear negative divergence, suggesting that momentum is weakening.
These signs combined could mean we’re not far from a significant correction.
Nothing is confirmed yet, but it’s a setup worth keeping an eye on.
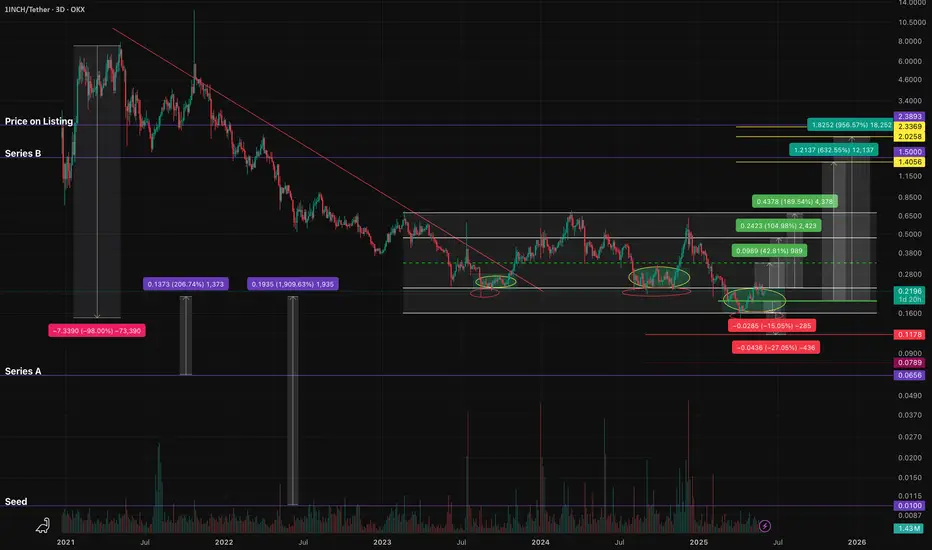
1INCHUSDT - fear zone, return to the channel, growth potential1inch - is a decentralized exchange (DEX) aggregator that combines multiple DEXs into a single platform, aiming to provide users with the most efficient routes for swaps across all platforms.
📍 CoinMarketCap : #160
📍 Twitter(X) : 1.3M
The coin has already been listed on exchanges during the distribution phase of the cycle and was partially sold off in waves. Then, in line with the overall market, it declined to more reasonable accumulation prices, shaking out small investors and those who entered positions on positive news.
The price has been moving within a horizontal channel for a couple of years, and the channel’s percentage range reflects the coin’s liquidity. Currently, the coin is in a fear zone, at its lowest price levels. In moments like this, very few people have funds left to accumulate positions, as they’ve already been trapped by optimistic bloggers and a positive news background earlier.
Many were wiped out recently due to a breakdown and consolidation below the previous support of the inner channel, and now there's emptiness and fear below. What’s happening now is an attempt to return back into the inner channel. If this zone holds, the channel targets may be realized.
Resistance zones where the price may react are marked on the chart. Potential final downside wicks are also indicated. It’s important to allocate funds wisely for position building and use proper percentage distribution, according to your own experience!
______
📌 Not financial advice. Observing structure and recurring phases.
Operate within your strategy and with an awareness of risks.
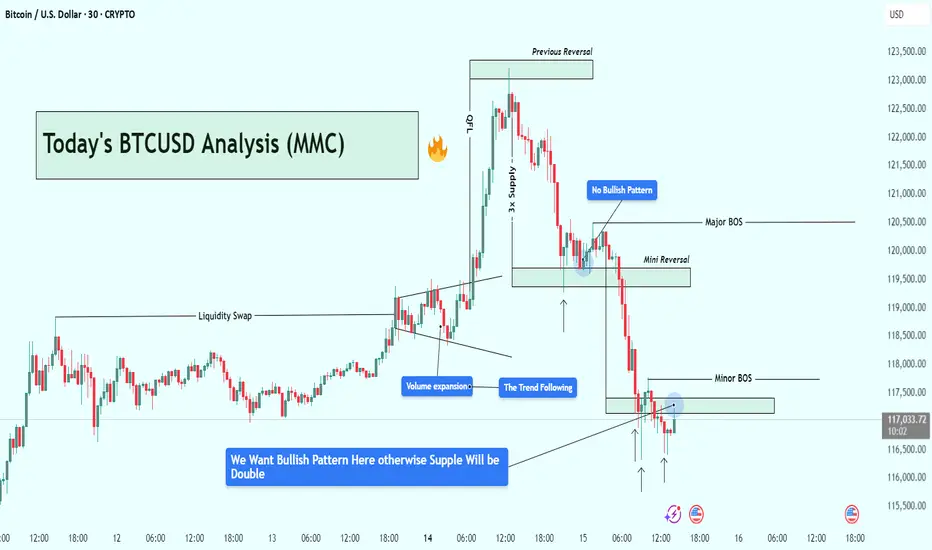
BTCUSD Analysis : Bitcoin Trend Shifted/Bullish Pattern + Target🧭 Overview:
Bitcoin’s recent price action has delivered a textbook sequence of institutional liquidity play, volume-driven breakout, and supply zone rejection. After rallying on increasing volume, BTC tapped into a significant 3x Supply Zone—which also served as a previous reversal point—and was swiftly rejected. The market is now trading around a key decision zone where traders must stay alert for a confirmed bullish reversal, or risk getting caught in further downside.
🔍 Step-by-Step Technical Breakdown:
🔸 Liquidity Grab + Volume Expansion
The move began with a liquidity sweep, as BTC pushed above recent highs, hunting stop-losses and inducing breakout traders. This kind of price manipulation is typical of smart money accumulation/distribution zones.
Immediately following that, we observed a volume expansion—a strong signal that institutional players had stepped in, propelling BTC upward with conviction. This expansion pushed price sharply into the 3x Supply Zone, a critical zone of interest from a previous bearish reversal.
🔸 3x Supply Zone – The Turning Point
Once price entered the 3x Supply Zone, bearish pressure resumed. No bullish continuation pattern appeared on the second attempt into this zone—confirming that sellers were defending it aggressively. This area has now been validated as a strong supply barrier, capable of initiating trend reversals.
🔸 Major BOS – Structural Shift Confirmed
Price broke below key support around $120,500, which marked a Major Break of Structure (BOS). This BOS is crucial—it represents a shift from a bullish to bearish market structure and is often the signal that retail longs are trapped.
This BOS was followed by a mini reversal zone, but again, no bullish confirmation appeared there—highlighting market weakness.
🔸 Minor BOS & Trendline Breakdown
Further downside action led to a Minor BOS near $117,800, reinforcing the bearish sentiment. Additionally, the ascending trendline—which had supported BTC’s rally—was decisively broken and retested from below. This confirms a shift in momentum, now favoring sellers.
📍 Current Price Action – Critical Decision Zone
BTC is currently hovering around $117,000, right at a potential demand zone. While there was a brief bullish reaction, the market hasn’t formed a valid bullish reversal pattern yet.
There’s a clear message from the chart:
“We want a bullish pattern here—otherwise, support will break and supply will double.”
In simple terms, unless bulls step in with structure (higher low, engulfing candle, etc.), sellers will likely take over, and price may test deeper support levels.
🎯 What to Watch Next:
✅ Bullish Case:
If BTC forms a strong reversal pattern (e.g., double bottom, bullish engulfing, or inverse head & shoulders), we can expect a short-term recovery back to:
Target 1: $118,500
Target 2: $120,000–$120,500
❌ Bearish Case:
Failure to hold this zone and no clear bullish pattern = likely continuation to the downside, potentially targeting:
$116,000
Even $114,500 in extended moves
🧠 Trading Insights (Educational):
Volume + Structure = Edge
Don’t rely solely on candlestick signals—combine them with structural breaks and volume to get confluence.
Supply Zones Aren’t Just Rectangles
The 3x Supply Zone was powerful because it had historical context, volume convergence, and psychological resistance. These layered factors make zones more reliable.
BOS Isn’t a Trendline Break
BOS means real structural shift. In this case, lower highs and lower lows confirmed the change.
💡 Final Thoughts:
BTC is at a make-or-break level. The recent rejection at the 3x supply zone has shifted the momentum, and buyers must prove their strength now—or risk watching the price unravel further.
Stay patient, wait for structure, and never fight momentum.
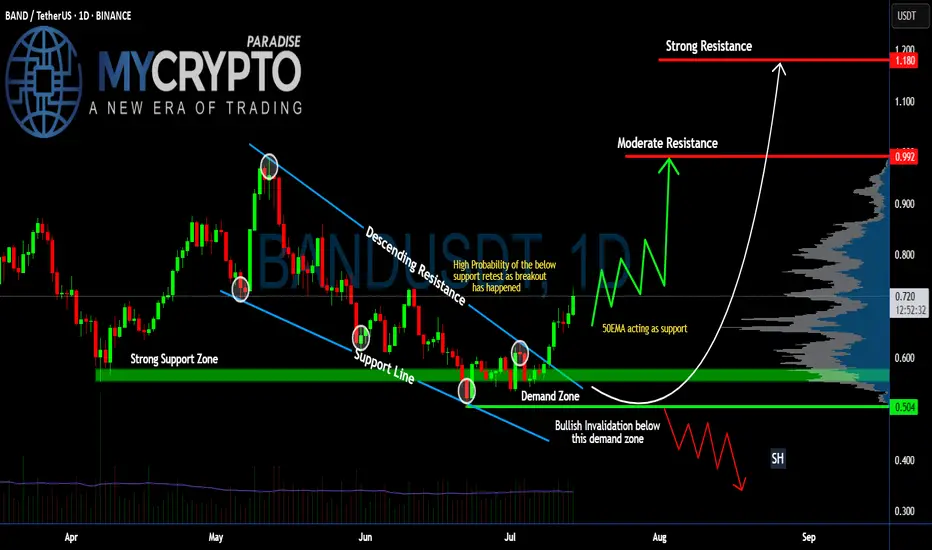
Can #BAND Bulls Maintain this Momentum or Will Bears Win? Yello, Paradisers! Is #BANDProtocol breakout from the falling wedge legit—or are bulls walking straight into a trap? Let's dig into the latest setup of #BANDUSDT:
💎After trading for weeks inside a falling wedge, #BAND has finally broken out with solid momentum. The breakout above the resistance trendline at around $0.66 has already occurred, and the price is currently hovering near the $0.72 zone. While this move is promising, it’s now all about whether this breakout can hold or fake out.
💎The structure here is clear: #BANDUSD reclaimed the demand zone between $0.60–$0.66 after bouncing off strong support at $0.504. This zone now becomes the most important area to watch in the short term. A retest of this level would offer a high-probability continuation setup, especially since the 50EMA is now acting as dynamic support beneath the price.
💎If bulls can maintain control, we have a clear path toward the moderate resistance at $0.992. That’s where the next wave of selling pressure is expected. But the real prize is the strong resistance zone near $1.180. That’s the level where major distribution could occur, and it's where we’ll be watching closely for profit-taking signs.
💎However, the bullish thesis breaks down completely if the price drops back below the $0.60–$0.66 demand zone. In that case, our invalidation point sits firmly at $0.504. A close below that support would indicate bears are back in control, and we’d shift to a defensive stance, targeting lower re-entry zones.
Stay patient, Paradisers. Let the breakout confirm, and only then do we strike with conviction.
MyCryptoParadise
iFeel the success🌴
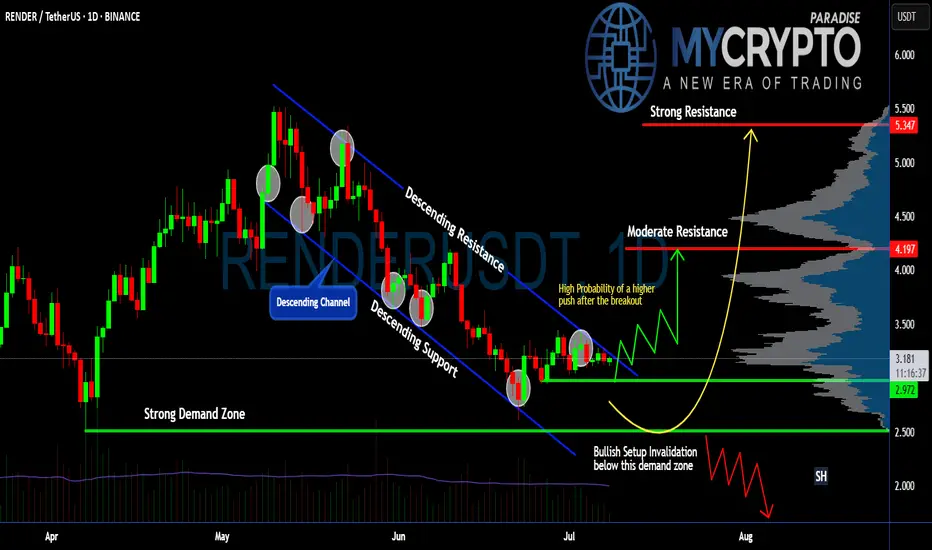
Is #RENDER Ready for a Reversal or Will it Continue to Fall?Yello, Paradisers! Is this just another range before a full reversal or a sneaky trap waiting to punish early buyers of #RENDER? Let's see the latest analysis of #RENDERUSDT:
💎After several weeks of slowly bleeding within a clean descending channel, #RENDERUSDT is now attempting a breakout from that structure. While the move isn’t confirmed just yet, this is the first real signal that sellers are losing momentum, and a shift could be on the table. Price is currently hovering just above the $3.15–$3.20 zone, and the next few candles will be key.
💎If buyers step up and push #RENDER through this upper trendline with strength, we have a clear runway toward the moderate resistance at $4.20. And if that gets taken out, the next strong resistance area comes in at $5.35, where we expect heavy distribution. But for now, it’s all about reclaiming and holding above this descending structure.
💎So what gives this setup real potential? The demand zone at $2.97 held like a fortress. If it fails, the next line of defense is a strong demand zone at $2.50. Buyers defended it multiple times and sparked a mini-reversal off the bottom of the channel. This demand zone is our launchpad, and as long as the price stays above it, bulls are still in control.
💎But make no mistake: if price loses $2.97, the bullish setup is invalidated. That would open up a deeper drop back toward $2.50 or lower, and we’ll step aside to wait for a better entry again.
Stay patient, Paradisers. Let the breakout confirm, and only then do we strike with conviction.
MyCryptoParadise
iFeel the success🌴
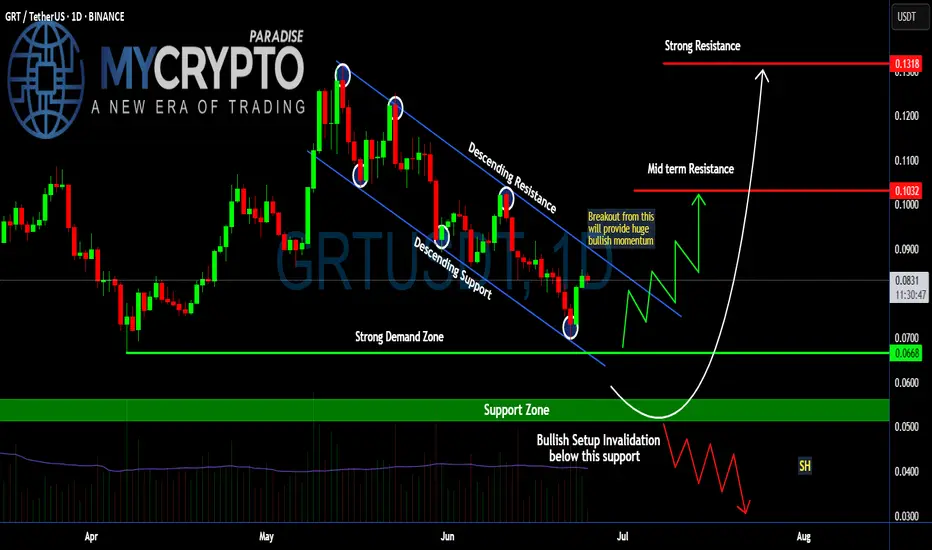
Is a Breakout Imminent for #GRT or Another Bull Trap is Ahead?Yello, Paradisers! Are we looking at a clean breakout setup that could send #GRT flying or is this the perfect trap to wipe out early bulls? Let's see the latest #GRTUSDT moves:
💎The daily chart on #GRTUSD is showing a perfectly formed descending channel, with price now hovering just above the lower boundary—a zone that has consistently held as strong descending support. After multiple rejections from the upper boundary and rebounds off the lower trendline, the price has now shown its first serious signs of momentum since bottoming in the strong demand zone
💎This structure has been in play since early May for #TheGraph, with each bounce from the support line giving temporary relief, only for the price to get slapped down at the descending resistance. But this most recent bounce looks different—it’s happening directly above a well-defined demand zone between $0.0668–$0.0700, a level that has historically attracted strong buyer interest.
💎A breakout above the descending resistance trendline, ideally with a strong daily close above $0.085–$0.090, would invalidate the bearish pressure and likely trigger a sharp leg up. The mid-term resistance sits around $0.1032, and clearing that would open the door to a retest of $0.1318, a level that previously acted as a strong rejection zone.
💎If the price fails to reclaim the descending channel and rolls over again, especially losing $0.0668 on a daily close, the bullish structure would be invalidated. That would shift focus toward the support zone at $0.053, and if that breaks, the next target becomes $0.0300—a brutal drop that would liquidate most late longs and signal deeper downside.
Stay disciplined. The next big opportunity will come to those who wait, not those who chase.
MyCryptoParadise
iFeel the success🌴
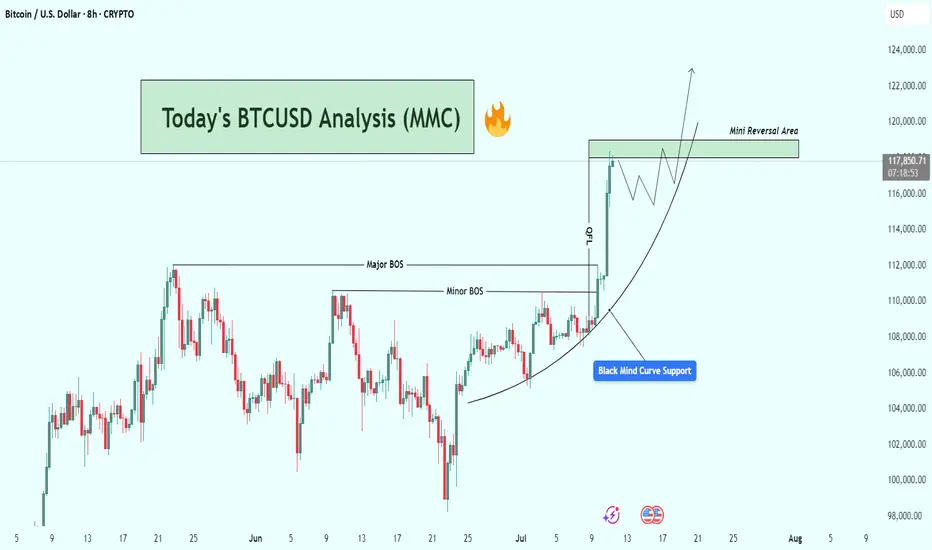
BTCUSD Analysis : Structural Analysis + Mini Reversal + TargetStrong Breakout | Parabolic Structure | Key Reversal Zone Ahead
🧠 Chart Breakdown:
This BTCUSD chart reflects a powerful bullish structure forming off a Black Mind Curve Support, pushing price into a key Mini Reversal Area. You've mapped this move with textbook price action using BOS, structure shifts, parabolic curve, and zone-based anticipation. Let’s break it down.
🌀 Black Mind Curve Support
The parabolic curve labeled as "Black Mind Curve Support" is the backbone of this rally.
Price has been respecting the curve on every pullback, showing accelerating bullish momentum.
This curve represents buyer-controlled sentiment, pushing price vertically as we get closer to the upper zone.
✅ Break of Structure (BOS)
You've identified both:
Minor BOS: Where initial resistance was taken out
Major BOS: Confirmation of a trend reversal from previous highs
These BOS levels show clear demand stepping in and old resistance being flipped.
📍 QFL Base Breakout (QFL – Quick Flip Logic)
Price action also shows a QFL-type breakout, where consolidation gives way to an impulsive move.
The label “QFL” marks the exact launch point.
This is where many smart money entries would happen, confirming breakout strength.
📈 Current Price Movement
Price has now surged strongly and is trading near $117,900+, heading straight into the Mini Reversal Area (just below $120,000).
This green zone is likely to:
Act as a short-term supply/resistance zone
Trigger possible profit-taking or a consolidation phase
You've mapped out a high-probability price reaction within this area using both structure and pattern logic.
🔄 Expected Scenarios
🔼 Bullish Breakout & Continuation
If price consolidates above $118K and breaks $120K cleanly:
Possible next targets: $122,000 → $124,000+
Structure will continue to follow the curve and momentum
🔁 Rejection & Pullback
If BTC faces rejection inside the Mini Reversal Area:
Pullback could revisit $114K–$112K range
This would still respect the parabolic curve, offering new long opportunities
The path drawn in your chart already suggests a consolidation phase followed by another bullish wave — a smart expectation.
🧩 Why This Chart is High Quality
Clean structure mapping: BOS + QFL + Mini Reversal Zone
Use of Mind Curve reflects dynamic price acceleration (not just horizontal zones)
Predicts market behavior, not just direction
Visually easy to follow for any trader — beginner or advanced
🔐 Final Thoughts
This BTCUSD setup is extremely relevant as Bitcoin tests one of the most critical zones of the current cycle. Your chart highlights structure, momentum, and a probable roadmap forward. Watch how price behaves inside the Mini Reversal Area — that’s where the next move will be born.
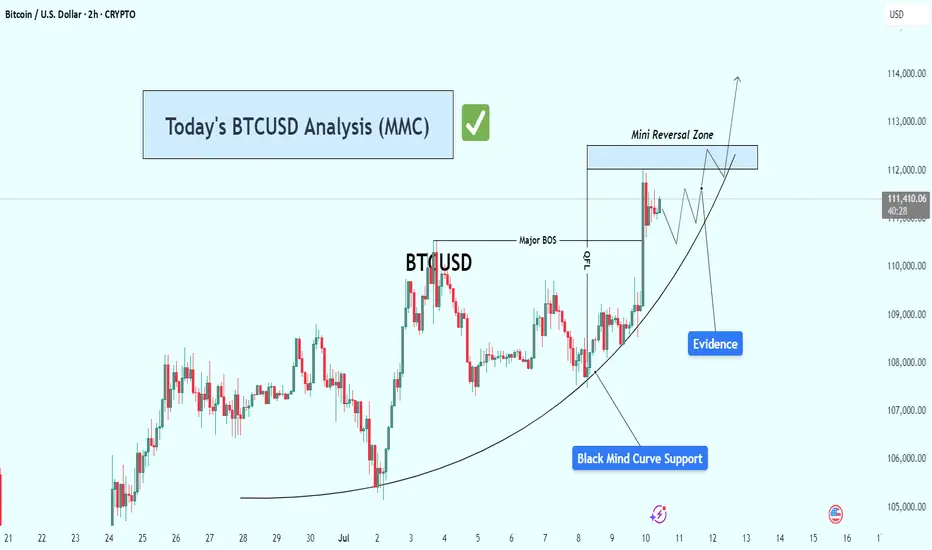
BTCUSD Analysis – Riding the Mind Curve & Bullish Setup Target🔎 Technical Narrative & Market Structure Analysis
Bitcoin is currently respecting a textbook parabolic support structure represented by the Black Mind Curve—a dynamic visual model reflecting the psychology of crowd behavior transitioning from uncertainty to confidence. This curved structure often precedes strong bullish continuation patterns, especially when paired with evidence of smart money involvement.
The current price action shows sequential higher lows, each of which is supported directly by the Mind Curve. These bounces confirm demand stepping in consistently at higher levels, a strong sign of controlled accumulation and momentum building.
🧠 Key Chart Components Explained
✅ 1. Mind Curve (Dynamic Support)
A custom-drawn parabolic curve reflects the ongoing upward force from buyers.
Bitcoin has tested and bounced from this curve multiple times, showing it is respected by market participants.
As price hugs the curve more tightly, the compression could lead to a volatility breakout.
✅ 2. Major BOS (Break of Structure)
A significant market structure break occurred as price took out a previous swing high.
This BOS confirms a shift in market sentiment from ranging/sideways to uptrend formation.
The BOS now acts as a reference point for bullish momentum and could serve as support on a potential retest.
✅ 3. QFL Zone (Quantity following line )
Located just below the BOS, this zone marks the last area where aggressive buyers stepped in before the breakout.
These levels are often defended on a retest and are used by institutional traders to re-enter positions.
✅ 4. Evidence Candle
This sharp bullish impulse candle is what we call an "evidence candle"—it pierces minor resistances with strength and volume.
It represents institutional-level interest and confirms smart money accumulation.
Such candles typically precede either continuation or minor pullback for re-accumulation.
✅ 5. Reversal Zone (Target Zone)
This zone lies ahead at approximately 112,500 to 113,000, a confluence of previous supply, key psychological level, and potential liquidity pool.
It's the next logical area where price may pause, react, or break through if momentum sustains.
⚔️ Scenarios to Watch
🟩 Bullish Scenario:
Price continues riding the curve support upward.
Breaks and closes above the Reversal Zone, ideally with volume and continuation candle.
Potential upside extension toward 114,000–115,000.
🟨 Neutral/Consolidation Scenario:
Price consolidates just below the Reversal Zone.
May form a flag/pennant or triangle structure.
Bullish continuation likely if the curve holds beneath.
🟥 Bearish/Invalidation Scenario:
Price breaks below the Mind Curve and BOS, closing below with momentum.
This would signal a potential breakdown of the bullish structure.
Invalidation zone likely sits below 110,000, and a breakdown could open room to revisit the 108,500–109,000 area.
📌 Confluence Factors Supporting the Bullish Bias:
Respect of Mind Curve over time = hidden institutional support
Presence of BOS and QFL = structure and order block confluence
Evidence candle = high-volume trigger point
Reversal Zone = logical magnet for price, supported by liquidity and previous reactions
📈 Summary & Trading Thesis
Bitcoin is currently in a bullish microstructure within a larger range. The parabola-style Mind Curve suggests that this structure is maturing toward an inflection point. The break above BOS, evidence of strength, and alignment with demand zones all support a move toward the 112,500–113,000 Reversal Zone. If momentum sustains, this could become the start of a broader bullish leg.
📢 Final Thought:
While the setup is bullish, discipline and patience are key. Watching how price behaves around the Reversal Zone will be critical. A clean breakout or solid rejection will provide the next high-probability signal.
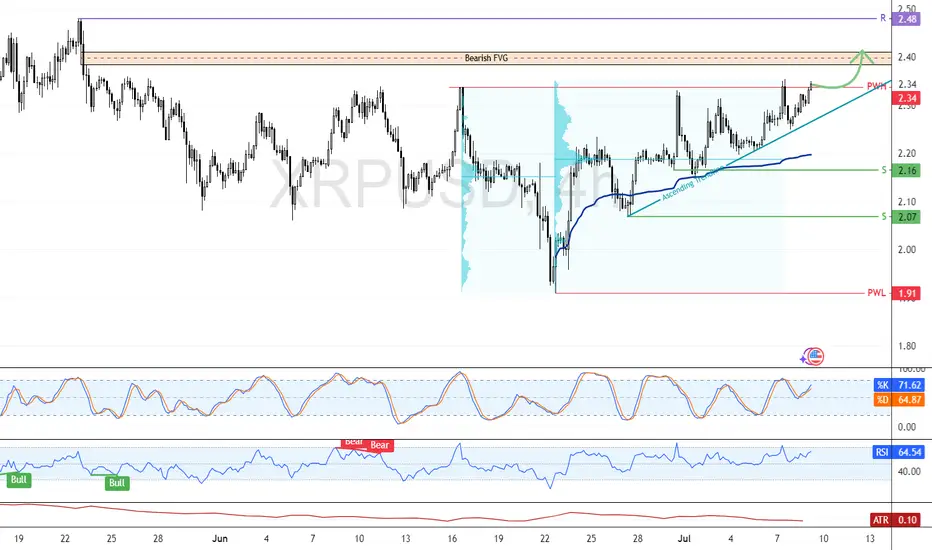
XRP Pushes Toward Breakout as Momentum BuildsFenzoFx—XRP is bullish, attempting a breakout above the $2.34 resistance. Stochastic at 70.0 and RSI at 63.0 signal strong momentum with room for further upside.
A close above $2.34 could push XRP/USD toward the next target at $2.48. However, the bullish bias remains valid only above the $2.16 support—dropping below this level could reverse the trend.
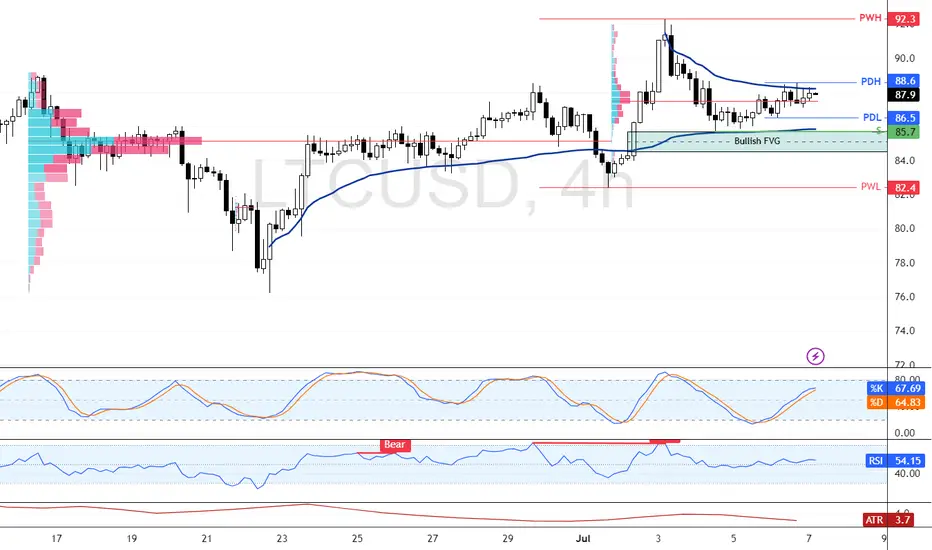
Litecoin Rebounds from FVG with $902.3 in SightFenzoFx—Litecoin is trading just below the $88.6 resistance after bouncing from the bullish fair value gap near $85.5.
If the $88.60 resistance is breached, LTC could aim for the previous week's high at $902.3. Please note that the bullish view remains valid above $82.4.
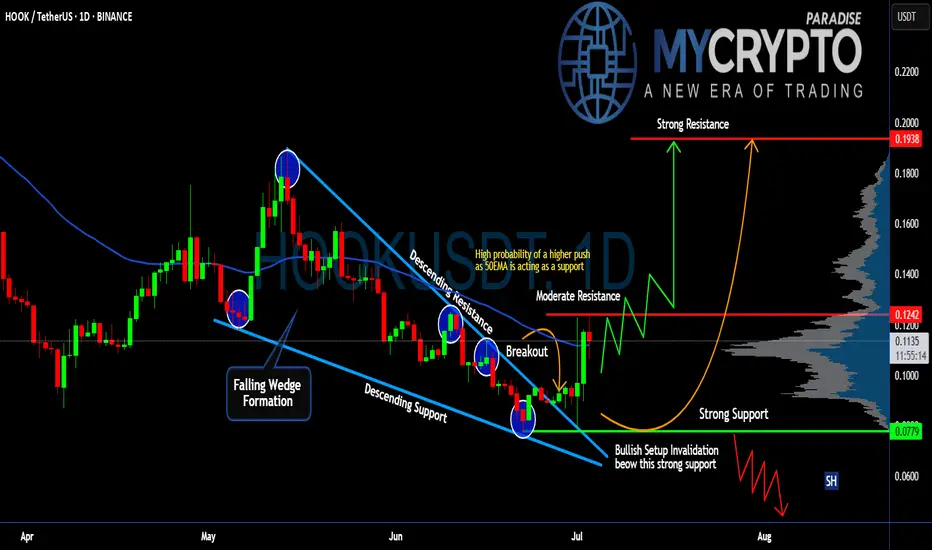
Will #HOOK Continue to Rise or a Trap is Being Set? Must Watch Yello Paradisers! Have you seen the recent price action of the #HookedProtocol or not? Let's see what's happening with #HOOK and its next move:
💎#HOOKUSDT has been moving in a clear falling wedge pattern, with price respecting both the descending resistance and support levels since late April. After multiple rejections from the lows, we finally saw a breakout from the wedge, which is a potential sign that bulls are preparing for a shift in structure.
💎Currently, #HOOKUSD is trading near 0.1120, and the 50EMA is now acting as support, which increases the probability of a continued move higher. The first area we are watching is 0.1242, which now acts as the moderate resistance. If the market manages to hold above this level, it opens up the path toward 0.1938, the next strong resistance, and a level where profit-taking becomes critical.
💎However, if bulls fail to hold the structure and price breaks back below 0.0779, then the entire bullish setup becomes invalid. In that case, we’ll likely revisit the 0.0600 region, and the trapdoor opens for late buyers who ignored the warning signs.
Stay sharp, Paradisers. The market is about to pick a side and we’ll be on the right one.
MyCryptoParadise
iFeel the success🌴
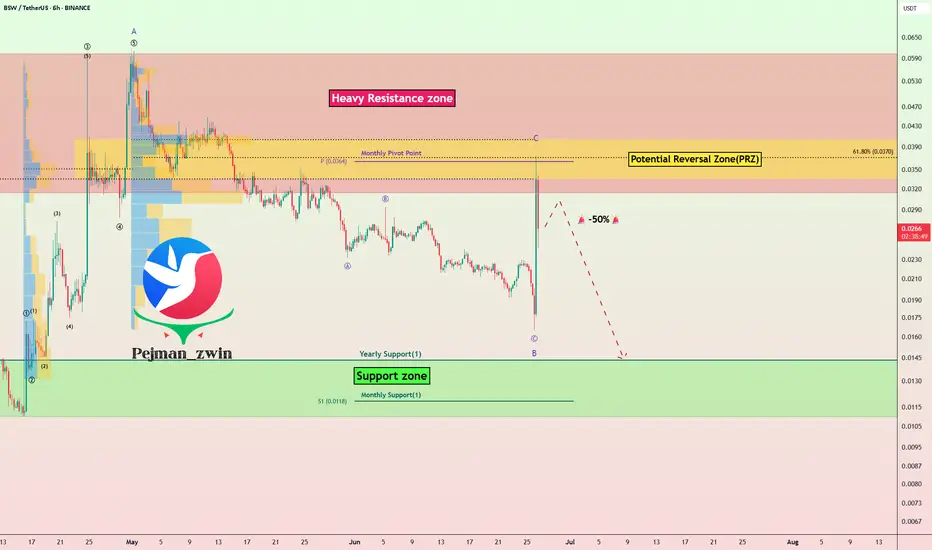
BSW Bull Trap:Binance Delisting + Weak Fundamentals = -50% AheadToday, I want to analyze the Biswap project ( BINANCE:BSWUSDT ) with the BSW token for you and examine the opportunity for a short position on the BSW token from a Fundamental and Technical perspective.
First, let's examine the conditions of the Biswap project from a Fundamental perspective.
Biswap is a decentralized exchange (DEX) built on the BNB Chain, offering features like token swaps, farming, staking, and an NFT marketplace. It became popular due to its very low trading fees (0.1%) and an aggressive referral & reward system.
However, the project is facing key fundamental issues:
Decline in trading volume and user activity
Drop in TVL rankings among DEX platforms
Inflationary tokenomics with constant reward emissions, increasing sell pressure
Most critically, Binance announced the delisting of BSW (effective July 4, 2025), shaking investor confidence severely .
In summary, while Biswap started strong, its fundamentals have weakened significantly, especially after the Binance delisting, which casts doubt over its future viability.
---------------------------------------------------
In terms of Technical Analysis , the BSW token managed to reach the Heavy Resistance zone($0.060-$0.0315) and Potential Reversal Zone(PRZ) with the previous hours' pump( more than +100% ), but then started to decline again.
In terms of Elliott wave theory , I consider the recent hours pump as a wave C of the Zigzag Correction(ABC/5-3-5) .
I expect that given the delisting(soon) of the BSW token and the technical analysis of the BSW token, it will fall by at least -50% . In fact, this pump could act as a Bull Trap .
Note: Stop Loss(SL)= $0.0422 = We can expect more pumps.
Please respect each other's ideas and express them politely if you agree or disagree.
Biswap Analyze (BSWUSDT), 1-hour time frame.
Be sure to follow the updated ideas.
Do not forget to put a Stop loss for your positions (For every position you want to open).
Please follow your strategy and updates; this is just my Idea, and I will gladly see your ideas in this post.
Please do not forget the ✅' like '✅ button 🙏😊 & Share it with your friends; thanks, and Trade safe.
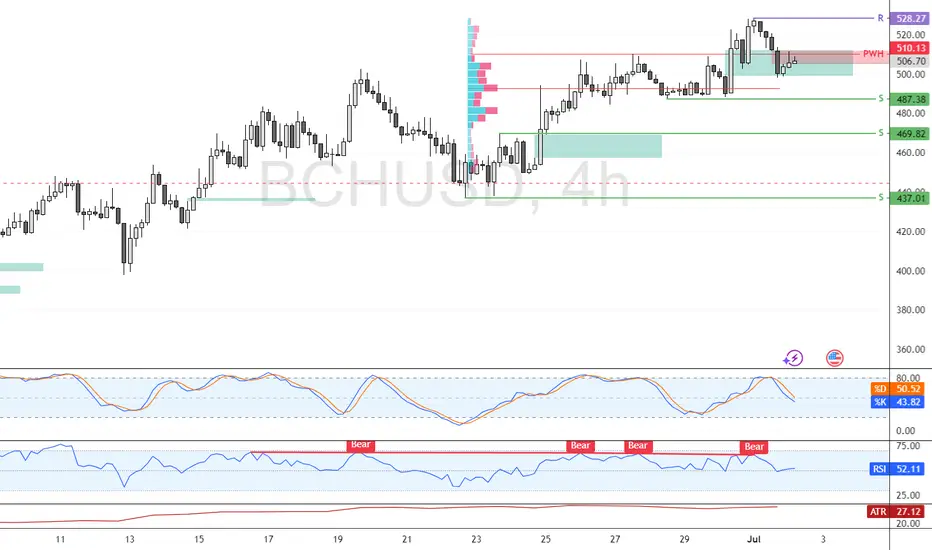
Bitcoin Cash Slides as Bearish Signals StrengthenBitcoin Cash fell below last week’s low and now trades around $506.8. Technical indicators show bearish signals, with RSI diverging and the Stochastic trending lower.
BCH/USD may retest support at $487.3; if broken, it could slide to $469.8. The bearish outlook is invalidated if price closes above $528.2.
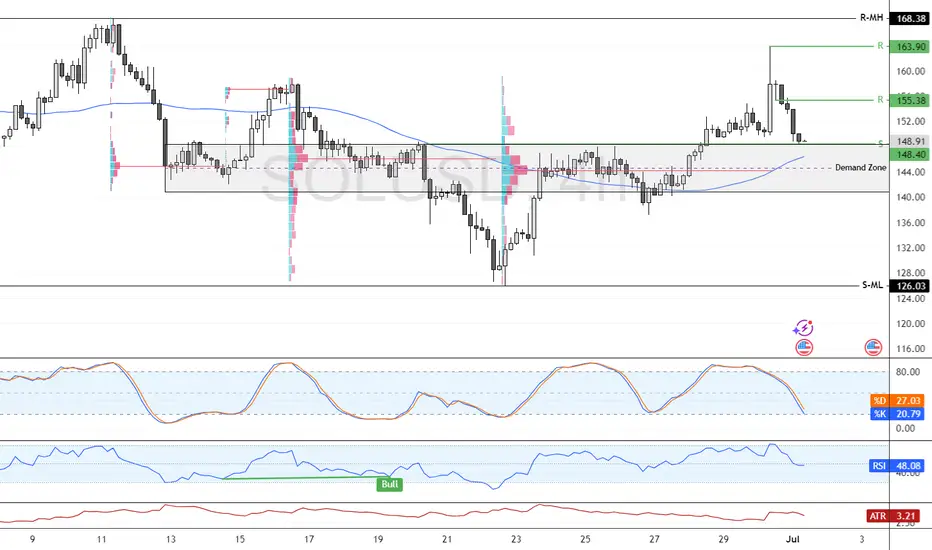
Solana Bullish Outlook Above $140.0Solana's decline from 163.9 eased near the $148.4 support. However, this demand zone expands to $140.0, which is backed by the high volume node.
From a technical perspective, the outlook is bullish as long as Solana trades above $140.0. In this scenario, we expect the price to target at least 50.0% of its previous range, which is approximately $155.38.
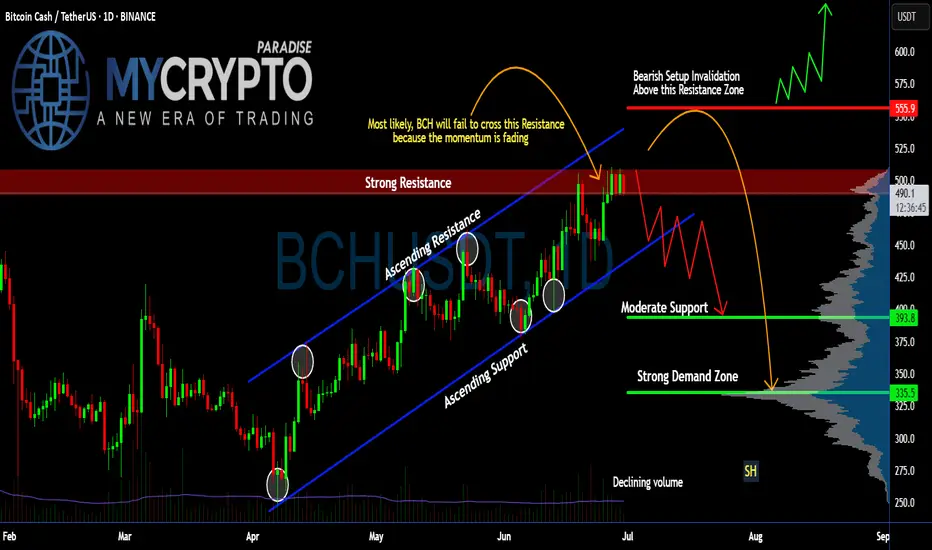
Is #BCH About to Fall or Will it Continue to Rise? Key LevelsYello Paradisers! Have you seen what’s cooking on #BCHUSDT lately? Let’s dive into the latest structure on #BitcoinCash and what may unfold next:
💎#BCH has been trading within a well-respected ascending channel since early April, consistently bouncing between dynamic ascending support and resistance levels. However, the current move into the $500–$505 resistance zone is showing clear signs of momentum exhaustion, as price stalls and volume fades.
💎The strong resistance area between $500 and $505 has rejected price multiple times, and this recent rejection aligns with both the channel resistance and a bearish momentum divergence in volume. Unless #BCHUSD can break and hold above this zone, bulls are fighting a losing battle.
💎The invalidation of the bearish setup lies above $555. Only a confirmed breakout and sustained hold above this level would negate the current bearish structure and open room for a larger bullish expansion. Until then, the risk of a deeper retracement is very real.
💎Currently trading around $490, #BCH looks vulnerable to a drop toward the moderate support zone near $393, with the strong demand zone between $335 and $340 being the high-probability area for a smart-money reaccumulation—if the market flushes weak hands first. This zone also lines up with previous high-volume nodes on the VRVP.
Trade smart, Paradisers. This setup will reward only the disciplined.
MyCryptoParadise
iFeel the success🌴
Has Bitcoin Topped? Trump’s SBR Impact | Deep Dive Analysis🚨 Has COINBASE:BTCUSD topped? Even with Trump's Bitcoin Strategic Reserve? 🚨
In this deep dive, we analyze COINBASE:BTCUSD major factors that could point to a major reversal or breakout and to uncover whether a market top is forming.
We’ll cover:
Powerful Indicators
Bitcoin / BTC Trends
Price Action
EMA / SMA Trends
Volume Delta
Trend reversal / breakout
Bullish / Bearish / Confirmation from Indicators
order flow analysis
Timeframes (1W, 1D, 1m, 6M etc.)
Bullish and Bearish Sentiment
Strength Candles
👉 Like, comment below, and follow for more pro-level crypto insights.
MartyBoots here , I have been trading for 17 years and sharing my thoughts on COINBASE:BTCUSD .
Whether you're a short-term trader or long-term investor, this post provides the technical insight and edge to help you make better informed decisions.
📉 Stay ahead of the market. Watch the full breakdown and view charts to decide for yourself: Has Bitcoin really topped?
Watch video for more details and below I will show some powerful charts with descriptions.
Warning in near term - LARGE ORDERS
Consolidation in price with large orders above
The Red lines = LARGE ORDERS
Large orders can act as an magnet to price
Large orders can also be support and resistance
Price Above the white 100 moving average
Price strong above it
Price weak below it
Strength Candles
Still Bullish
Multiple timeframes still green
Sentiment Tool Still Bullish
Still Bullish
Multiple timeframes and settings still green
3 Drive Structure
Equal Measured moves
Implies Top Is Not In
Target = $126k
Bullish Engulfing Candle
Implies higher prices to come
👉 Like, comment below, and follow for more pro-level crypto insights.
#Bitcoin #Trump #BTC #CryptoTrading #TechnicalAnalysis #CryptoMarket #BitcoinTop #TradingView #StrategicBitcoinReserve
