TONUSDT: Short the Rejection,Buy the Capitulation – A Dual-Level
📉 TONUSDT Technical Analysis – Trending in a Long-Term Descending Channel, Is the Ideal Short Entry Coming?
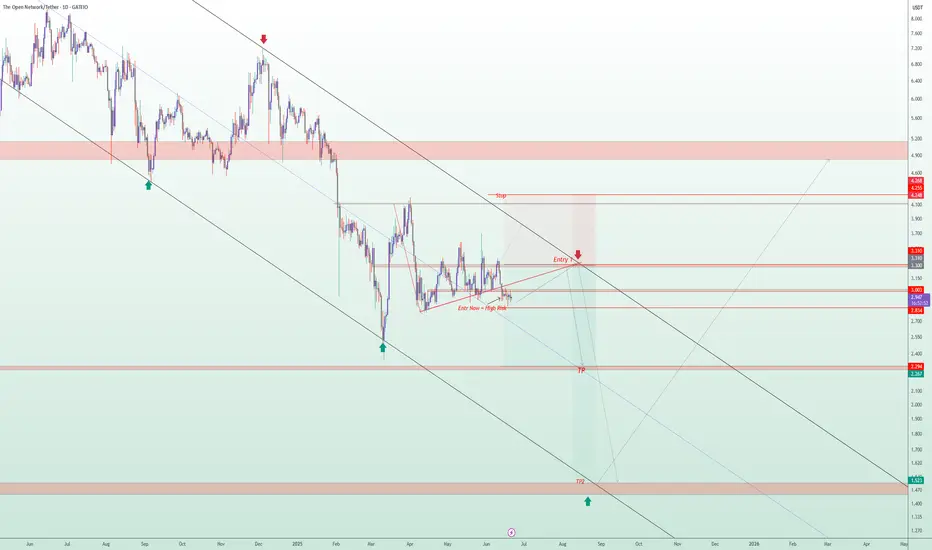
TONUSDT is currently trading inside a long-term descending channel, with clear bearish momentum dominating the structure.
🔻 Scenario 1 (Early & Risky Entry):
Traders may consider opening a short position from the current level, but this setup carries higher risk, as the price could still push upward toward the upper boundary of the channel.
Stop-loss level is clearly marked on the chart.
🧭 Scenario 2 (Smarter, Low-Risk Entry):
A more calculated approach is to wait for the price to revisit the upper resistance zone of the descending channel (marked as Entry 1 on the chart).
This zone offers a clean low-risk, high-reward short opportunity, with a tight stop-loss and excellent setup.
🎯 Defined Targets in This Analysis:
Target 1: The midline of the descending channel
Target 2: The bottom of the long-term descending channel
💎 Important Insight:
If this bearish scenario completes and the price reaches the bottom of the descending channel, that zone could be a prime buying opportunity for long-term holders.
Technically, it's a major support level and psychologically, it's where smart money often steps in.
⚠️ Disclaimer:
This is not financial advice. This analysis is for educational purposes only. Always wait for confirmation and apply strict risk management when trading.
📩 What’s your opinion on this setup? Do you agree with the short plan, or see another scenario unfolding? 👇
Cryptoanalysis
Can #LTC Bulls Make Recovery or Bears will Continue to Dominate?Yello Paradisers! Are you ready for the next wave of #LTC that can catch many traders off guard? Let's see the latest setup of #Litecoin and what can happen next:
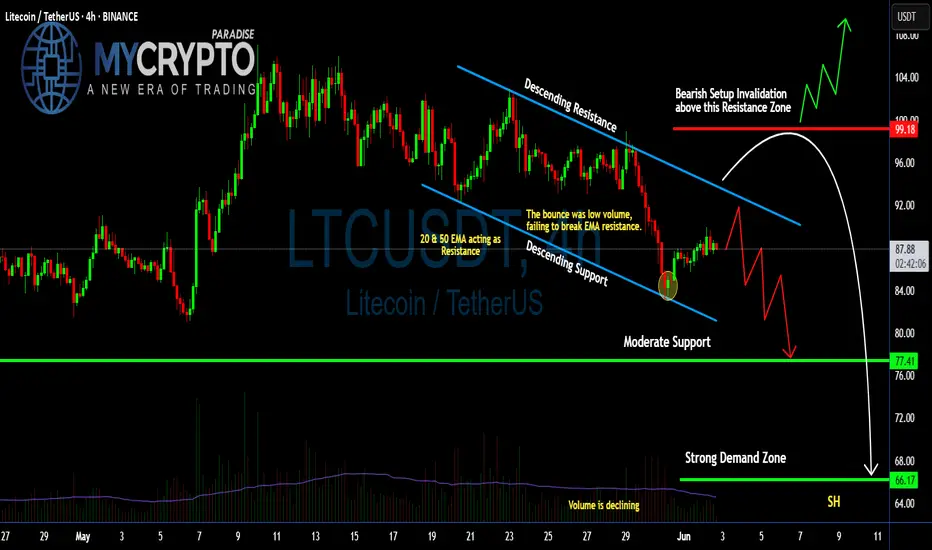
💎#LTCUSDT is currently trapped inside a descending channel, signaling sustained bearish pressure. The most recent bounce came with declining volume and failed to reclaim the 20 & 50 EMA — a clear sign that bulls are running out of steam. These EMAs are now acting as dynamic resistance, capping every upward attempt.
💎The #LTCUSD structure remains bearish as long as the price stays below the key resistance zone near $92.00, especially under $99.18, which marks the invalidation of the bearish setup. If that zone is broken convincingly with huge volume, we could see a short squeeze toward $104.00. Until then, the bias will stay on the downside.
💎Support at $77.41 might offer temporary relief, but if sellers break through that level, all eyes will shift to the strong demand zone at $66.17 — a region that has historically attracted high-volume buying and could serve as a potential bounce area.
💎Volume continues to decline, showing that momentum is fading with each bounce. This increases the probability of a breakdown continuation unless the trendline resistance is flipped with strength and backed by volume. Right now, the chart shows weakness, not reversal.
Stay disciplined. The next big opportunity will come to those who wait not those who chase.
MyCryptoParadise
iFeel the success🌴
Bitcoin Daily, Something for the weekend Sir / Madame ?This will be the main chart and 3 indicators that could be telling us something.
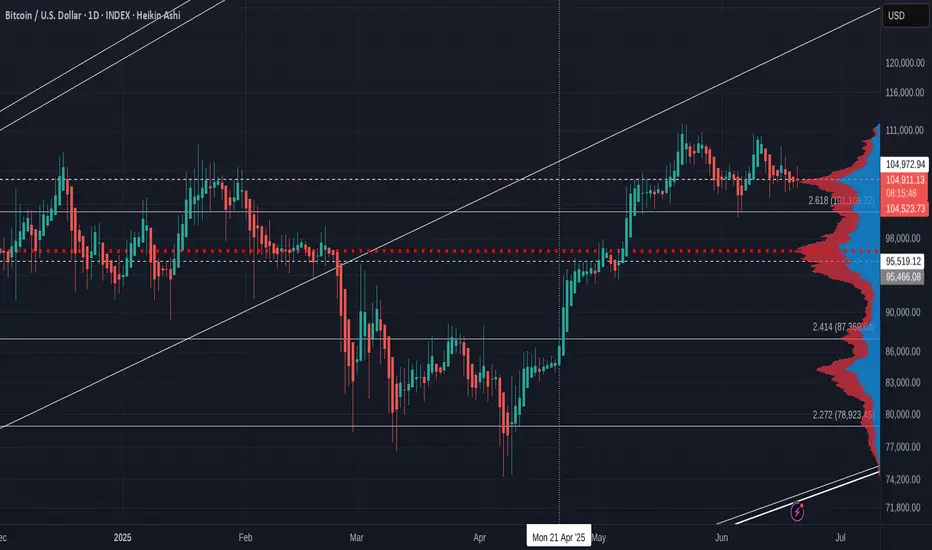
Main chart is the Heiken Ashi. Each candle starts in the centre of the previous one and so we get rid of noise and get a good understanding of possible Trends.
And Right now, CALM is not the word ! Candles are getting smaller and smaller.
However, we do seem to be forming a bullish pennant with an Apex at the end of the month.
PA always reacts before the Apex.
Other things to note here is that we are now using the previous line of resistance as support. Look back to Dec 2024 to Feb 2025. It was this line that put as back down to 75K
We have tested this 4 times in a small way But not in a real Meaningful Way yet.
Do remain Cautious.......but that 2.518 Fib extension should hold us in place if we drop but there could be a much deeper drop.
But lets take this step by step as there are some Very Bullish signs to.
The ADX chart below shows us that Change is near.
Remember, ADX ( yellow ) NEVER shows trend direction, just trend strength. As you can see, it rarely drops much further below this point and does not spend to long here.
SO, current trend is Weak and a new trend is likely in the near future ( this could be tomorrow or in 3 weeks..near future is a wide window..but it is not 2 months or more)
The DI + ( orange ), positive Directional price Index, and the DI - ( red) , negative Directional price Index, are also low, showing no real price action.
This can happen for longer periods of time and it is impossible to say which will rise, However, as we can see, the price movements have not been huge and so to expect a sudden Massive Dive, as some are suggesting, is not really backed by anything.
But we should never say never. Be cautious
Accumulation / Distribution chart below
What is nice about this, is simply that Accumulation is still the MAJOR movement. The majority are still accumulating and so the idea that we maybe in a Bear market is almost Dismissed. People would not accumulate an asset that is about to Dive for a long eriod of time....Normally.
There has been distribution, as marked by the RED zones. This is heavier distribution and as you can see, this Stopped at the beginning of this month, having begun when we reached the high towards end of 2024.
So many thought that was cycle ATH
They have seen the error of their ways BUT, Again, remain Cautious till we see a bigger move higher.
And now my favorite, MACD
And for me, this is where we will see the decision being made. We are approaching the Neutral zone
Last time we bounced off this area was in October 2024 and we went from 70K to 109K
BUT remain cautious, we have every possibility that we may fall through the neutral zone for a while too....But we are in an area that could show us a time to move.
This is a LINEAR Bitcoin Daily chart
And those descending lines are FIB Circles and you can see how PA often runs along them.
You can also see how we are in a Pinch, a tight Squeeze right now ( arrow) with Horizontal line of support and the rejecting red 236 Fib circle.
That Apex is, again, at the end of the month.
So, to conclude, we are certainly heading towards a Move and possibly a new trend.
I like to think this will be Bullish but there are plenty f reasons for Caution.
I will remain with my Monthly charts that suggest June may be RED and that after than we will see more Green.
A Dip is possible and I have New Buy orders around 98K incase PA wicks down to them but there is NO guarantee this will happen...OR if it does, that it will stop there....
We just have to be prepared.
Stay safe
Litecoin Confronts $86.0 Resistance as Overbought Signals EmergeFenzoFx—Litecoin is testing $58.99, which aligns with a 4-hour bearish Fair Value Gap. Stochastic reads 84.0, suggesting overbought conditions.
If $85.99 resistance holds, a bearish move toward $84.19 and possibly $81.01 could follow.

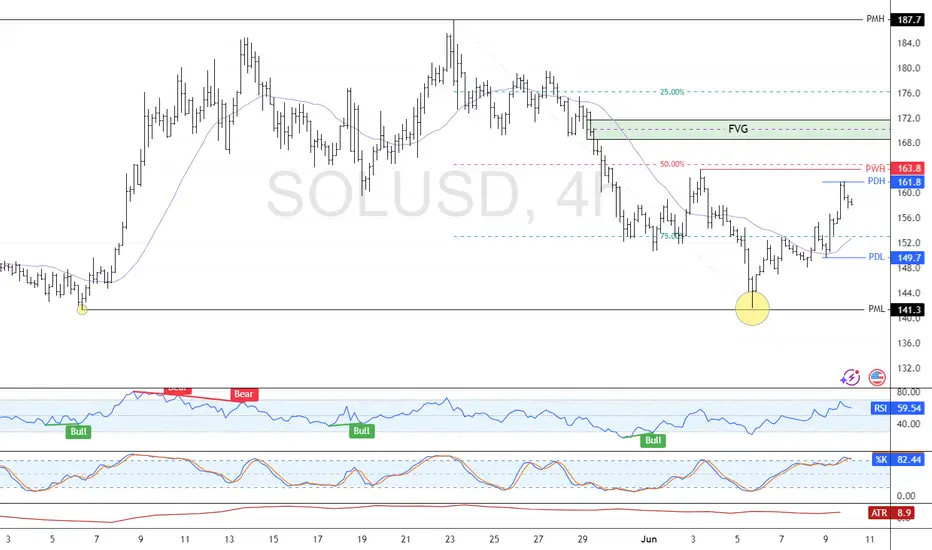
SOLANA Eyes Recovery After Retesting Monthly LowFenzoFx—Currently, SOL/USD trades at approximately $148.37, testing the previous monthly low, which aligns with a bullish fair value gap and is backed by a high-volume node area.
A close and stabilization above $149.3 can spark the uptrend. In this scenario, the next bullish target could be the $168.38 resistance.

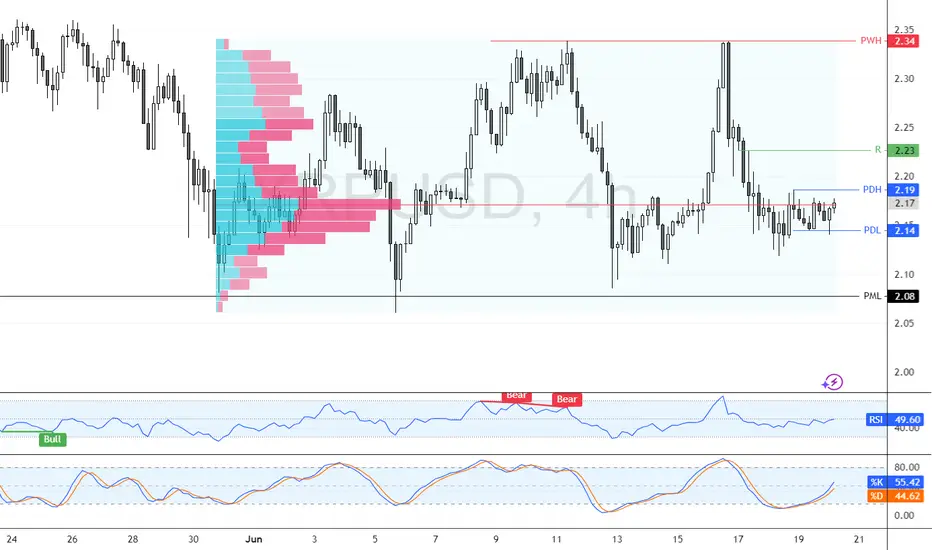
XRP Builds Bullish Outlook as $2.08 Support Holds StrongFenzoFx—XRP bounced from $2.14 and trades near $2.17, approaching resistance at $2.19. The market remains bullish above the $2.08 critical support. A close above $2.19 could lead to targets at $2.23 and $2.24.
The bullish outlook is invalidated if XRP/USD closes below $2.08.
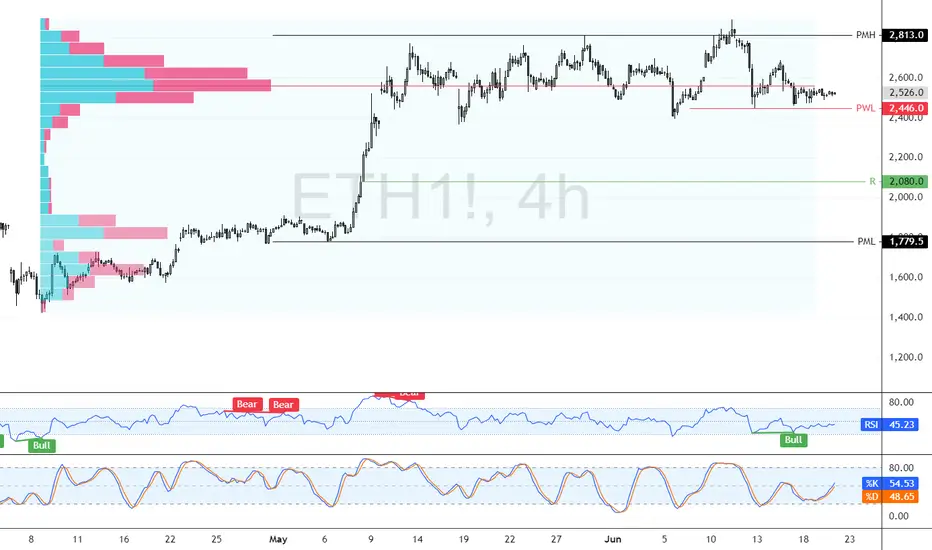
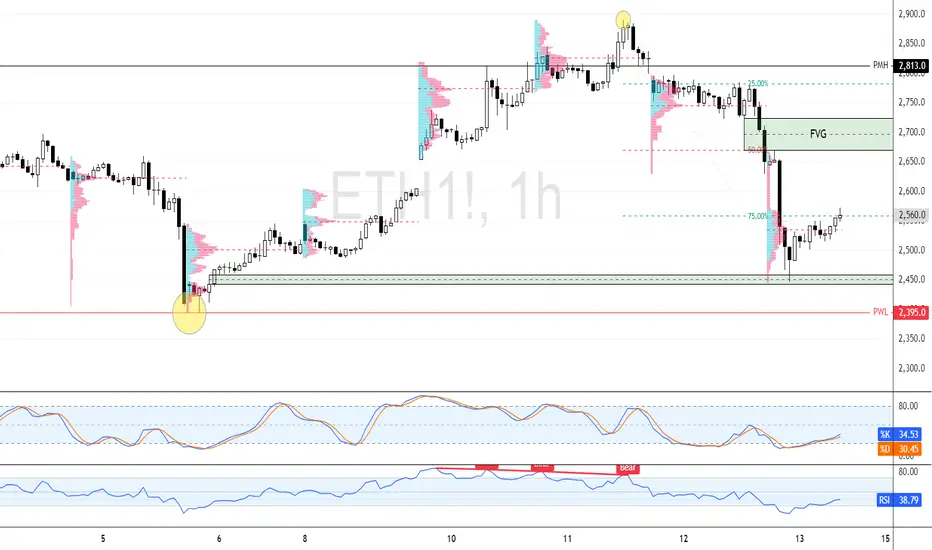
Ethereum Rejected By Strong Resistance, A Bearish OutlookFenzoFx—Ethereum is consolidating around $2,525 after being rejected by the $2,813.0 resistance, a strong supply zone. Immediate support lies at $2,446.0. If ETH closes below this level, a move toward $2,080 is likely.
The bearish outlook is invalidated if ETH stabilizes above $2,813.0.
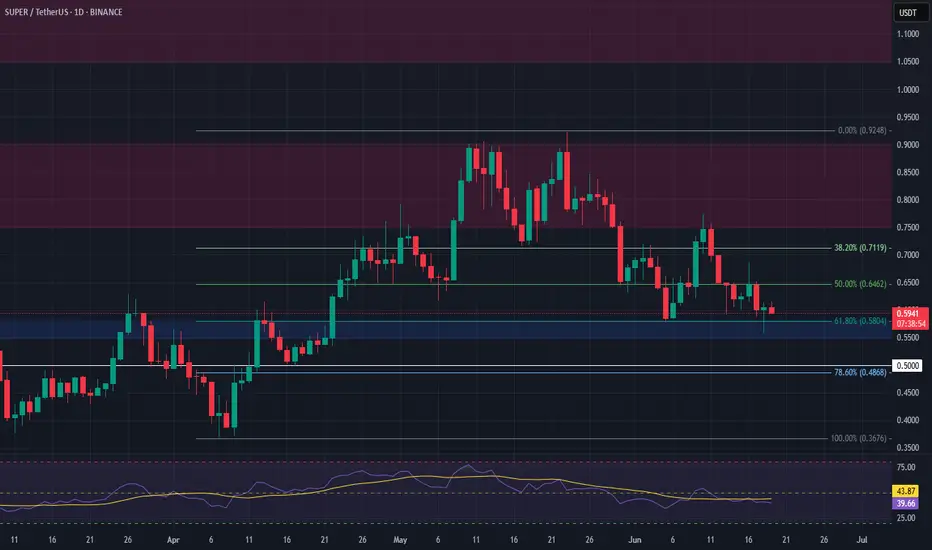
SUPER Long Setup – Confluence of Fibonacci and Major SupportSUPER has retraced into a strong confluence zone, aligning with the 61.8% Fibonacci level and a major support area. The $0.55–$0.58 range offers a solid opportunity to enter a long swing trade.
📌 Trade Setup:
• Entry Zone: $0.55 – $0.58
• Take Profit Targets:
o 🥇 $0.75 – $0.90
o 🥈 $1.05 – $1.20
• Stop Loss: Daily close below $0.50
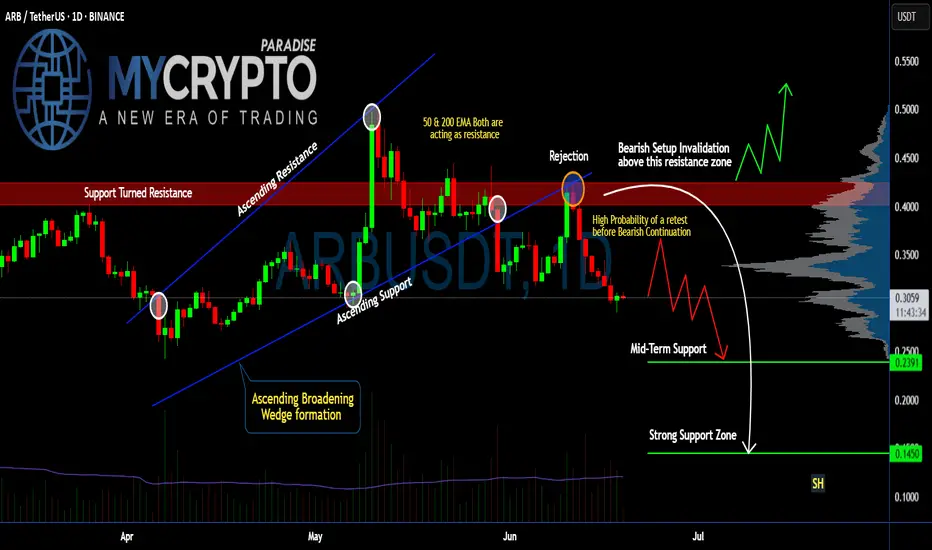
Is #ARB Ready For a Recovery or will it continue to Fall? Yello Paradisers! Are you watching #ARBUSDT closely or not? Let's look at the latest #Arbitrum trading setup and what could be next for it:
💎#ARB just completed a breakdown from an Ascending Broadening Wedge. This breakdown has made the previous support into the resistance after the price rejection. Currently, there is a high probability that #ARBUSD might do a retest before continuing downward.
💎After the wedge breakdown, price got rejected hard from the $0.39–$0.42 resistance zone, where both the 50 EMA and 200 EMA are now stacked against the bulls, acting as strong dynamic resistances. This confluence of resistance increases the probability that this level won't be reclaimed easily. The setup is clearly bearish unless invalidated above $0.42.
💎We’re seeing a lack of follow-through on the bounces, which signals hesitation and likely a trap for late buyers. As long as we remain below the resistance block, the next logical move is a retest of mid-term support at $0.2391.
💎But it doesn't stop there. If this mid-level gives in — and the structure suggests it might — the next area to watch is the $0.1450 zone, a strong historical support and the first place we expect real buyers to step in. This could be the level where a high-probability reversal finally sets up.
Trade smart, Paradisers. This setup will reward only the disciplined.
MyCryptoParadise
iFeel the success🌴
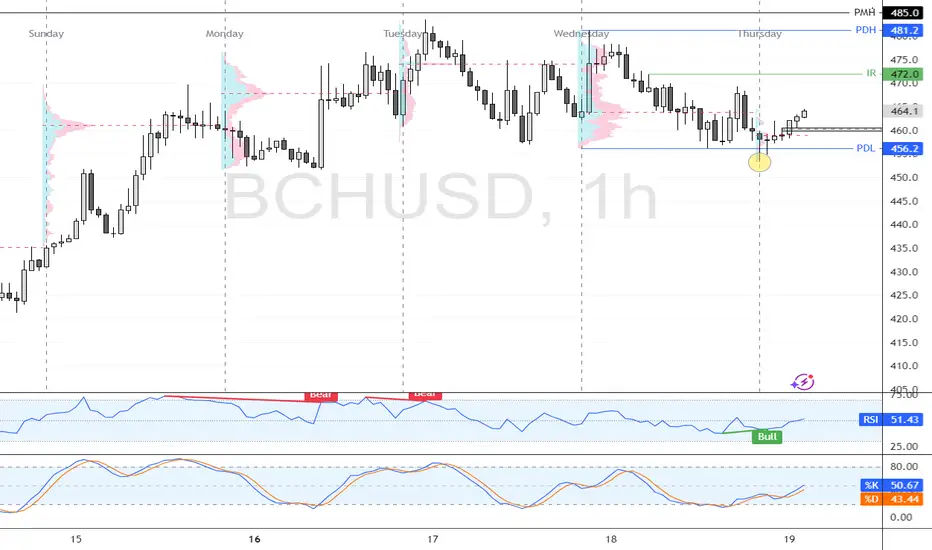
Bitcoin Cash Rebounds from $456 as RSI Shows Bullish DivergenceFenzoFx—Bitcoin Cash swept liquidity below $456.0 during NY midnight and is now rising around $464.0. RSI 14 signals bullish divergence, suggesting growing momentum. If BCH holds above $456.2, it could target $472.0 and potentially $481.2.
The bullish outlook is invalidated if BCH stabilizes below $456.0.
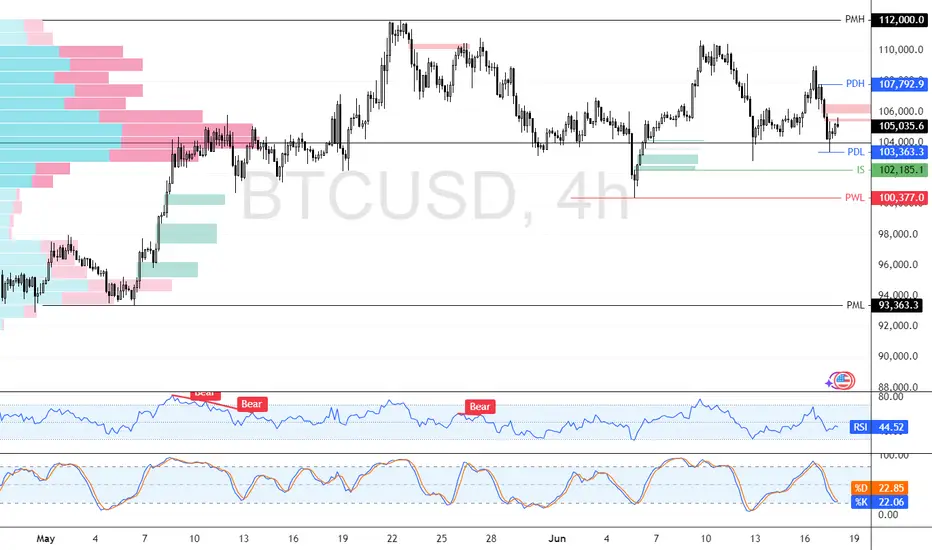
Bitcoin Bounced from a High-Volume Area at the 103,363 Support.FenzoFx—Bitcoin dipped to $105,175, creating a bearish fair value gap that highlights selling pressure. Immediate support is at $103,463, backed by high volume, while resistance stands at $107,792. If support holds, BTC/USD could rise toward $112,000.
A drop below $102,185 may accelerate the downtrend toward $93,363, the previous monthly low.
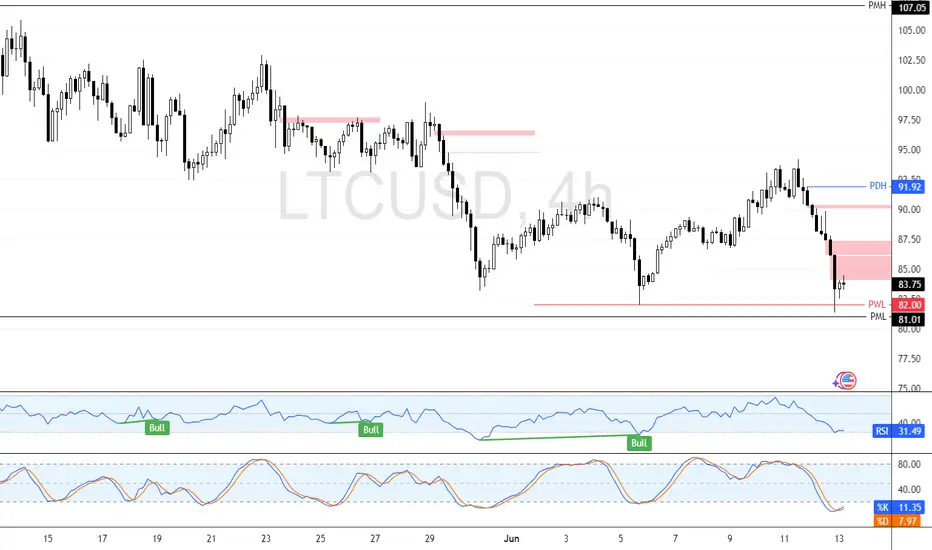
LTC/USD Consolidates—Key Levels to Watch FenzoFx—Litecoin consolidates near $85.0, with key support at $81.0, aligning with last week's low. If support holds, LTC/USD could target $90.4. A drop below $81.0 invalidates the bullish outlook.

Is #ETC Ready For a Breakdown or Will it Recover From Here? Yello Paradisers! Have you checked what’s unfolding on #ETCUSDT lately? Let's look at the latest moves of #EthereumClassic:
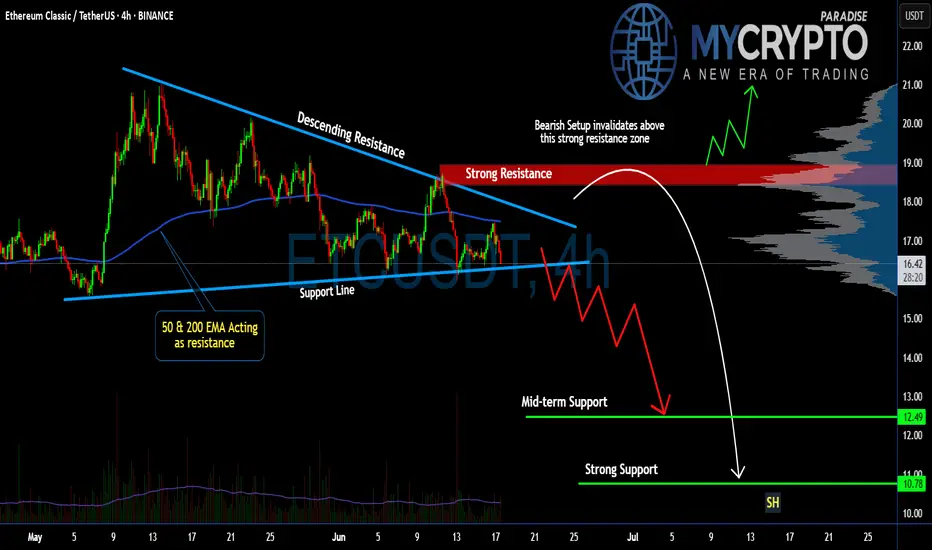
💎#ETC has been trading inside a descending triangle for weeks, and once again, it failed to break above its strong descending resistance line, with the 50 & 200 EMAs acting as a dynamic ceiling on every rally attempt. These two indicators are stacking against the bulls, reinforcing the overhead pressure and keeping ETC pinned below key resistance levels.
💎The red zone between $18.60 and $19.20 has been acting as a strong resistance area and that’s exactly where the last bounce got rejected. The setup is clear: as long as price remains below this red supply zone, any short-term bullish case is invalidated. Each rejection here only fuels further downside conviction.
💎Unless we see a high-volume breakout and hold above $19.20, the structure remains extremely vulnerable. This is the invalidation level for the bearish thesis. If bulls can't flip that, the current pattern suggests continuation to the downside.
💎#ETCUSD is currently hovering around $16.50, with short-term bounces being aggressively absorbed. The mid-term support zone around $12.49 is likely the first magnet for price, but don’t get too comfortable there. The real target lies deeper: the strong support zone around $10.78 is shaping up to be the key smart money reaccumulation area if the selling intensifies. This is where real interest may return—but only after retail gets flushed.
Trade smart, Paradisers. This setup will reward only the disciplined.
MyCryptoParadise
iFeel the success🌴
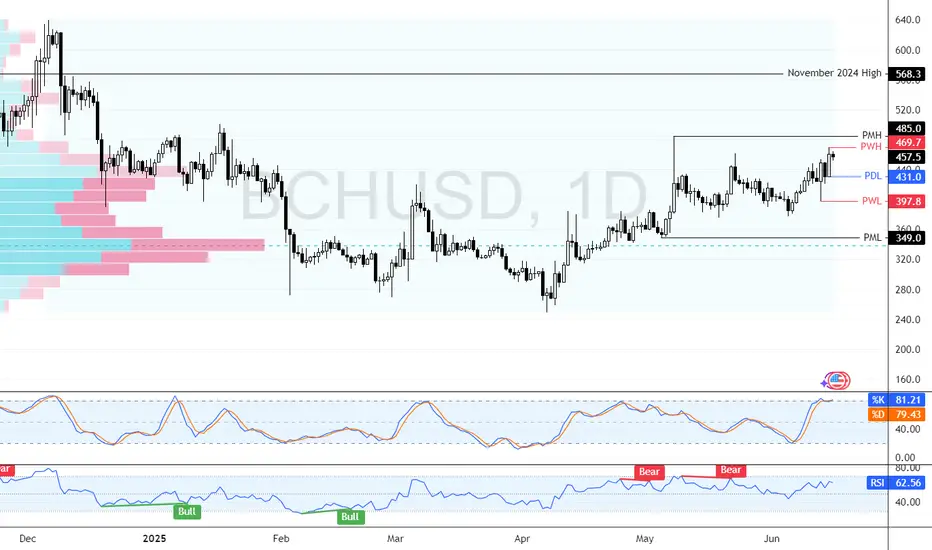
Bitcoin Cash Nears $485—Will BCH Hold Its Gains? FenzoFx—Bitcoin Cash remains bullish, nearing the previous monthly high at $485.0, though overbought conditions signal possible consolidation.
BCH/USD may stabilize around $431.0 before resuming its uptrend toward $485.0. A break above this level could pave the way for $568.0.
The bullish outlook holds as long as BCH stays above $349.0.
Ethereum Consolidates: A New Bearish Target Could Be on the HoriFenzoFx—Ethereum faced rejection at $2,813, triggering a downtrend before stabilizing near the bullish FVG. ETH/USD now trades at $2,566, recovering some losses.
Immediate resistance is at $2,395, but liquidity sweeps make it fragile. A rise toward $2,700 could precede another bearish wave.
If selling pressure persists, ETH may drop to $2,395 or further to $1,910.
Litecoin is Oversold—Is a Rebound Coming? FenzoFx—Litecoin swept liquidity below the previous week's low, aligning with the monthly low at $81.01, a strong support zone.
LTC trades near $83.70 with weak bullish sentiment. Stochastic at 11.00 signals an oversold market, suggesting potential consolidation or a rebound.
A bullish wave may emerge if LTC holds above $81.01, targeting $91.92. Closing below this level invalidates the bullish outlook.
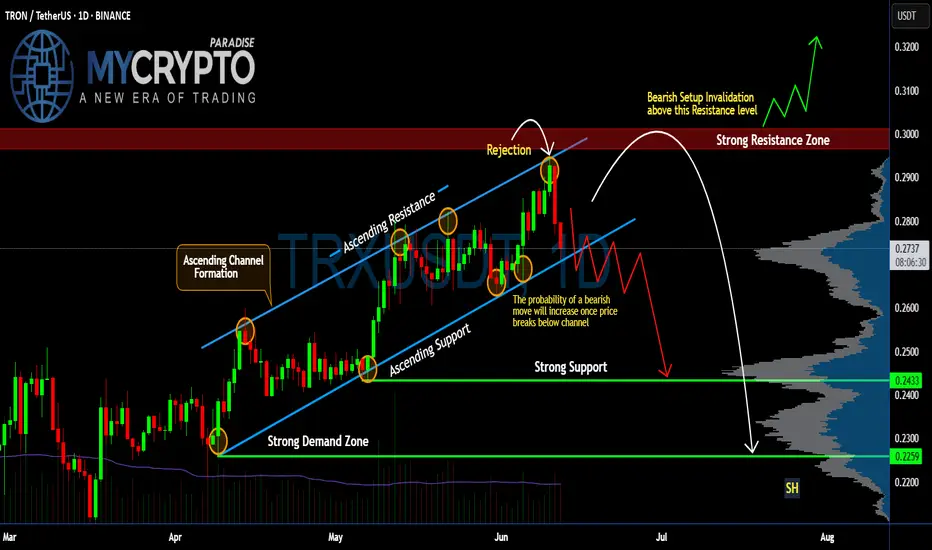
#TRX Ready for a Recovery or Another Fall Ahead? Key LevelsYello Paradisers! Are you watching the #Tron's recent moves in the market? Let's look at the latest setup of #TRXUSDT to see what could be the next move:
💎After forming a textbook Ascending Channel over the past few months, #TRX just got rejected hard from the upper boundary near the $0.29–$0.30 zone. That rejection didn’t just happen anywhere—it came right at the major resistance zone, which has acted as a key reversal point since early May. This kind of rejection, especially after multiple touchpoints, isn't just noise—it's a sign of momentum exhaustion at the top.
💎From an Elliott Wave perspective, it’s very likely that the first major impulse wave (Wave 1) has just been completed with this recent peak, and what comes next could be the start of Wave 2—a corrective phase that typically retraces deep and fast before the market resumes its larger trend. That means any weakness below the channel support could mark the beginning of a more prolonged decline, trapping breakout buyers and squeezing late longs out of their positions.
💎Price is now hovering dangerously close to the lower boundary of the channel, trading at $0.274 at the time of writing. This is where things start to get interesting. A decisive breakdown from this ascending support would not only confirm a bearish structural shift but would also trigger a cascade effect—invalidating the bullish channel and opening the door for a larger move to the downside.
💎If that breakdown plays out, the first meaningful support sits at the $0.2433 level. But that’s just the beginning. The next major demand lies down around $0.2259—a level loaded with historical volume and likely to attract strong buying interest. Until then, any small bounce is just noise in what could become a significant trend reversal.
Trade smart, Paradisers. This setup will reward only the disciplined.
MyCryptoParadise
iFeel the success🌴
BTCUSDT – Strategy and Trend Probabilities for 2025In my opinion, Bitcoin (BTC) has become less interesting — there isn’t much room left for significant movement, and most of the “cream” has already been skimmed off. However, since it's essentially the index of the crypto market, I’m sharing this trading idea for context - to show where we currently are and what scenarios might unfold.
The price is globally moving within an ascending channel.
A secondary triangle pattern is forming.
Within this triangle, we can see the outlines of an inverse head and shoulders pattern - or possibly a cup and handle - both aligning with the channel’s resistance.
Potential scenarios:
a) Price breaks out of the triangle.
b) Price moves toward the triangle’s support, forming another wave inside it.
c) Price moves to retest the main ascending channel’s support.
d) Price fluctuates within the central range of the channel.
There aren't many options, and none of them would break the primary trend. Altcoin movements will largely depend on BTC’s behavior.
Therefore, it’s crucial to build a trading strategy that considers both the likely and less likely (but possible) outcomes.
Looking at the broader picture:
The previous minor altseason (winter 2024) was short and weak, except for a few coins.
There was no real secondary altseason in spring 2025.
Statistically, summer tends to be quiet - due to holidays and so on.
The first two points contradicted the expectations of most traders - so we’ll see how things play out with the third. If there's no altseason in summer either, then logically, winter might turn out to be quite aggressive.

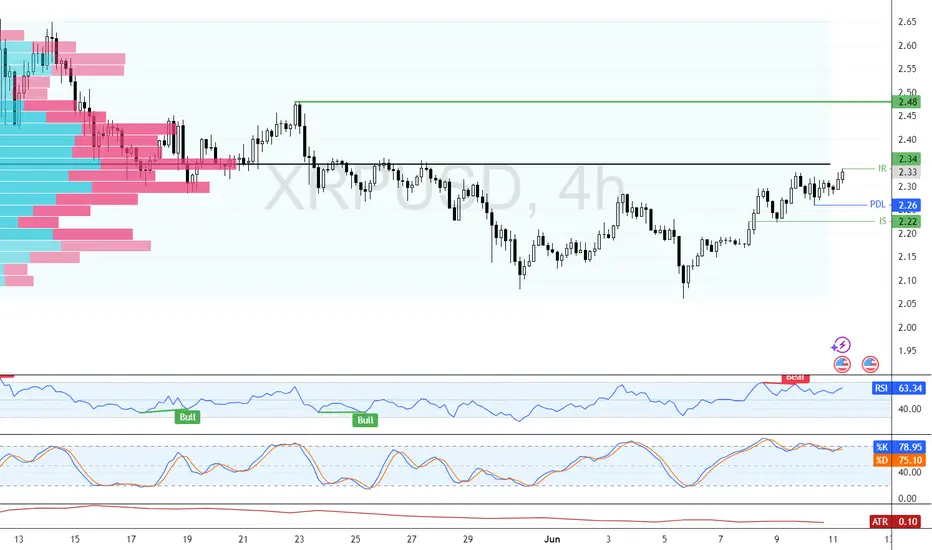
XRP: Selling Pressure Could Push Price to $2.22FenzoFx—Ripple (XRP) is testing the $2.34 resistance zone, marked as a key level by the Volume Profile Indicator. RSI 14 shows bearish divergence, while the Stochastic oscillator remains in overbought territory, signaling potential selling pressure.
If $2.34 holds, a bearish wave could target $2.26, with further downside to $2.22 if selling pressure persists.
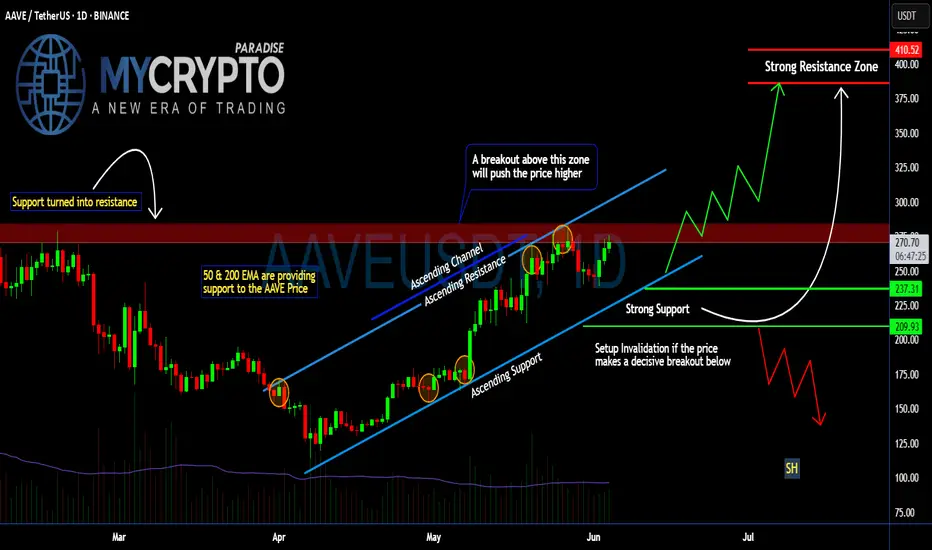
Is AAVE About to Explode Above or Collapse? Key Levels to WatchYello Paradisers! Is #AAVE quietly prepping for a major breakout… or is this just another setup to wipe out the impatient bulls before the real move begins?
💎#AAVEUSDT is moving in a textbook ascending channel, respecting both trendline resistance and support beautifully. The structure is clean, but deceptive. While many may assume this is an easy path higher, seasoned traders know better — especially with what’s happening near the critical resistance zone.
💎The red resistance zone ($270–$280) that was previously a major support during the last cycle is now acting as heavy resistance again. #AAVEUSD is currently battling this zone after several failed attempts to break through. But the structure still leans bullish as long as we stay within the ascending channel.
💎Both the 50 & 200 EMA are now acting as dynamic support. This is key — if the price remains above these EMAs and the lower channel boundary, momentum favors the bulls. A decisive breakout above $280 could trigger a parabolic rally toward the $375–$410 range, a level where serious resistance and profit-taking are expected.
💎However… if bulls get lazy and we see a strong breakdown below the ascending channel, especially below $237, the setup gets shaky fast. A complete invalidation of the bullish case occurs if AAVE loses $209 — from there, expect a breakdown structure to unfold with a likely test of much lower levels and a possible retest of the $150 zone.
Trade smart, Paradisers. This setup will reward only the disciplined.
MyCryptoParadise
iFeel the success🌴
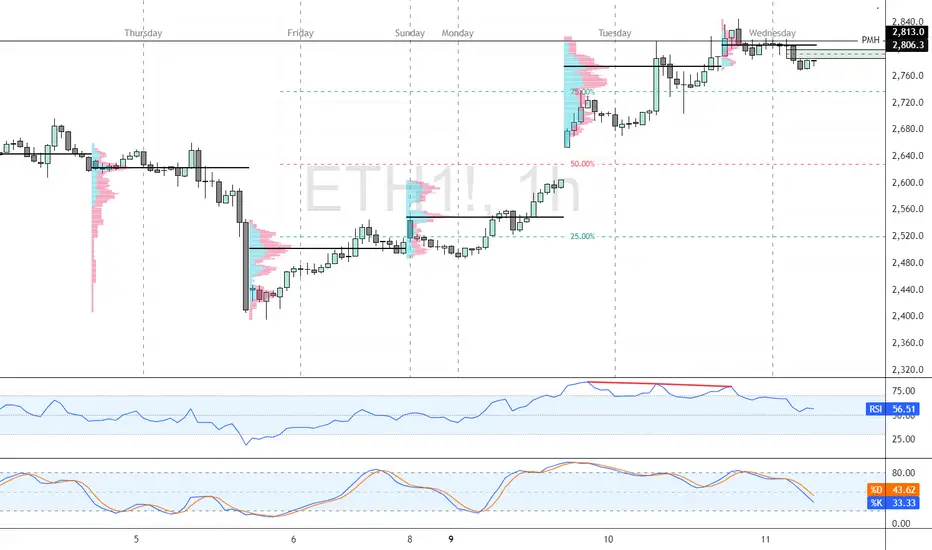
Ethereum's Monthly High Rejection: Is a Bearish Wave Coming?FenzoFx—Ethereum tested and swept the monthly highs at $2,813 but failed to sustain its bullish momentum. The 1-hour chart formed a bearish fair value gap, signaling increasing selling pressure.
Currently, Ethereum trades slightly below the monthly high at approximately $2,806, with immediate resistance at $2,813. If this level holds, ETH/USD could target the 50.0% retracement zone near $2,640.
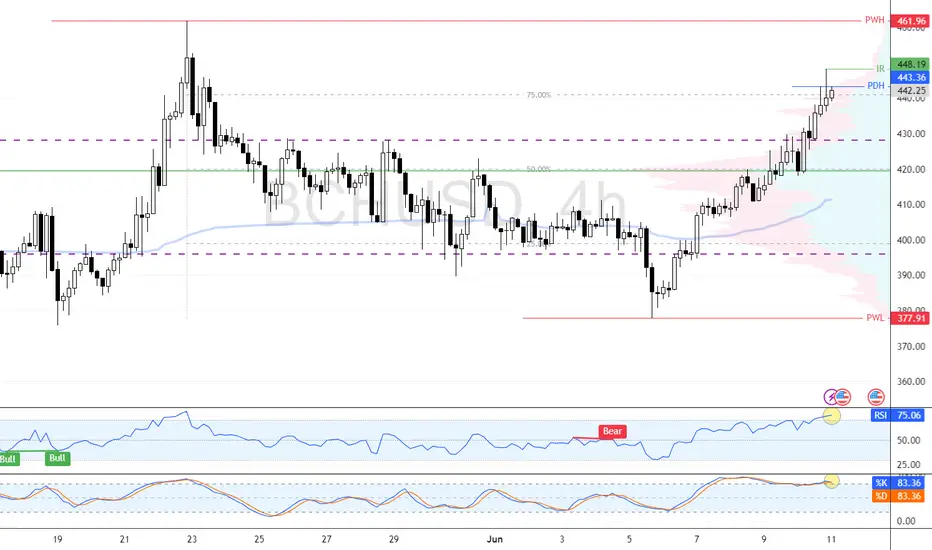
BCH/USD Consolidates Eying $461.9FenzoFx—BCH (Bitcoin Cash) paused its uptrend near $448.1, a low-volume zone, suggesting the rally may resume after consolidation.
Technical indicators show overbought conditions, increasing the likelihood of a short-term dip. BCH/USD may consolidate near $430.0 before aiming for the next target at $461.0.
Solana: Bearish Outlook Between $163.8 and $170.FenzoFx—Solana formed a double bottom at $141.3, making this level a target. We are bearish on Solana between the $163.8 and $170.0 resistance.
The target is $149.7, followed by $141.3.