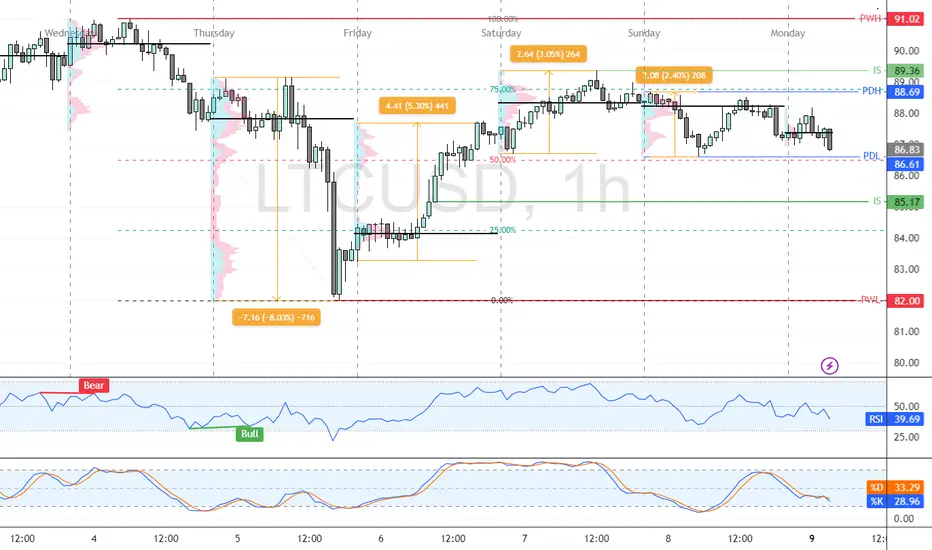
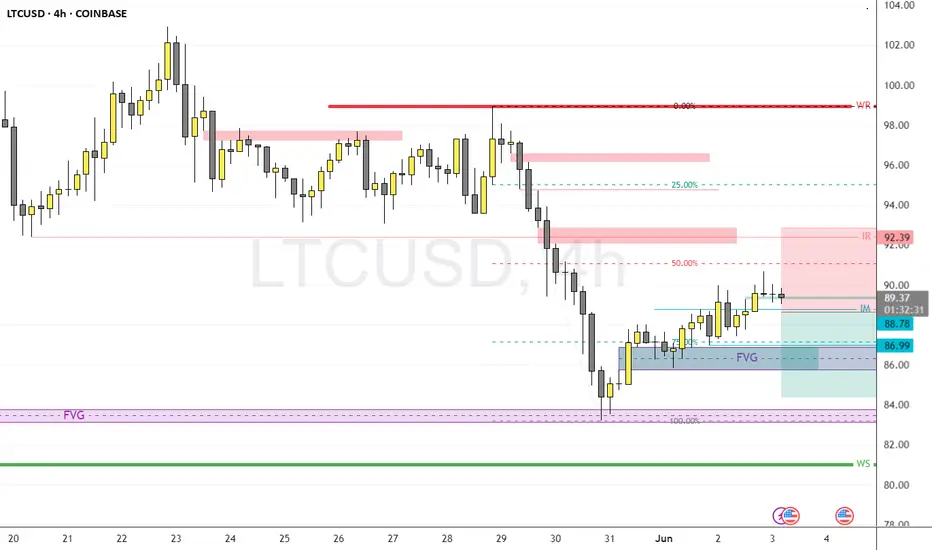
ICT Strategy Signals Bearish Outlook for LTCFenzoFx—Litecoin consolidates near 87.1 after Saturday’s price action, down 0.09% today. ICT analysis places LTC in the premium pricing area, favoring short positions.
Immediate resistance at 89.36 remains untested, while support lies at 86.61. Traders should wait for LTC to test resistance and watch for bearish signals like candlestick patterns and an inverted Fair Value Gap (FVG). If resistance holds, LTC could break below support, aiming for 85.17.
The bearish outlook remains valid as long as 91.02 holds as resistance.
>>> Trade LTC swap free at FenzoFx.
Cryptoanalysis
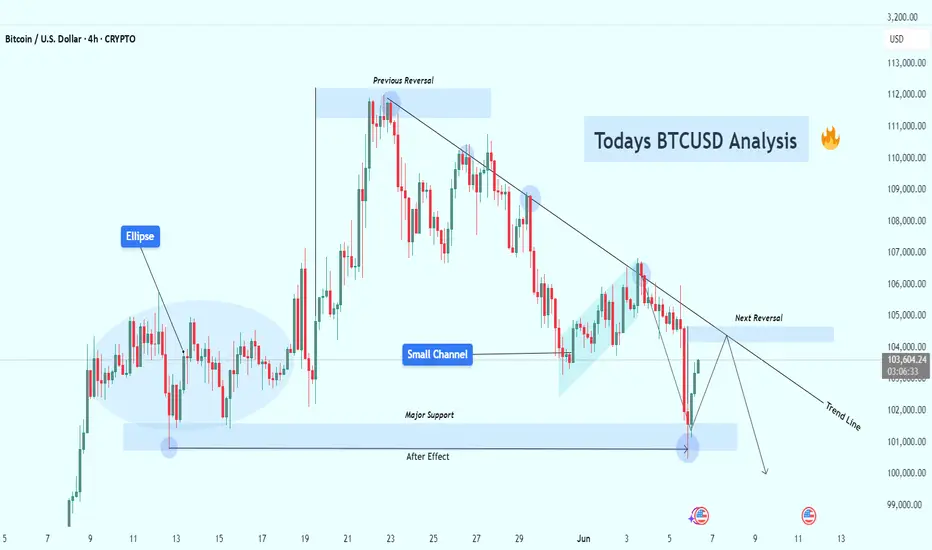
BTCUSD at Decision Point – Rejection or Breakout Ahead? (4H)Bitcoin is currently trading around $103,500, and the price action is presenting a textbook technical scenario with multiple confluences. This chart is rich in structure — from rejection zones and trendlines to channel breakdowns and historical support retests — making it a critical area for traders to observe.
🔍 1. Previous Reversal Zone
The chart shows that Bitcoin previously faced a strong rejection near the $110,500–111,000 level. This created the first lower high, signaling the end of bullish momentum and the start of a trend shift. Every subsequent touch of that zone resulted in rejection, confirming it as a major supply zone.
📉 2. Descending Trendline – Dynamic Resistance
After multiple failed attempts to break above, price has formed a clean descending trendline that is acting as dynamic resistance. Each touch along this trendline has led to a short-term selloff, and price is now approaching this line again, near the Next Reversal Zone.
📌 This confluence increases the probability of another rejection unless there's a strong bullish breakout with volume.
📊 3. Bearish Channel & Breakdown
Before the recent fall, Bitcoin was trading inside a small bearish channel. This type of consolidation often results in continuation — which we saw with the downside breakout. This breakdown also increased bearish momentum and pushed BTC into the major support area.
🧊 4. Major Support Zone – The Battle Ground
Marked around the $101,000–102,000 range, this zone has acted as a strong demand area multiple times. The most recent bounce suggests that buyers are still active here. This could be the last defense for bulls in the short term.
🧠 If this zone breaks, we could see price falling toward the psychological level of $100,000 or even lower.
🌀 5. Ellipse Zone – Accumulation Structure
Early on the chart, an ellipse highlights a horizontal accumulation zone where price moved sideways before breaking out upward. This shows how smart money often enters during quiet phases before explosive moves. Watching for similar signs can provide strong trade setups.
🔄 6. Next Reversal Zone – Watch Closely
Price is now approaching the Next Reversal Zone near $104,500–105,000, which aligns perfectly with the descending trendline. This is a high-probability rejection zone where traders should be watching for bearish confirmations like wicks, pin bars, or bearish engulfing candles.
📌 Two Possible Scenarios
🟥 Bearish Scenario (High Probability):
Price touches the Next Reversal Zone and gets rejected.
We could see a drop back to the Major Support Zone.
If support breaks, expect a move toward $100K–99K in the coming sessions.
🟩 Bullish Scenario (Low Probability Without Volume):
Price breaks and closes above the trendline with strong bullish candles and increased volume.
In that case, BTC could rally toward the $107K–108K resistance and potentially flip the trend bullish.
💡 Trading Insight:
Fridays usually have low volume, leading to unexpected wicks and false breakouts. That’s why it’s important to:
Use small lot sizes
Wait for confirmations
Avoid overtrading before weekend closes
🧠 Final Thoughts:
This is a classic setup — consolidation after trend, rejection zones, trendline resistance, and strong support areas all in one chart. Whether you’re a price action trader or a structure-based analyst, this chart offers a powerful decision point.
Stay patient. Let the market reveal its hand. The next few candles around this trendline will likely dictate the next 1–3 day direction for BTC.
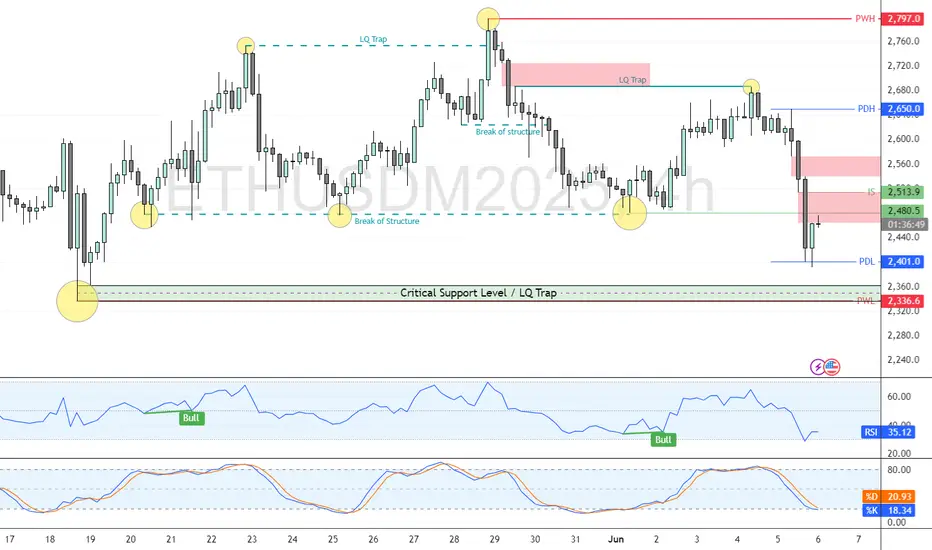
Ethereum's Downtrend Pauses—Reversal or Further Drop?FenzoFx—ETH/USD currently trades around $2,480, ranging between $2,336.0 support and $2,797.0 resistance. Given the recent break of structure, the bearish trend may resume, targeting $2,336 as the next liquidity trap.
This level may offer a discounted entry for long positions. Traders should watch for bullish signals like candlestick patterns and fair value gaps on lower timeframes (M5, M15) during the NY session.
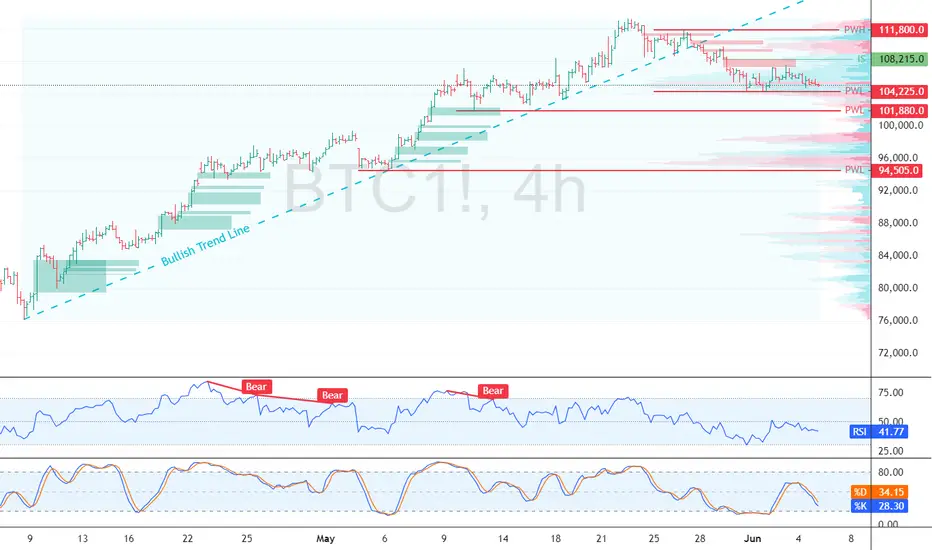
Is Bitcoin Repeating Its 2021 Price Action? | TRADEDOTSWe’ve observed that Bitcoin CME:BTC1! appears to be repeating a previous wave pattern. If it follows its historical price action yet again, here’s what we might expect:
2021 Comparison
Back in 2021, Bitcoin formed two large rounded wave structures where the second wave exceeded the first, forming two consecutive all-time highs followed by a huge drawdown. This year’s price action looks very similar to the beginning of the second 2021 waves. If it continues to unfold in the same way, we anticipate a new all-time high before the end of this year, followed by a notable pullback into early next year.
Key Support at $96,000
As long as BTC holds above $96,000, the bullish trend remains intact. This level has shown great demand and volume support, reinforcing its role as the floor for the short-term uptrend.
Upside Potential to $117,000
If buyers continue to support the market above $96,000, BTC could reach the $117,000 region, setting another all-time high. This expectation follows the earlier wave pattern seen earlier this year and completes a close parallel to the 2021 bull run.
Deeper Pullback Expected
After a potential new high, a larger correction is likely. Drawing on previous pullback price action, a 30% dip toward $82,000 could align with a higher-time-frame trendline and significant support area—mirroring the wave structure from 2021.
Final Thoughts
BTC remains structurally bullish above $96,000
A pullback to the $82,000 region could present a key buying opportunity if it occurs.

BTCUSDT - at CUT n REVERSE AREA ? Holds or not??#BTCUSDT.. market just reached near to his ultimate aea that is around 104300
keep close that area because should holds above that if there is further buying scnerios.
otherwise below that not at all.
good luck
trade wisely
BTC Dominance New Update (12H)We are truly at a critical point for Bitcoin dominance.
It’s possible that the main drop in Bitcoin dominance has already begun. If the green zone is lost, dominance could experience a deep decline, especially since the final wave of this diametric pattern | wave G | has touched the 0.618 Fibonacci level.
That said, there’s still a chance that the green zone might once again push the price near the previous high before we witness the drop in dominance. However, there are also signs suggesting that the main drop may have already started. Follow the chart closely and monitor it with precision.
For risk management, please don't forget stop loss and capital management
Comment if you have any questions
Thank You

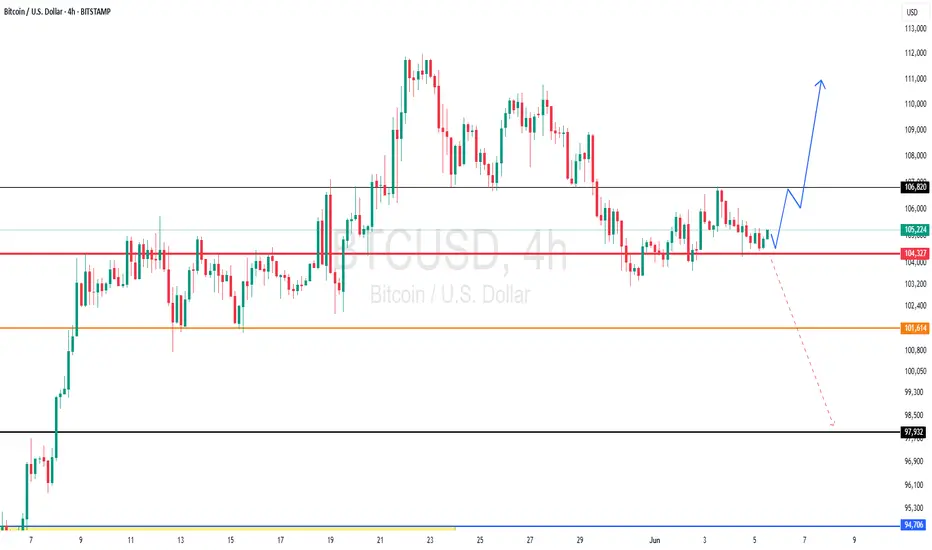
Bitcoin’s Bearish Signal: Key Levels to WatchFenzoFx—Bitcoin consolidates near $104,225 after breaking below the bullish trendline, signaling a possible break of structure. This level acts as immediate support, and a bearish wave could form if BTC closes below it, targeting the $101,880 demand zone.
The bearish outlook remains valid unless Bitcoin surpasses $108,215. If broken, price could rise toward $111,800.
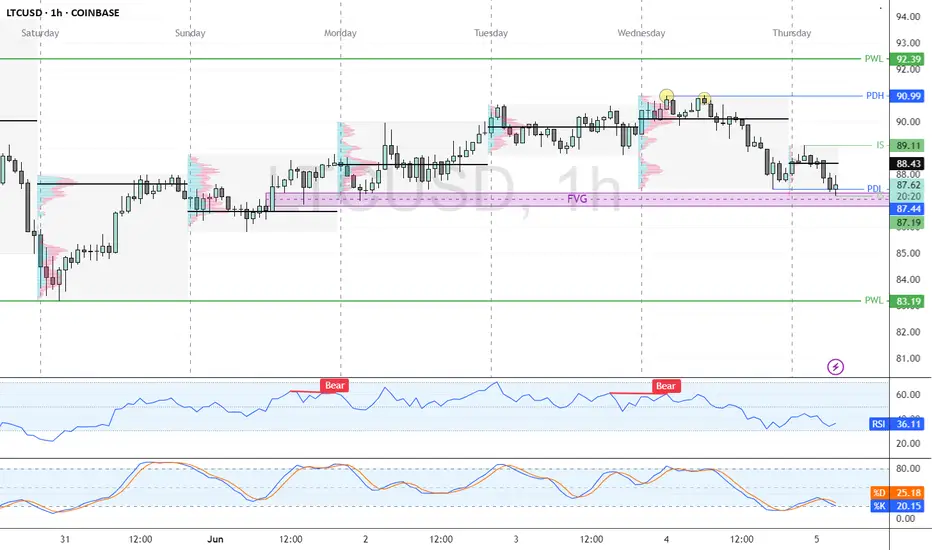
Litecoin’s FVG at $85.8: A Key Pivot the Next LegFenzoFx—Litecoin’s momentum weakened from $91.00 to $87.40, now trading around $87.44 as the London session begins.
Early in the session, LTC took out the Asian session’s low, signaling a liquidity grab. The $87.44 support zone aligns with a bullish Fair Value Gap (FVG) and Monday’s low.
If the FVG holds, LTC/USD could push toward $89.11, the Asian session high, with $90.99 as the next bullish target. However, $90.99 forms a double top, with sell limits and buy stops above—potential liquidity. If $86.00 holds, this could be the next target.
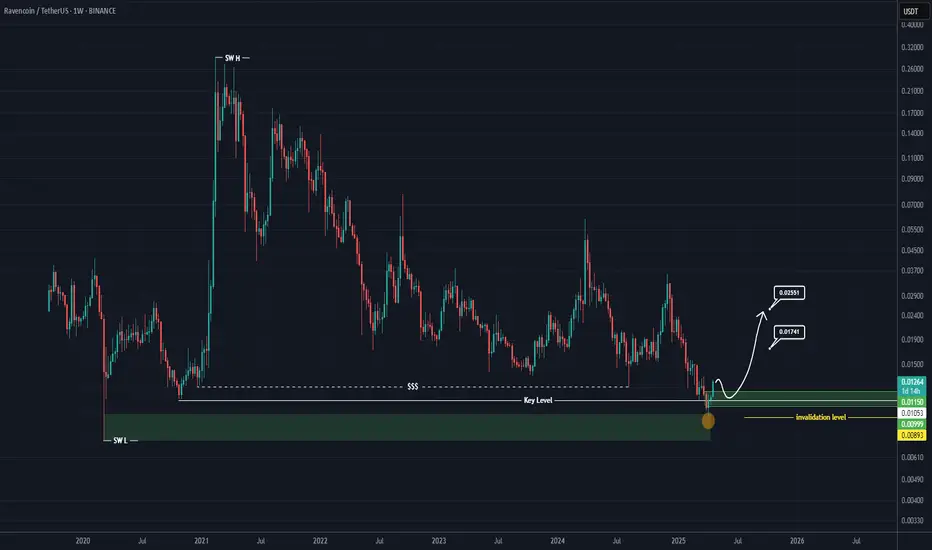
RVN Looks Bullish (1W)It’s one of the coins we are highly bullish on.
A major liquidity pool has been swept, and the price has hit an important origin level.
As long as the upper green zone holds, it can move toward the targets on the daily and weekly timeframes. The targets are marked on the chart.
A weekly candle close below the invalidation level would invalidate this analysis.
For risk management, please don't forget stop loss and capital management
Comment if you have any questions
Thank You
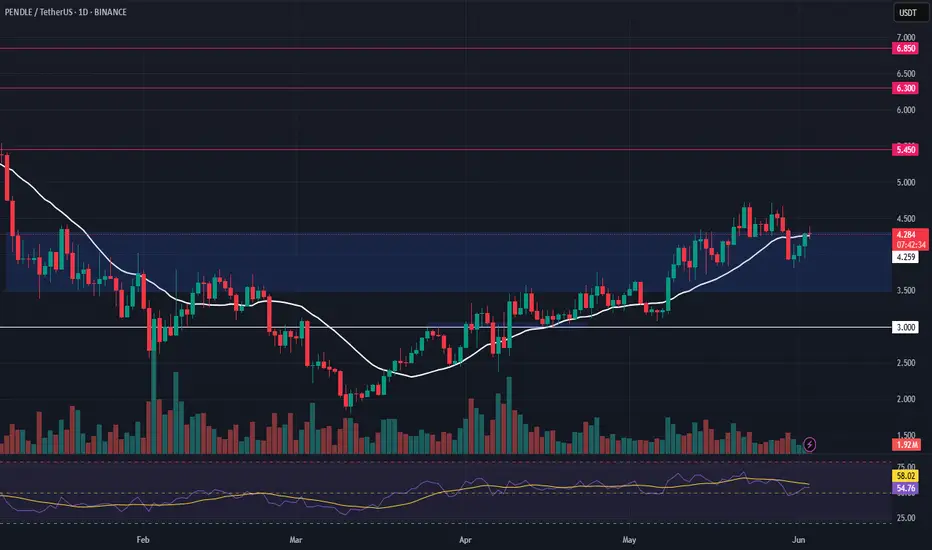
PENDLE – Bullish Continuation Setup from Key Support ZonePENDLE remains one of the standout performers in the crypto space, maintaining its bullish market structure even amid broader market uncertainty. With price currently holding well above key support, this presents a favorable opportunity for a swing long position, especially if the broader market stabilizes.
📥 Entry Zone:
$3.50 – $4.30
🔹 Confluence with previous resistance turned support
🔹 Demand zone within bullish structure
🔹 Ideal for scaling in
🎯 Take Profit Targets:
🥇 $5.45
🥈 $6.30
🥉 $6.85
🛑 Stop Loss:
Daily close below $3.00
Structure breakdown
Litecoin Consolidation Nears End—New Downtrend Ahead?FenzoFx—Litecoin's consolidation near $91.0, marking 50% of its previous bearish leg, may be nearing its end as a long-wick bearish candlestick forms on the 4-hour chart.
Key support lies at $88.7, and a close below this level could trigger a downtrend targeting $87.00 and $86.00. The bearish outlook remains intact below $92.39 resistance.
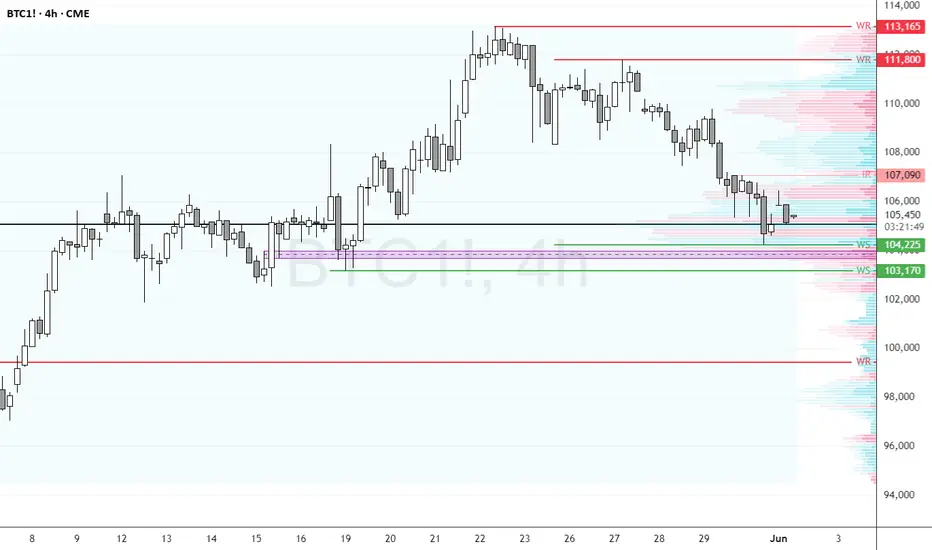
BTC Faces Critical Resistance—Breakout or Further Decline?FenzoFx—Bitcoin continues its bearish trend after hitting its 2025 all-time high at 113,165. BTC/USD is currently trading near $105,400, a high-volume area where price could either bounce or break lower.
The key resistance level rests at $103,170, supported by a bullish Fair Value Gap. If price holds above this zone, Bitcoin could rise toward $107,090.
However, a close below $103,170 would invalidate the bullish outlook, with the next bearish target at $99,435.
XRP Holds Firm—Will Bulls Push It Higher?FenzoFx—XRP bounced from the $2.08 weekly resistance, aligning with the bullish Fair Value Gap. Currently, XRP consolidates at $2.17, with key resistance at $2.21.
A breakout above $2.21 could trigger bullish momentum toward $2.27. However, if XRP closes below $2.08, the downtrend may resume, targeting $2.00.

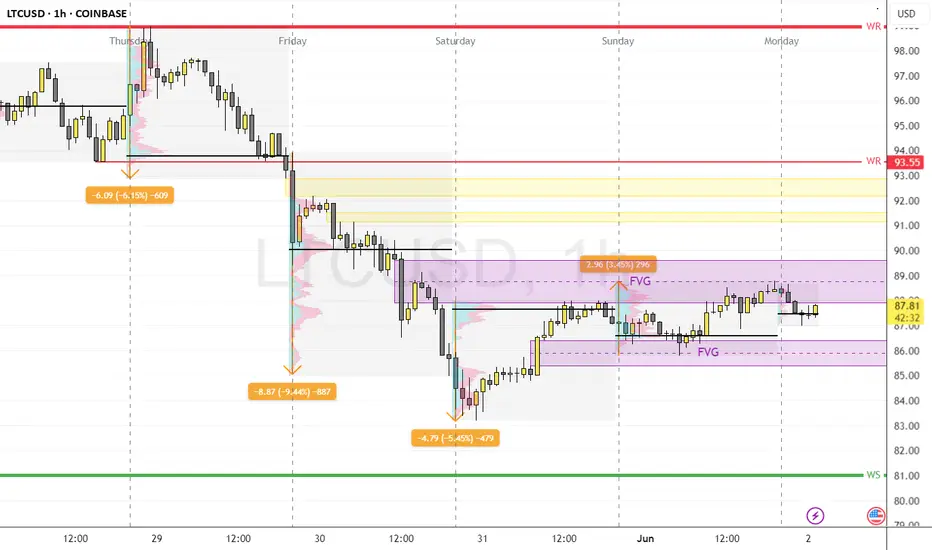
Bearish Pressure Eases—Can Litecoin Recover?FenzoFx—Litecoin remains bearish after breaking below $93.55, though selling pressure eased near $83.0. Currently, LTC/USD is testing the bearish Fair Value Gap at $87.5.
A recovery toward $93.55 is possible if price closes above the $88.0–$90.0 zone, allowing bullish momentum to extend toward $92.00.
However, a dip below $85.0 would invalidate this outlook, with the next bearish target at $81.0.
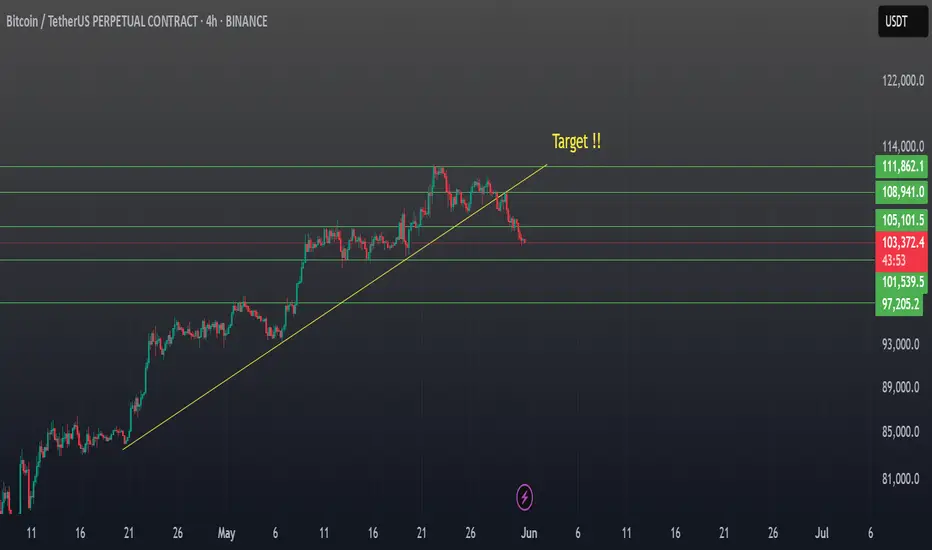
BTC/USDT – Trendline Breakdown Alert!Bitcoin has broken below its ascending trendline on the 4H chart, signaling a potential shift in momentum. 📉
Current Price: $103,322
Immediate Support Levels: $101,539 | $97,205
Target Zone: ~$97K if bearish momentum continues
Resistance: $105,101 | $108,941
If the momentum is sustained above $105,101, we can see a rally to the immediate resistance of $ 112,000.
Stay tuned for detailed updates !!
Watch for confirmation below $101.5K — a sustained drop could open the gates to further downside. Trade safe! 🚨
#Bitcoin #BTCUSDT #CryptoTrading #TechnicalAnalysis #TradingView #ScramblerG
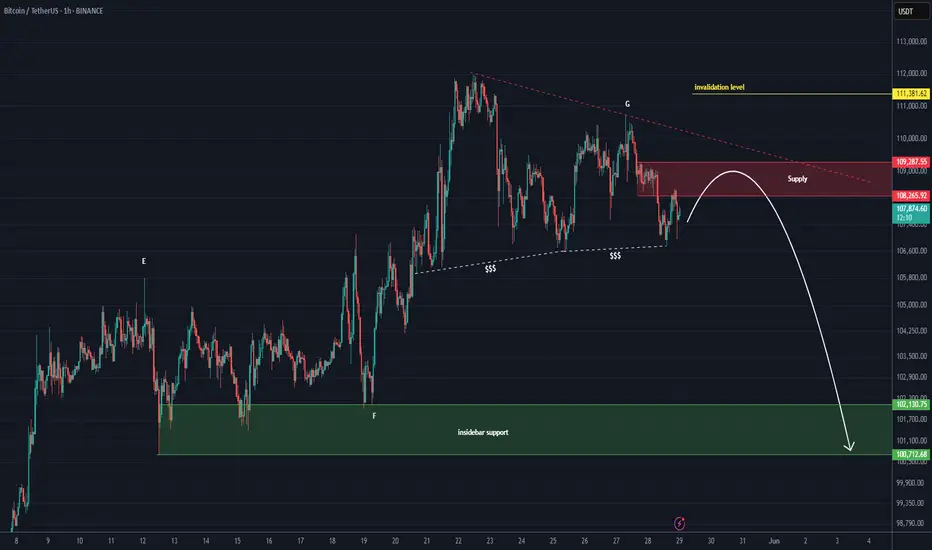
Bitcoin is bearish | stay cautious (1H)This analysis is an update of the analysis you see in the "Related publications" section
We have been warning about a potential Bitcoin correction for some time. It appears that wave G has ended, and key levels have been lost. If the price reaches the red box, it is expected to be rejected downward.
The green zone is a relatively strong support area for Bitcoin, and we should closely watch this level.
A daily candle closing above the invalidation level would invalidate this analysis.
For risk management, please don't forget stop loss and capital management
Comment if you have any questions
Thank You
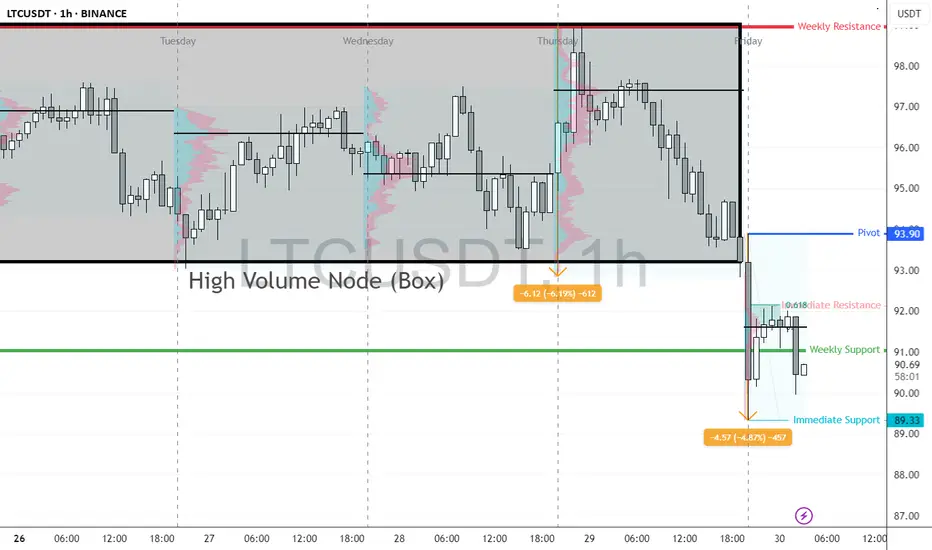
Litecoin’s Sharp Drop—Will the Downtrend Continue?FenzoFx—Litecoin dropped 6.2% yesterday, marking its largest daily range this week. It failed to hold within the High Volume Node box, and selling pressure in the Asian session pushed the price below weekly support to a new low of $89.3.
Currently, LTC/USD is consolidating near the 61.8% Fibonacci retracement level, a key resistance zone. If this level holds, the downtrend may resume, targeting weekly support levels.
Given that Litecoin has already reached its average daily range, no major moves are expected today.
"PEPE 1H Analysis - Breakout Incoming? 📊 *PEPE/USDT – 1H Technical Analysis*
An ascending triangle pattern is developing on the 1-hour timeframe, which often indicates potential bullish momentum.
🟢 Price is approaching a key resistance near *0.00001516*.
🟡 A clean breakout above this level with strong volume may open the door for further upside.
🔴 Watch for *confirmation* before considering any move.
🔍 This chart is purely for educational and analytical purposes.
No financial advice. Do your own research before making any trading decisions.
#PEPE #PEPEUSDT #Crypto #TechnicalAnalysis #TradingView #Altcoins

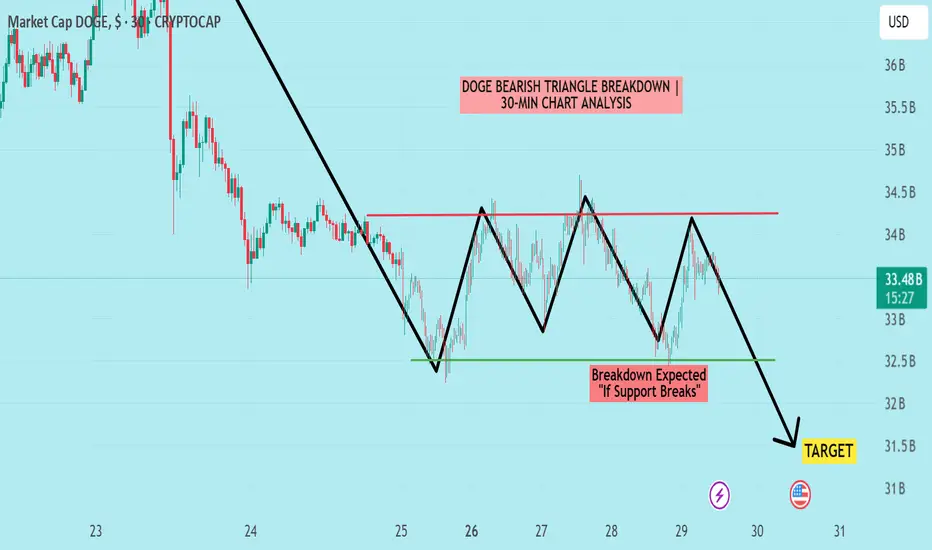
DOGE|Bearish Triangle Formation On30-Min Chart-Breakdown Ahead?📉 DOGE Bearish Triangle Breakdown | 30-Min Chart
This chart highlights a classic *bearish triangle formation* in DOGE's market cap on the 30-minute timeframe. The pattern shows a series of lower highs with horizontal support around the 32.45B zone.
🔍 Key Observations:
- Pattern: Bearish Triangle
- Resistance: ~34.7B
- Support Zone: ~32.45B
- Target Zone (Post-Breakdown): ~31.3B
A breakdown below the support level could signal further downside movement. However, confirmation is key — traders should watch for volume and candle close below support.
🕒 Timeframe: 30-Minute Chart
📆 Analysis Date: May 29, 2025
---
⚠ *Disclaimer:*
This analysis is shared purely for *educational purposes* and does not constitute financial advice. Please do your own research and risk management before making any trading decisions.
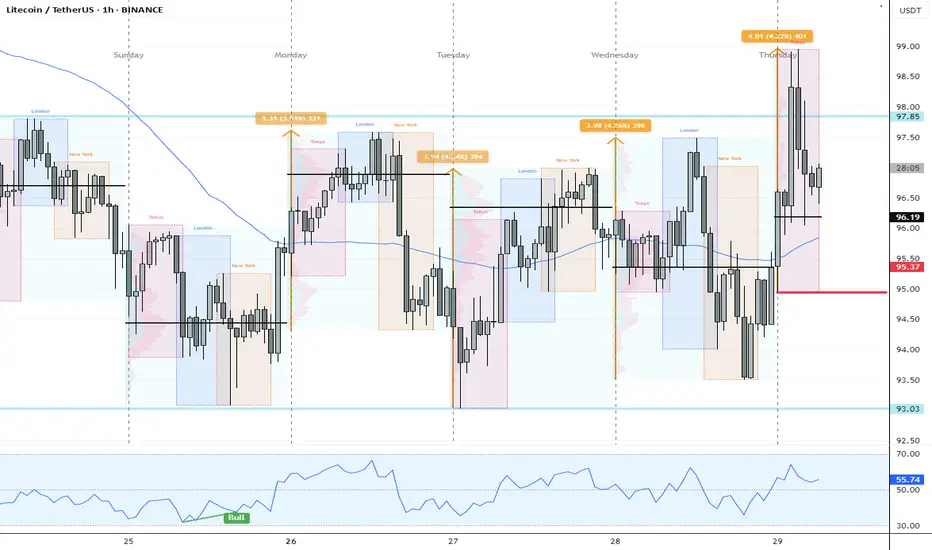
LTC Consolidates After Taking the Buy Side LiquidityFenzoFx—Litecoin surged to $99.5 in the Tokyo session but failed to hold gains, dropping below $97.85. LTC/USD is now consolidating at $96.60, with sellers gaining control.
Since LTC has already exceeded its daily range, a further pullback is expected. The weekly low zone of $93.50–$93.00 could offer a low-risk buy entry.
The bullish outlook remains intact as long as LTC holds above $93.00, with targets at $96.5 and $97.88 this week.
BTC in Bearish Wedge _ Breakdown or Bonus at Demand Zone?🔍 Technical Breakdown:
Bitcoin is currently trading within a *bearish wedge pattern* on the 1H timeframe. Price action is compressing, indicating a potential breakout soon.
⚠ *Bearish Bias:*
If the rising support breaks down, we expect a move toward the *103,000–102,000 support zone*, which has previously acted as strong demand.
📉 *RSI* is trending lower, showing weakening momentum.
📉 *MACD* crossover favors sellers (if applicable).
📌 Watch for reaction in the *reversal zone* to assess bounce or continuation.
---
📊 *Key Levels:*
- Resistance: 108,800 – 109,200
- Support Zone: 103,000 – 102,000
- Reversal Area: 102,000 – 101,800
---
📌 *Trade Plan:*
- Bearish bias below wedge
- Neutral bias inside wedge
- Bullish if price breaks and holds above wedge top
---
💬 Let me know your thoughts below.
🔁 Like, Comment & Follow for more clean setups!
---
📍This is for educational purposes only. Not financial advice.

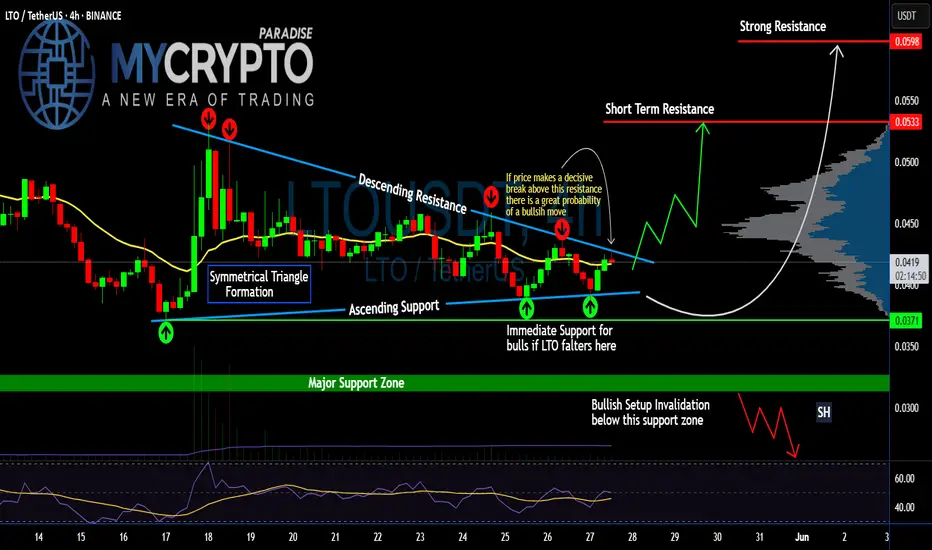
Is #LTO Ready for an Explosive Move or Another Trap Ahead? Yello Paradisers! Are you watching how #LTO is quietly tightening within a triangle while the rest of the market looks away? This might just be the last moment of silence for #LTONetwork:
💎#LTOUSDT is currently consolidating within a clean symmetrical triangle, wedged tightly between a descending resistance and an ascending support trendline. This pattern has already seen multiple touches on both edges, suggesting price is nearing the point of decision.
💎What makes this formation more compelling is how #LTOUSD is holding just above the immediate support at the $0.0371 zone and 20EMA is also acting as support. This area has acted as a launchpad twice already, keeping bullish hopes alive. Price is once again pressing against the upper boundary of the triangle, increasing the odds of a breakout on the next attempt.
💎If bulls manage to push above the descending resistance and we see a confirmed breakout with strong volume, the first upside target sits at $0.0533, which is a key short-term resistance level. From there, momentum could carry the price toward $0.0598, where a strong historical resistance lies based on the volume profile.
💎However, the bullish structure is clearly invalidated on a break below $0.0321. Any decisive move under this support zone would shift the short-term outlook in favor of the bears, potentially opening a path toward lower support.
Discipline, patience, robust strategies, and trading tactics are the only ways you can make it long-term in this market.
MyCryptoParadise
iFeel the success🌴
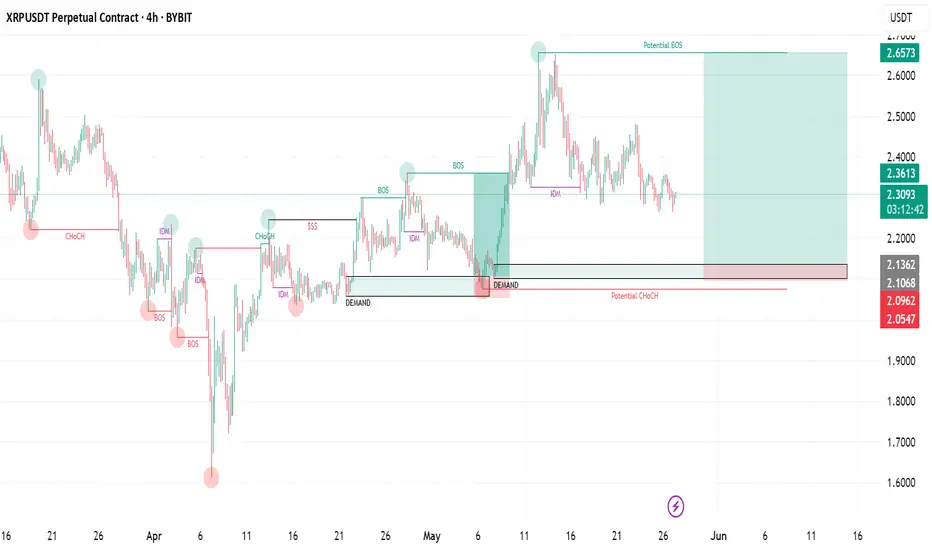
XRPUSDT 4H | Untested Demand Zone RevisitIn this 4-hour chart analysis of XRPUSDT, I’m focusing on a clear and well-defined untested demand zone between 2.05–2.13 USDT . Unlike the first demand zone (already tested and played out), this second zone has not been retested since its formation, making it a fresh area of interest for a potential long setup.
Why this matters :
Untested demand zones often act as powerful magnets for price when revisited, as they represent areas where large buy orders might be waiting to be filled. Because this zone has not been revisited yet, there’s a higher probability for a bullish reaction when price returns to it.
Key Technical Factors :
✅ The 2.05–2.13 demand zone was formed following a significant bullish impulse that created a clear break of structure to the upside.
✅ Price is currently consolidating above this demand zone and also above a potential bearish CHoCH at 2.0784 . This suggests that the bullish structure is still valid unless price breaks below 2.0784.
✅ My bullish target is 2.65 USDT , where previous highs were formed and potential liquidity exists.
✅ My stop loss is set just below the demand zone, around 2.05 , to protect against a deeper retracement or a shift in market structure.
My Thought Process :
I expect that if price returns to the demand zone, there will be a strong chance for buyers to step in and push the market higher. However, I’m aware that if price breaks below 2.0784 , it would signal a bearish CHoCH and invalidate the long scenario. Therefore, patience is key — I’ll wait for price to either test the zone and react strongly or stay above 2.0784 to keep the bullish bias intact.
Clear Trade Setup :
📌 Entry Zone : 2.05–2.13
🛑 Stop Loss : Below 2.05
🎯 Take Profit : 2.65
🧩 Invalidation : Break below 2.0784
💬 Let me know if you have a similar zone marked out or if you see a different setup! Let’s share ideas and refine our strategies together.