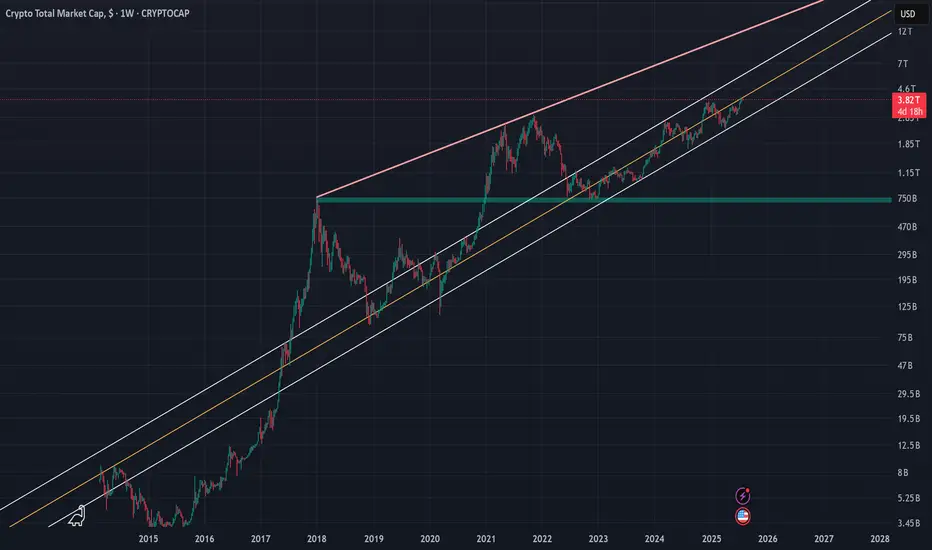
Crypto Total Market Cap (TOTAL) | 1WThe crypto market cap represented by the symbol TOTAL can be considered the most important index for analyzing the cryptocurrency market, although I believe that analyzing Bitcoin itself, given its strong positive correlation with the TOTAL index, would yield similar results. In the attached image, the red line actually indicates the overall resistance level of the symbol, and the drawn parallel channel illustrates the current upward trend of the TOTAL symbol, which is now on the verge of encountering its round resistance at 4 trillion dollars. While we should expect a correction around this level, breaking through the 4 trillion dollar resistance could likely lead to a market cap of 6 to 7 trillion dollars in the next phase. On the other hand, with support at 2.4 trillion dollars based on the 100-week SMA on the weekly timeframe, the 750 billion dollar level—marked by a green zone in the image—can still be considered the most important long-term market support, even before the fifth halving.
I will try to continuously update this analysis of the TOTAL symbol according to market changes and developments. Also, I welcome reading your critiques and comments, so don’t forget to leave a comment!
Cryptocap
ETH Charging Familiar Resistance
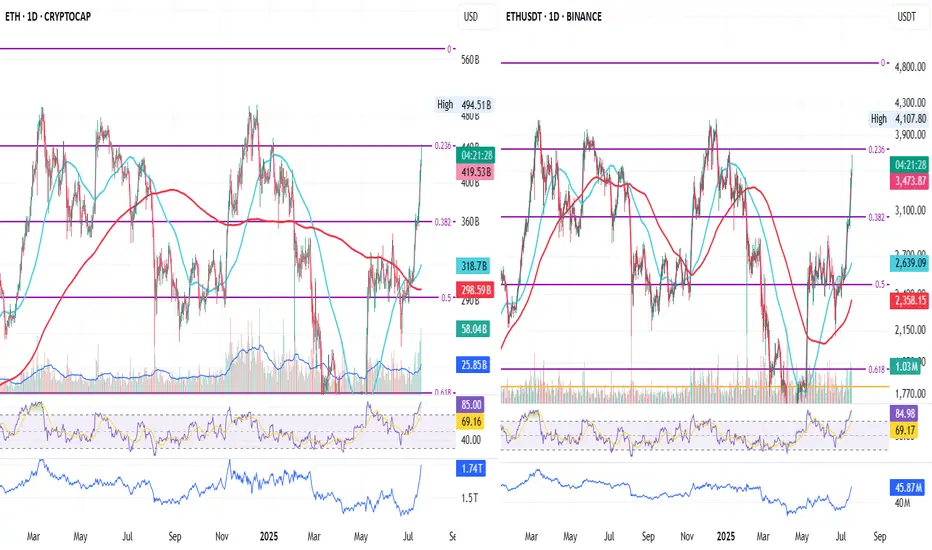
We’re looking at ETH Cryptocap (left) and ETHUSDT (right), both on the daily timeframe.
ETH Cryptocap has just touched the 0.236 Fib level, and ETHUSDT is only a few dollars away from it.
Since March 2024, this level has consistently acted as resistance — each time price crossed it, it eventually retraced after hovering briefly above.
Will this time be different?
What’s clearly different now is volume : it’s rising along with price.
In the past 10 days, there’s only been one red volume candle, and even that was minor.
Meanwhile, RSI is firmly in the overbought zone.
I don’t know if ETH will go higher or start retracing, but I can prepare for both.
The simple solution: place a trailing take-profit order and let price move.
If it pulls back, I’ll lock in some gains.
If it keeps climbing, I’ll stay with the trend.
For me, everything else is just unnecessary complication.
Always take profits and manage risk.
Interaction is welcome.
TOTALCAP — The Next Trillion Crypto Move: Are You Ready?When people analyse the crypto market, they often default to Bitcoin and for good reason. It’s the one and only, the king. But sometimes, to see the forest instead of just the tree, you need to zoom out and study the broader picture.
That’s where the Crypto Total Market Cap (TOTALCAP) chart comes in. It’s essentially the mirror of Bitcoin, but it offers powerful macro insight — not just price, but scale. Looking at trillions instead of dollars changes how you frame support, resistance, and overall sentiment. Let’s dive in.
🧠 Why TOTALCAP Matters
TOTALCAP aggregates the value of every coin and token — the complete valuation of the entire crypto industry.
And while it often moves in sync with Bitcoin, it carries a different weight.
Shows the “big picture” of institutional and retail money flow
Offers clearly defined round-number zones (Trillions) as psychological S/R
Removes coin-specific anomalies and focuses on collective momentum
In bull and bear markets, these trillion-dollar thresholds act like major checkpoints. Watching how TOTALCAP interacts with these levels can give early signals that BTC or alts alone can’t.
Historical Key Levels & Structure
Let’s break it down by macro phases:
✅ November 2021 — Peak of Last Bull Market:
TOTALCAP peaked exactly at $3 Trillion.
This level acted as a ceiling — once hit, the market reversed sharply.
This marked the top of the 5-wave impulsive move (Elliott Wave theory).
📉 November 2022 — Bear Market Bottom:
TOTALCAP dropped below $1 Trillion, bottoming at $727 Billion.
This was almost a 0.786 fib retracement from peak — similar to BTC’s historical retracements.
The $1T mark was retested as resistance before being reclaimed as support.
📈 2023–2025 — The Bull Awakens:
$1 Trillion flipped into solid support throughout 2023.
A clear sign the macro market structure had shifted bullish.
Once $2T was breached, things moved fast.
🚀 Current State:
The market surged above the previous $3T ceiling.
TOTALCAP has hit a new ATH: $3.73 Trillion
Now, the question is: Is this the start of a new leg higher, or a bull trap before a correction?
🔍 Fibonacci Confluences — Why $3.7T Was Key
The sharp rejection at $3.7T wasn’t random. It aligns with:
1.0 Trend-Based Fib Extension: From 91.24B → 3T high → 727B low = 1.0 = 3.65T ✅ precise hit
1.272 Fib Extension of the macro move
Upper Pitchfork Resistance
Channel Top Rejection
→ All signals converged to mark that level as major resistance
🌀 Elliott Wave Macro Count
Looking at the weekly timeframe, we can see a clear impulsive 5-wave movement from the 2022 lows:
Wave 1: $727B → $1.26T
Wave 2: Correction to $975B ($1T) (support confirmed)
Wave 3: Massive rally toward $2.72T
Wave 4: Pullback toward $1.69T (VWAP retest)
Wave 5: $3.73T ATH
What does this imply?
According to classical Elliott Wave theory, after a full 5-wave move, the market tends to enter an corrective phase.
🔍 Some key levels to watch:
$3T: Historical S/R (was the 2021 top, now acting as a key level)
$2.31T: Recent swing low
$2T: Psychological and structural support
📌 Zone of Interest for Longs: $2.31T–$2T
This zone holds:
Previous consolidation zone from mid-2024
Fib retracement confluence
Likely forming Wave C bottom if this is a full ABC
🎯 Upside Targets — What If We Continue Higher?
Looking ahead:
🔸 1.618–1.666 Fib Extension = $4.42T–$4.53T
🔸 1.618 TBFE from previous cycle = ~$5.45T
📌 Rounded Targets: $4.5T, $5T and $5.5T
These are the next likely macro cycle targets — but only after a healthy correction and consolidation.
☀️ Macro Context & Summer Seasonality
Historically, summer tends to be a weaker period:
Lower volume
Institutional rebalancing
Geopolitical and macroeconomic uncertainty
📚 Educational Insight: TOTALCAP as a Tool
Treat TOTALCAP like the S&P500 of crypto.
Use round trillions as psychological levels: 1T, 2T, 3T, etc.
Always check if BTC’s price is aligned with where TOTALCAP is on the macro structure
Helps judge market strength even when BTC dominance is shifting
It’s especially useful when altcoins pump or dump out of sync with BTC — you can use TOTALCAP to track the real flow of money.
💡 Final Thoughts
We are likely in a corrective phase after a complete 5-wave cycle.
The area between $2.31T and $2T offers high-probability long entries
Watching how TOTALCAP reacts to these levels will help us anticipate the broader market’s next move
Summer slowdown could mean chop — but this also creates opportunities
💬 Let me know your thoughts: Are we entering a deeper correction? Or will TOTALCAP surprise us with a new leg higher?
Don’t forget to zoom out. The charts always tell the story.
_________________________________
💬 If you found this helpful, drop a like and comment!
Want breakdowns of other charts? Leave your requests below.

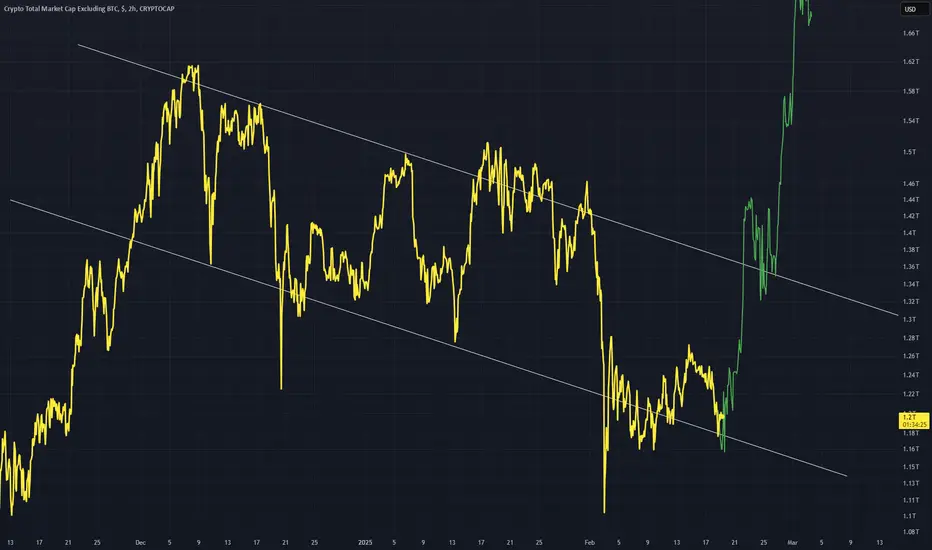
TOTAL2 - Breaking the Down ChannelThis is the 2Hr chart and I have plotted some green bars pattern suggesting a reversal out of this down channel
The down channel is due for reversal and price is settling at the lower band of the channel
I think the move up will be quick, very quick.
Expecting a day where there is 100% moves across the board for altcoins.
Again the 2Hr chart this is.
TOTAL2 - Big VolumeThe volume on the altcoin market is massive
a lot is being bought up
Expect price up to follow
Weekly timeframe

XRP Market Cap Creates New All Time High; Likely to ContinueImpressive. Market cap in November alone has gone on to gain 326%. XRP went from the number 8 spot back up to the number 3 spot with extreme swiftness.

TOTAL CRYPTO TICKER - moving average linesAll the moving average lines are in order and underneath the price of cryptocurrency, bitcoin too. If so, the signal would mean the price will maintain and continue forth onward to the new year. The potential for the market cap of cryptocurrency to double may be in the cards, the loftiness of trillions of dollars swelling cryptocurrency is a much tougher sell than Bitcoin, ideally. For all those active investors and active social viewers this post is of the utmost simplicity based on the simple method of keeping ideas useful.

CryptoCap - BTC - Bitcoin Idea IIhey guys,
the yearly chart is bullish - main target was the recent ATH at 1.3T.
Quarterly Chart: After the break of the 1.3T Line theres a close below it
-> leaving a bit of doubt about imminent bullish progression or a potential double top forming here. The Inside bar is giving a warning of a possible reversal.
Monthly Chart: Although the demand Line is still intact there is a little divergence on the stochastic
-> there is weakness of 3 months not being able to penetrate highs - but going into a Consolidation.
-> BTC is testing a bullish trendline which, ones it has been broken by a close of the monthly candle, could provide a bearish setup and a possible double top scenario being in place.
I will wait for a break of the Consolidation to think about entering a trade.
Thanks for reading…

CryptoCap - ETH / Ethereum - Idea II - Triangle PlayHey guys,
yearly chart: bullish setup with targets around 435 and 577. (recent ATHs on closing base and by wick )
Quarterly: After a strong Q1 gain we see a trading back below 435 printing an inside bar... : bearish setup at a strong resistance level. Range of this quarter will be monitored closely on the 3D chart.
Monthly: 4 Months of weakness - with the last one not being able to reach the highs of the range.
-> Stochastic is turning down after forming a double top
-> Bullish trendline is still intact. It seems to be the last support before the lower high scenario will be in play. - alternatively looking at the triangle: waiting for a break of this structure and a retest
3D: very interesting. we see a consolidation of course - but there might be a fractal in play if you compare the 3D to the monthly chart.
However, I am seeing a bearish setup with an invalidation above 435. - keeping in mind that the yearly is still pointing up so we could easily be going just up from here.
thanks for reading…

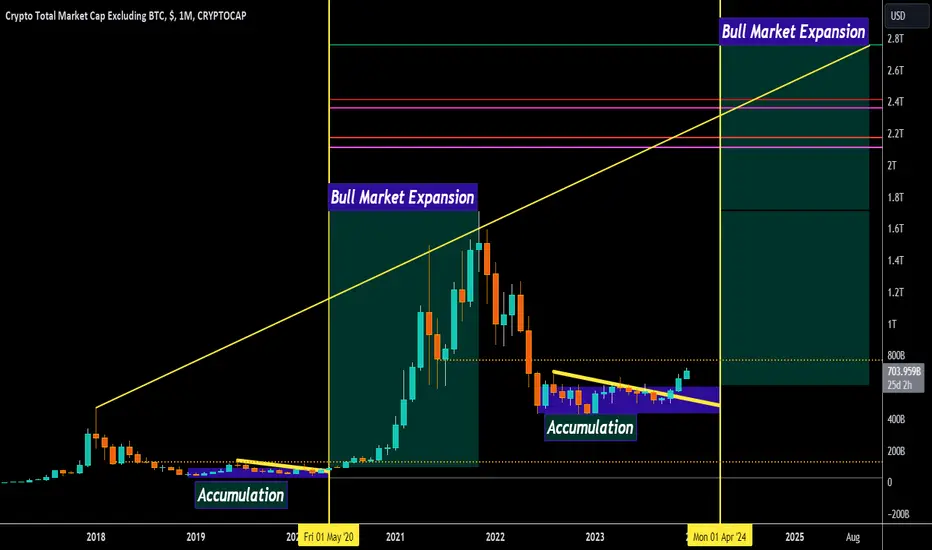
TOTAL 2 Cycles SynchronizationHere is the Cycles Synchronization of Crypto Total Market Cap Excluding BTC (TOTAL 2). At some point, between mid november and mid december 2025, I do expect around 3.5T Market Cap to be the top for the cycle. 1 year later, the Market Cap could be at around 1.5T, I think.
Will follow with interes...

Bearish 5-0 on (Total 3 Excluding - LTC and Stablecoins)There is a Bearish 5-0 visible on the Daily on the Total Market Cap Ex- BTC, ETH, LTC, and the two big USD-based Stable Coins; if it plays out, I think Total 3 will make a new low that will likely take it down to the macro 0.886.
We also have some Hidden Bearish Divergence on the RSI to back it up.

Crypto Total Cap w/ BTC & ETH Adj Realized CapIn this quick idea we have a look at the total crypto market cap with BTC & ETH adjusted realized cap overlayed in the main pane. This chart uses both market and on-chain data.
Total Crypto Market Cap:
The red/green bars displayed
BTC
BTC Adjusted Realized Cap: The light gray line.
BTC Adjusted Market Top Projection: The light red line.
BTC Adjusted Realized Base: The orange line.
ETH
ETH Adjusted Realized Cap: The dark gray line.
ETH Adjusted Market Top Projection: The dark red line.
ETH Adjusted Realized Base: The yellow line.
Below the main pain we have the DB ZPS RSI (length 2) for the total market cap on a 4 month timeframe which shows the overall crypto market cycle.
On the bottom pain we have the DB ZPS RSI (length 2) for the total market cap on a monthly timeframe which shows the local cycles.
The aim of this idea is to show a clear picture of the total crypto cap with comparison to BTC and ETH realized cap timeframes. IMO this chart is interesting as it shows the cap cycles and displays the BTC to ETH cap and tops.
I hope ya'll find it useful! Cheers!

Total Market Ranging Between Two ImbalancesLots of traps either way but notice the big picture. We could easily go way down to finish out the imbalance area below 905 trillion. We sfp'd (swing failure pattern'ed) to the top of the imbalance area already but still seem to gravitate towards the golden pocket. Will update soon.

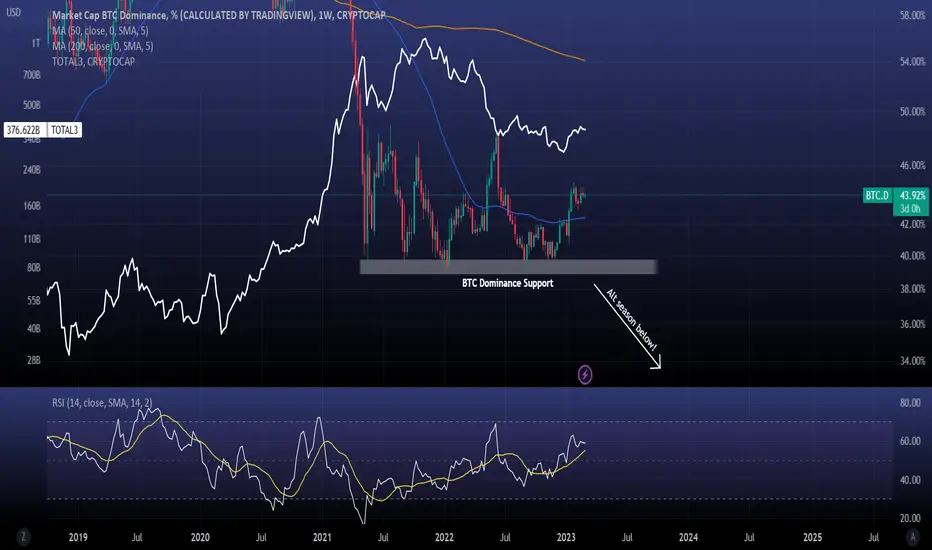
BTC DOMINANCE Below this level, the alt season starts!BTC Dominance has a clear Support Zone inside 39.70% - 38.90%. This has been holding for almost 2 years.
The white line is the Total Crypto market cap excluding Bitcoin and Ethereum. Mostly negatively correlated to BTC Dom.
A break under the BTC Dominance Support Zone starts the alt season.
Follow us, like the idea and leave a comment below!!
Pattern Similarity with 2018 Bear Market RecoveryWhat follows is a comparison of the daily chart during the 2018 bear market recovery with the present weekly chart. Markets like to repeat patterns, with similarities and differences:
Repeating Pattern Similarities:
Both made a head and shoulders top
OBV and Volume show similar patterns of behavior in both charts
The amount of correction prior to recovery is similar
Repeating Pattern Differences:
2018's head and shoulders top had a descending (or practically straight) neckline. 2023's head and shoulders top has an ascending neckline
OBV has dipped more during the present downtrend than before, and Volume peaked earlier during the head/shoulders top this time (Volume is also down more now than it was during 2018 recovery, respectively)
Signs are pointing to a recovery, but DXY is behaving strangely and market conditions are entirely different than they were in 2018.
2023 Recovery may be higher than 2018, if neckline is reached - it could look like a double-top with a lower high (potentially even another HS pattern at the end)
Should the pattern repeat itself again on the higher time frame, I've outline a rough path that could take us into one of the two red boxes, or even somewhere in between, with:
-- Conservative Targets near previous head and shoulder top lows
-- Aggressive Targets stopping at or near the ascending neckline, and this would coincide with my theory of a lower high double-top, which I think is the more likely scenario (see related idea below)
-- Otherwise the potential to stop somewhere halfway in between either
Chart is long until recovery completes at one of the levels above.
This idea fails immediately if we fail to remain above the wedge here on a re-test on the falling wedge breakout (3-day chart pictured below):
Related Idea - neckline targets coincide with lower-high double-top theory:
Cheers, and thanks for taking the time to read through my ramblings!
-- dudebruhwhoa

TOTAL MARKETCAP CRYPTOCAP:TOTAL
Crypto is in severe down trend since the start of 2022. Since then we are making lower lows and lower highs. recently we have break out of bearish flag pattern which isn't really good news for crypto
the total market cap is looking to retrace back to $700-800B dollars it will bounce back. the previous support of 1.16T marketcap is now a massive resistance.
it's inevitable for market to not retest 700-800B zone.
i will start DCA from 700-750B marketcap. at this point we are gonna have higher chance of getting in the market at right time.
what to do now ?
As trader / Investor I would start DCA

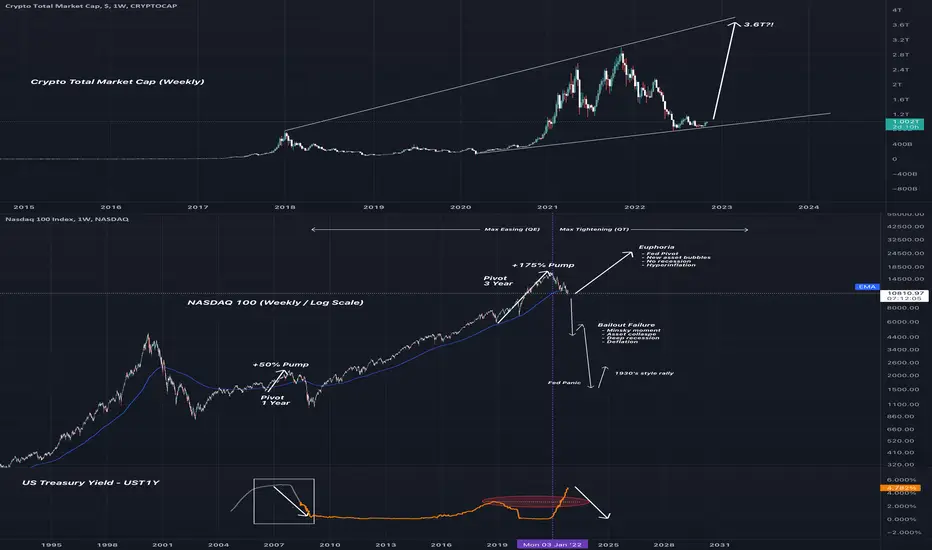
New Incoming Blow Off Top?Is the greatest market euphoria ahead of us?
New ATH before the big bust?
Traders enjoyed a 3 year Fed pivot rally, that began in early 2019 and continued through 2021. This was 3 times the size of the blow-off-top in 2006-2007.
Is a Fed Pivot Rally In The Cards?
What's up about crypto market cap. TOTAL CRYPROCAPHello my friends. Everything is clear on the chart for you like always, I expect the bars to fill the second box and then come down again.
Good luck.
If you like the idea, do not forget to support with a like and follow me for next analysis :)
Write your comment and opinion here to me

USDC.D needs to close below support zone for crypto rally#USDC.D
#CRYPTOCAP
Market Cap USDC Dominance is below lower line of triangle and retesting the broken line.
breaks down the support zone will trigger a bullish rally across the crypto market.

#BTC/USDT 4HR CHART UPDATE !!Hello, community members welcome to another BTC/USDT chart update.
If you find this update helpful, shoot the like button follow and share your views in the comment section.
As we can see in the chart mentioned above that BTC is still trading inside a falling expanding channel in a sideways mode.
BTC currently consolidating between the price range of $18.8k - $21.7k.
Here BTC needs a clear break above the price level of $22k to towards upper price levels.
Until then we can scalp in USDT pair altcoins because as we know when BTC moves sideways USDT pair coins perform well.
IMO, BTC will move upside towards the price level of $22k again one or two more times in this sideways market.
NOTE: This is not financial advice. This is for education purposes only. I am not responsible for the profits or losses you generate from your investments.
DO YOUR RESEARCH BEFORE MAKING ANY TRADES.
Thank you.

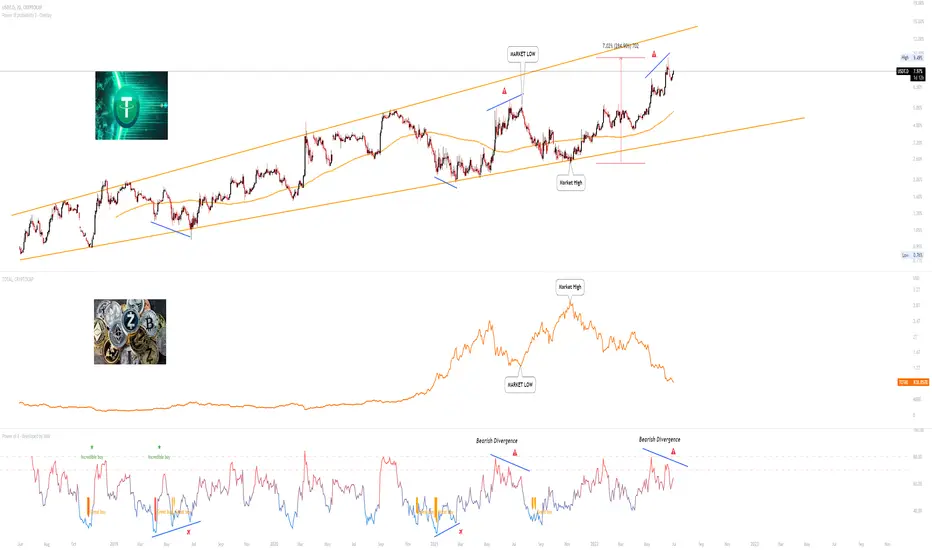
Tether Dominance - Bearish Divergence Current Market Cap - 6.3 Billion
Tether dominance has risen over %284 ever since the market peaked back in November last year.
However, it is starting to show weakness after it made a higher high while RSI made a lower low.
The last time RSI printed a divergence, it signalled the market bottom and money started flowing back into cryptocurrency
We could potentially see a similar move.
The orange line below, represents the total crypto market cap.
What is Tether Dominance?
Tether (USDT) Dominance shows how much percent of the money is on USDT. There is 2 cause of the increase of USDT dominance.
The first is that investors put cash on the market from the outside, which is due to the unfavourable weather in the market.
And the second is again, as the market falls, investors withdraw their funds from cryptocurrency investments and put them to USDT.
In both of them, a decrease in cryptocurrencies and an increase in USDT holders are observed.
Speculative Setup, DYOR. Allow 3-18 Months For all Crypto Ideas.
Credit to @without_worries for allowing use of indicators.
$CRYPTOCAPJust an idea based on the Z-score. Most people are still expecting a last trip to the downside.
I find this Fib Fan to be an amazing tool to spend trend reversal and mixed with the Z-score something like this could easily play out.
Thoughts?
