Phemex Analysis #79: KAITO Surge 85% in 48 Hours!KAITO token has recently experienced a significant surge, gaining approximately 85% in the past 48 hours. This explosive price action has drawn considerable attention from traders and investors. The surge appears to be fueled by increased investor interest driven by new partnerships and expanding community rewards, particularly the integration of Huma Finance's Yapper leaderboard. Kaito is an AI token based on the BASE blockchain. The platform aims to enhance user experience and engagement within decentralized finance (DeFi) by providing AI-driven insights. This analysis will delve into the potential reasons behind this surge and explore possible trading scenarios for KAITO.
Possible Reasons
The recent price surge in KAITO can be attributed to a combination of factors:
Huma Finance Integration: KAITO's integration of Huma Finance's Yapper leaderboard has generated excitement. Yappers, who actively engage with crypto-related content on X, are being rewarded through Kaito's platform. This collaboration is likely driving increased demand for KAITO tokens.
"Earn and Drop" Season: Kaito founder Yu Hu announced the start of the "Earn and Drop" season, with collaborations like the one with PayFi Network's BOOP. These initiatives incentivize user participation and can contribute to positive price momentum.
Increased Transparency: The addition of Total Value Distributed data to Kaito's Dune Analytics dashboard provides greater transparency into reward distribution within the ecosystem. This transparency can boost investor confidence.
Community Growth: Kaito has experienced strong community growth, with a significant number of monthly active "Yappers." A vibrant and engaged community can contribute to increased token demand.
Token Withdrawals from Exchanges: Data indicates that investors have been withdrawing KAITO tokens from exchanges, suggesting accumulation rather than selling pressure.
Possible Scenarios
Given the recent surge, here are three potential scenarios for KAITO's short-term price action:
1. Continuation of the Uptrend
If KAITO maintains strong buying pressure, high volume, and positive sentiment driven by ongoing developments and community engagement, the uptrend could continue.
Pro Tips:
If the price continues rising, consider taking short-term profits at key resistance levels like $1.78, $2.02 & $2.43.
Monitor technical indicators such as the Relative Strength Index (RSI) and Moving Average Convergence Divergence (MACD) for confirmation of continued bullish momentum.
2. Bearish Reversal
Following the rapid price increase, KAITO is vulnerable to a bearish reversal. Profit-taking, negative news, or a shift in overall market sentiment could trigger a significant decline.
Pro Tips:
Watch for signs of weakening momentum, such as bearish divergence in the RSI or the formation of bearish chart patterns (e.g., double top, head and shoulders).
Be prepared to exit long positions quickly if a reversal occurs.
Consider short-selling opportunities if the price breaks below key support levels with strong volume, but exercise caution and manage risk effectively.
3. Small Dip Before Continued Rise
KAITO's price may experience a small dip, potentially towards the $1.00 level, followed by a consolidation period before resuming its upward trajectory. This scenario suggests a temporary pullback before the uptrend continues.
Pro Tips:
Identify the potential support level for the dip (e.g., $1.00).
Watch for signs of consolidation following the dip, such as sideways price action with decreasing volatility.
You might start accumulating KAITO during the sideways movement or look for a breakout above the consolidation range as a signal to enter long positions, targeting the previous resistance levels.
Conclusion
KAITO's recent 85% surge is driven by a combination of factors, including strategic integrations, community engagement, and positive market sentiment. While the current momentum is strong, traders should be aware of the inherent volatility in the cryptocurrency market. The three scenarios outlined above—continuation of the uptrend, bearish reversal, and a small dip before a continued rise—provide a framework for understanding potential future price action. By employing sound risk management practices, utilizing technical and fundamental analysis, and staying informed about developments within the Kaito ecosystem, traders can navigate the market effectively.
Pro Tips:
Trade Smarter, Not Harder with Phemex. Benefit from cutting-edge features like multiple watchlists, basket orders, and real-time strategy adjustments. Our unique scaled order system and iceberg order functionality give you a competitive edge.
Disclaimer: This is NOT financial or investment advice. Please conduct your own research (DYOR). Phemex is not responsible, directly or indirectly, for any damage or loss incurred or claimed to be caused by or in association with the use of or reliance on any content, goods, or services mentioned in this article.
Cryptocurrency

FINALLY SOME SENTIMENT AFTER FED FUND RATES!! BULLISH DXY BABY!Want to see the dollar trade higher and all foreign currency Pairs to trade lower. After new release price is really starting to show us its hand making it easier for us to look for a bias.

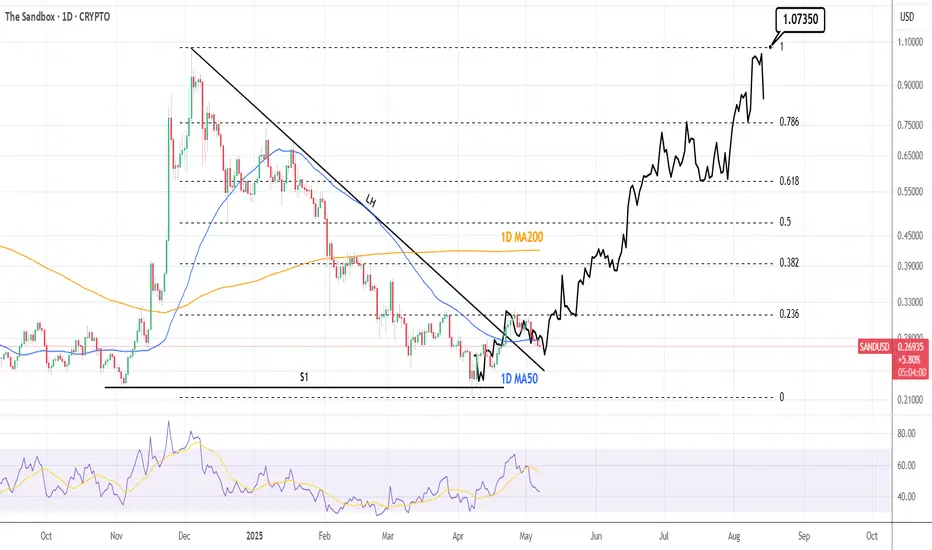
SANDUSD: The recovery back to 1.07350 has started.Sandbox (SANDUSD) is marginally bearish on its 1D technical outlook (RSI = 43.227, MACD = -0.001, ADX = 35.488) as it dropped below its 1D MA50 again. However, the breakout over its 5 month LH trendline has already happened and calls for a long term recovery. As you can see the Fibonacci retracement levels form fairly symmetric Resistances with the previous LH levels, so we expect them one by one to get filled (final TP = 1.07350).
## If you like our free content follow our profile to get more daily ideas. ##
## Comments and likes are greatly appreciated. ##
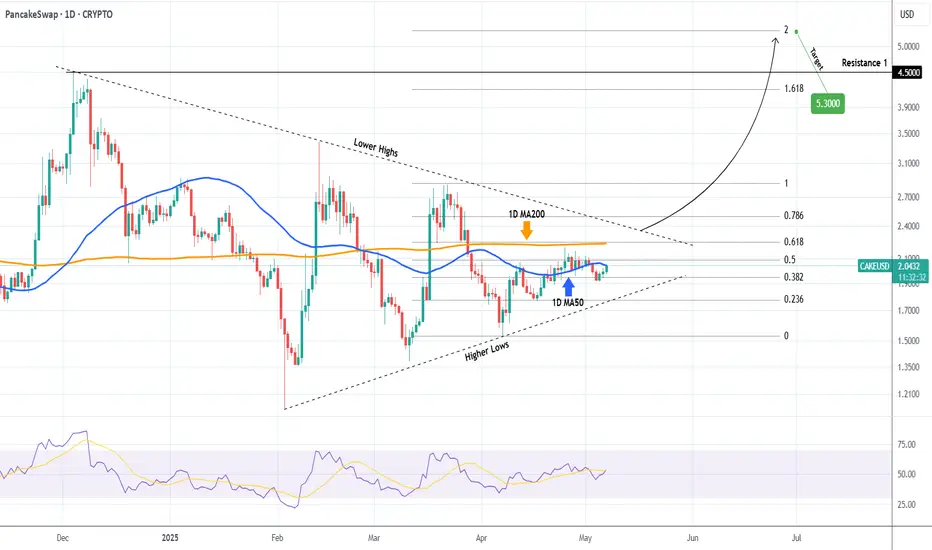
CAKEUSD Ahead of a monumental Triangle break-out.PancakeSwap (CAKEUSD) has been trading within a Triangle pattern since the December 04 2024 High and the price has been on the tightest squeeze possible since.
As you can see, it has been ranged for the past 2 weeks withing the 0.382 - 0.618 Fibonacci range and this is also reflected on the 1D RSI sequence.
If the price breaks above the top of the Triangle (Lower Highs trend-line), we expect a rally towards the 2.0 Fibonacci extension (5.3000). Alternatively, you may target on a safer note either Resistance 1 or the 1.618 Fib ext.
-------------------------------------------------------------------------------
** Please LIKE 👍, FOLLOW ✅, SHARE 🙌 and COMMENT ✍ if you enjoy this idea! Also share your ideas and charts in the comments section below! This is best way to keep it relevant, support us, keep the content here free and allow the idea to reach as many people as possible. **
-------------------------------------------------------------------------------
💸💸💸💸💸💸
👇 👇 👇 👇 👇 👇
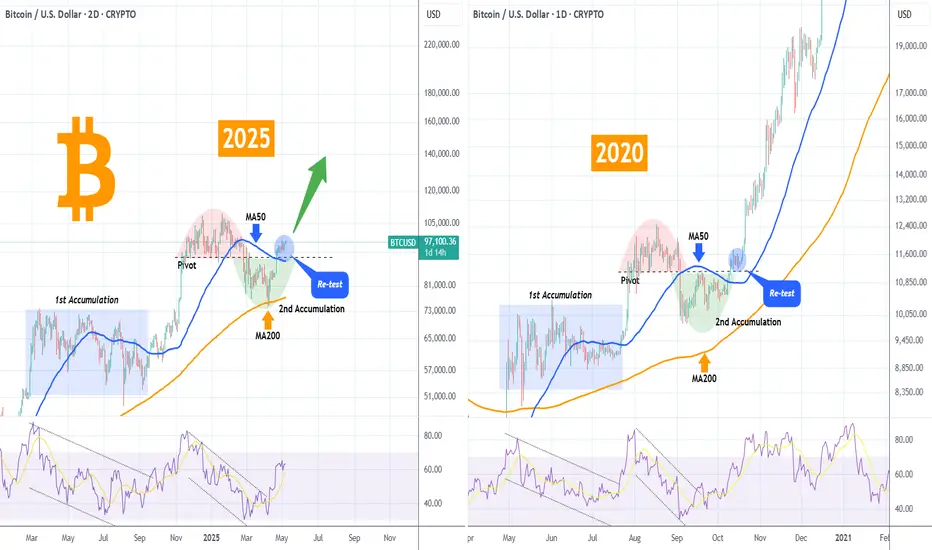
BITCOIN Mirror fractal from the past calls for massive rally!Bitcoin (BTCUSD) appears to be repeating almost the exact same price action as mid-late 2020 as it has broken above the Pivot trend-line that separates the recent distribution from the 2nd Accumulation phase and has successfully re-tested it while the MA50 (blue trend-line) is holding as Support.
If the latter continues to hold, then it might fuel a massive rally similar to October 2020 - April 2021. As you can see both fractals started of with a 1st Accumulation Phase (blue Rectangle) being supported always by their respective MA200 (orange trend-line), which led to the eventual Distribution Phase (red Arc). Even their RSI sequences are identical.
Is this another pattern supporting that BTC will reach at least $150k next? Feel free to let us know in the comments section below!
-------------------------------------------------------------------------------
** Please LIKE 👍, FOLLOW ✅, SHARE 🙌 and COMMENT ✍ if you enjoy this idea! Also share your ideas and charts in the comments section below! This is best way to keep it relevant, support us, keep the content here free and allow the idea to reach as many people as possible. **
-------------------------------------------------------------------------------
💸💸💸💸💸💸
👇 👇 👇 👇 👇 👇
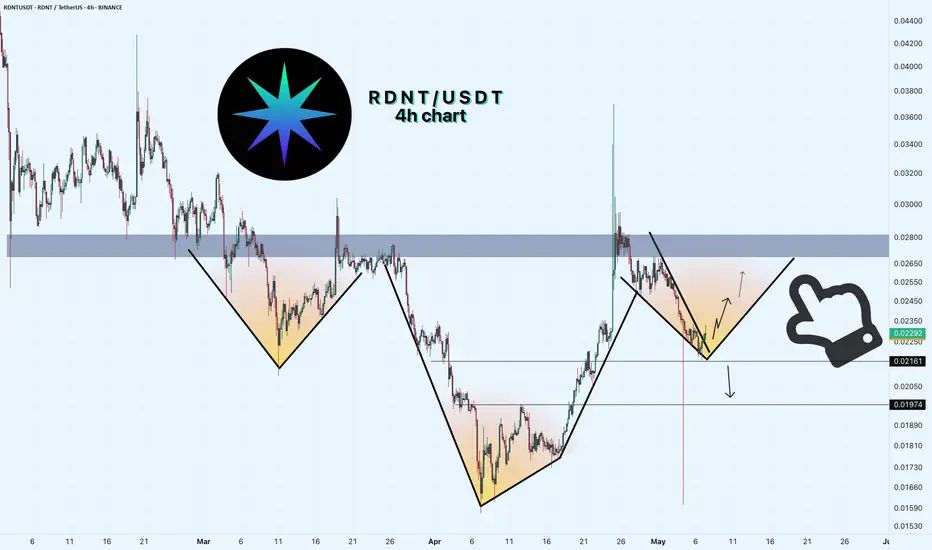
RDNT/USDT 4H Chart: Inverted Head and Shoulders? Hey traders! Let’s dive into this 4-hour RDNTUSDT chart.
Radient Capital is setting up a classic pattern that could signal a big move!
We’re seeing an inverted head and shoulders forming, with the price breaking above the resistance of Wedge around $0.2290. The "head" bottomed out near $0.1590, with the shoulders forming at higher lows.
If this pattern plays out, we could see a bullish surge targeting $0.2650 and higher!
However, if the breakout fails, we might see a pullback to the shoulder low at $0.2160 or even the support at $0.1974.
Key Levels to Watch:
Resistance: $0.2650
Support: $0.2160 (shoulder)
Breakout Target: $0.2650+
Breakdown Risk: $0.1974
Is RDNT ready to soar, or will this breakout fail? Drop your thoughts below!
BTCUSDTHello Traders! 👋
What are your thoughts on BITCOIN?
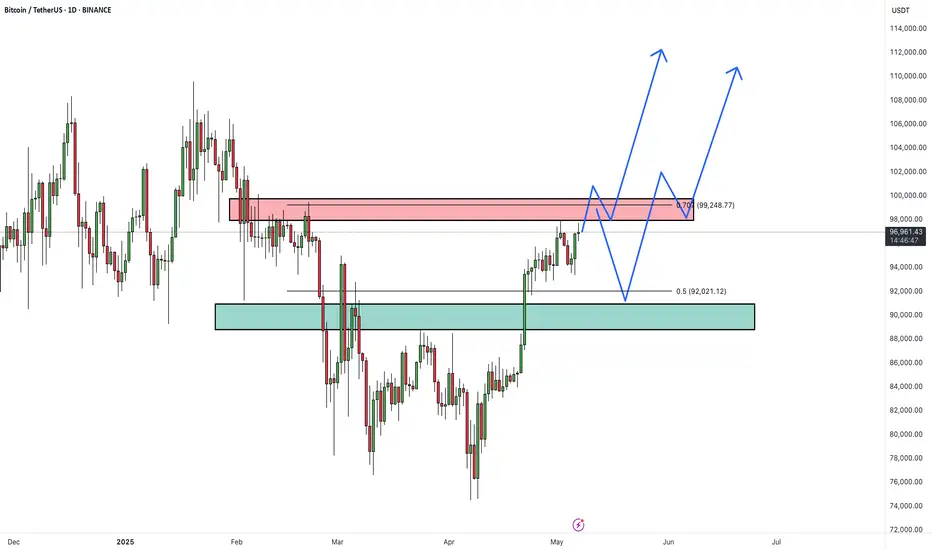
Bitcoin is currently testing a major resistance zone between $98,000 and $100,000, which also aligns with the 0.707 Fibonacci retracement. This area has previously acted as a strong supply zone, raising the possibility of a short-term rejection.
Scenario 1 – Bullish Breakout:
If price breaks and closes above $100,000, we could see a strong continuation toward $106,000 → $112,000, driven by momentum and possible FOMO.
Scenario 2 – Deeper Pullback Before Continuation:
If Bitcoin gets rejected at resistance, a retest of the lower support zone (previous demand area) may follow.
A successful bounce from that support could reignite bullish momentum in the medium term.
Trading Strategy:
Wait for a confirmed breakout and candle close above $100K for a high-conviction long entry.
Alternatively, look for buy setups on a pullback toward the support zone for a better risk-reward entry.
How are you planning to trade this setup? Breakout or dip-buy? Share your strategy below! 👇
Don’t forget to like and share your thoughts in the comments! ❤️
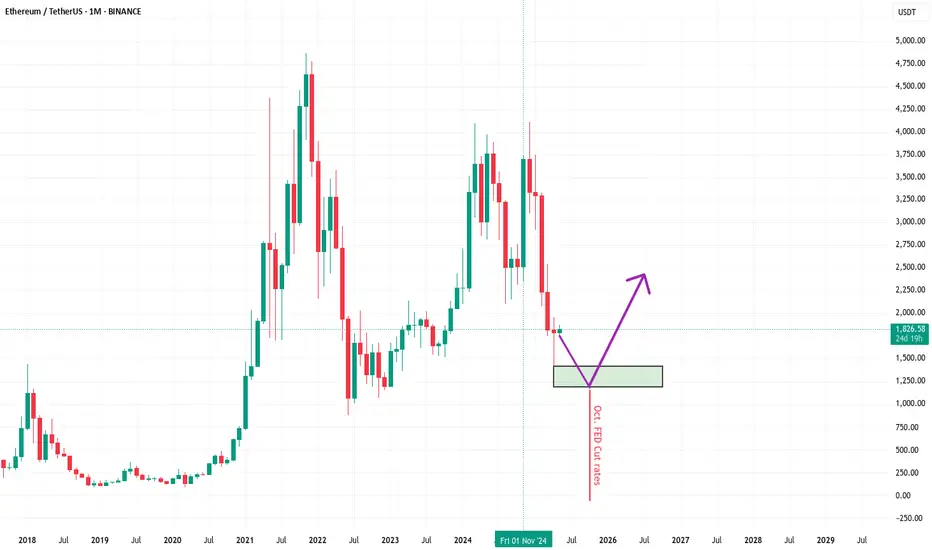
ETH Summer BearishA potential path for ETH before resuming a bullish major trend, is drawn with a purple arrow.
I don't think the FED will cut rates today. In fact, maybe in September. Maybe. If the FED cut rates, then the target scenario (green box in the chart) would not play out, we would shift to a bullish movement. I wish for that, but I don't think is near yet.
That being said, the current potential risk, I calculated it to -30% from current levels. Exact prices are impossible to predict, rather I focus on target areas.
DISCLAIMER:
Do Your Own Research, don't use mine to invest! This is not a financial advice, it is only a mere opinion of mine. I own several cryptocurrencies, including ETH.
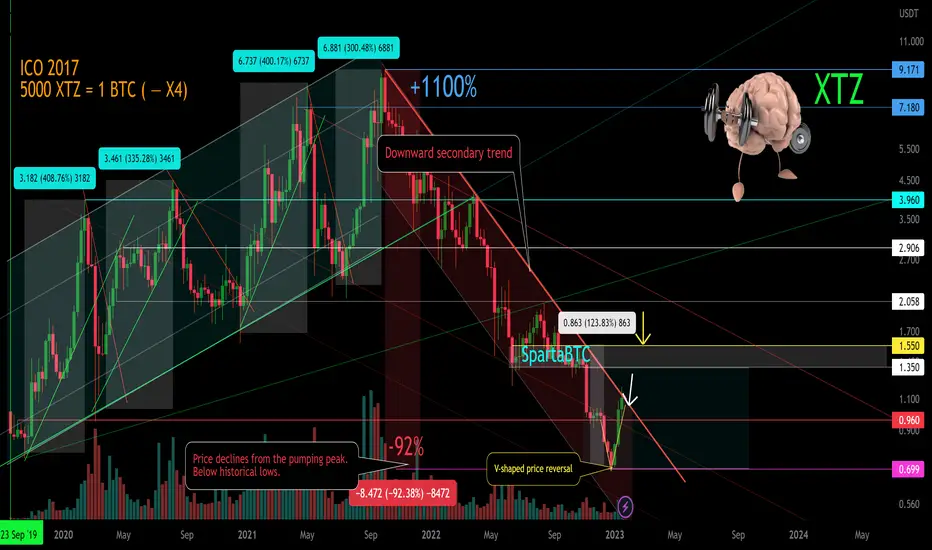
XTZ/USD Main trend. Downward channelLogarithm. Time frame 1 week. Main trend.
Idea for understanding the local work zone for traders in the main trend. It will also be useful for investors to understand the cheap/expensive zones for investing.
Linear price chart.
Secondary trend. Downward channel. Area to work. Time frame 3 days.
XTZ/USD Secondary trend. Downward channel.
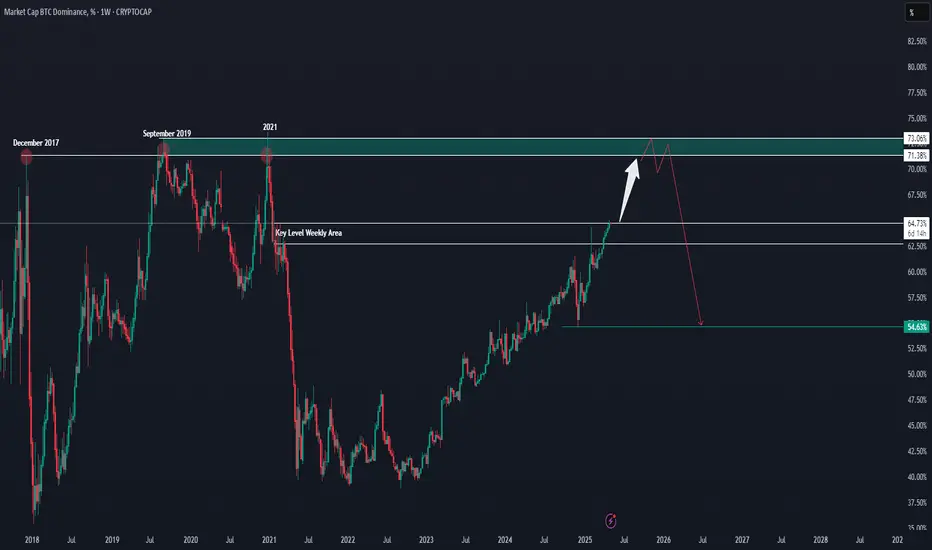
No Altseason Until BTC.D Hits 70%?Bitcoin Dominance (BTC.D) is currently climbing and approaching a major resistance zone between 71.38% and 73.06%. This area has proven to be a strong turning point in the past, acting as a top back in December 2017, September 2019, and again in 2021. These repeated rejections suggest that this zone is likely to remain a key resistance.
Right now, BTC.D is sitting around 64.66% and still has room to push higher. However, if it enters the resistance zone again, there’s a strong chance it may face selling pressure and start reversing. The white arrow on the chart shows the possible move into resistance, while the red projection outlines the expected rejection and potential decline back toward the 54.63% level—another important support zone from the past.
In simple terms, BTC dominance might be nearing its peak, and once it reaches the upper zone, we could start seeing altcoins gain more strength as dominance falls. This chart helps anticipate when the market might shift from BTC-led rallies to altcoin outperformance.
BITCOIN Climbing the Fibonacci Staircase..Bitcoin (BTCUSD) has come into the Fed Rate Decision week stronger that ever, having staged an impressive rebound from the early-April Low. The consolidation of the last few days is of course a market reaction in anticipation of the big interest rate news.
Regardless of that, the Channel Up that is the underlying pattern from the start of this Bull Cycle has been filling on an impressive symmetrical scale all .382 Fibonacci extensions one by one. The most recent has been the 4.382 and naturally the next in line is the 5.382 Fibonacci extension.
Since the last one (4.382) was almost hit before the price pull-back, it would be more fitting to assume the next peak slightly below the 5.382 Fib ext as well as $170000.
This may very well be the final High i.e. the Cycle's Top before the next Bear Cycle begins, depending on the time it hits it.
Do you think that would be the case? Feel free to let us know in the comments section below!
-------------------------------------------------------------------------------
** Please LIKE 👍, FOLLOW ✅, SHARE 🙌 and COMMENT ✍ if you enjoy this idea! Also share your ideas and charts in the comments section below! This is best way to keep it relevant, support us, keep the content here free and allow the idea to reach as many people as possible. **
-------------------------------------------------------------------------------
💸💸💸💸💸💸
👇 👇 👇 👇 👇 👇

Phemex Analysis #78: Pro Tips for Trading SOLANA (SOL)Solana ( PHEMEX:SOLUSDT.P ) is known for its high throughput and fast transaction speeds, making it a popular choice for various decentralized applications (dApps) and traders. Large crypto-native funds are actively bidding for bulk SOL positions, betting on eventual U.S. spot-ETF approval. This analysis will outline potential trading scenarios for SOL, keeping in mind the volatility inherent in the cryptocurrency market and the interest from large crypto funds.
Possible Scenarios
1. Uptrend
If Solana demonstrates strong buying pressure, high volume, and positive news or developments, including potential U.S. spot-ETF approval, it could establish and maintain an uptrend. The interest from large crypto-native funds suggests significant capital inflows could drive prices higher in this scenario.
Pro Tips:
Identify key resistance levels, such as $157. A breakout above these levels, accompanied by increased volume, could signal a continuation of the uptrend.
Consider entering long positions on the breakouts, with stop-loss orders placed below recent swing lows to manage risk.
Short term profit targets are $179, $205 & $241.
2. Consolidation
Solana's price may enter a consolidation phase, characterized by sideways movement within a defined range. This could occur after a significant uptrend or downtrend, or as the market awaits further clarity on factors such as regulatory developments or ETF approval.
Pro Tips:
Identify the upper and lower boundaries of the consolidation range, such as $157 (upper) and $133 (lower).
Be patient and wait for a clear breakout or breakdown from the range before taking a position.
Consider range-bound trading strategies, such as buying near support and selling near resistance, but manage risk carefully.
3. Downtrend
Solana's price could decline due to various factors, including negative news, market-wide sell-offs, or a decrease in demand. However, the presence of large funds accumulating SOL may provide a degree of support during downturns.
Pro Tips:
Identify key support levels, such as $140 & $133. A break below these levels could signal further downside.
Consider exiting long positions or tightening stop-loss orders if the price breaks below important support.
For experienced traders, short-selling opportunities may arise during a downtrend, but this carries higher risk.
Conclusion
Solana presents both opportunities and risks for traders. Its high throughput and fast transaction speeds, combined with the interest from large crypto-native funds anticipating potential ETF approval, suggest the potential for significant price appreciation. However, like all cryptocurrencies, Solana is subject to market volatility and regulatory uncertainty. Traders should employ a combination of technical and fundamental analysis, practice sound risk management, and stay informed about market developments to make informed trading decisions. The potential for a U.S. spot-ETF adds a layer of complexity and opportunity, requiring traders to closely monitor regulatory news and fund flows.
Pro Tips:
Trade Smarter, Not Harder with Phemex. Benefit from cutting-edge features like multiple watchlists, basket orders, and real-time strategy adjustments. Our unique scaled order system and iceberg order functionality give you a competitive edge.
Disclaimer: This is NOT financial or investment advice. Please conduct your own research (DYOR). Phemex is not responsible, directly or indirectly, for any damage or loss incurred or claimed to be caused by or in association with the use of or reliance on any content, goods, or services mentioned in this article.

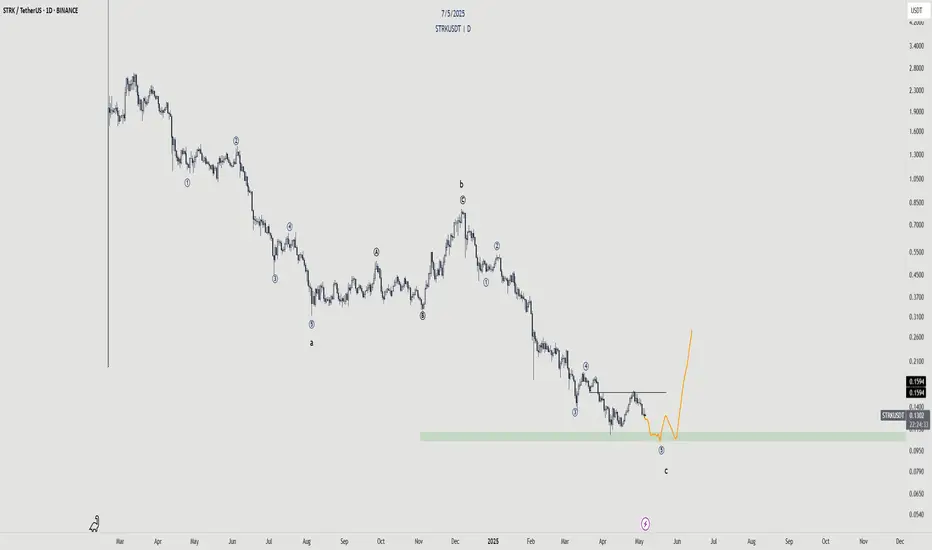
Starknet - Incoming Reversal?Starknet has been on a consistent downtrend. Its about time we finish this wave structure where we will see an impulse finish of Wave c.
Looking for the 5th wave to finish to sweep the low. However, the pullback seems very deep in that micro structure so its also likely we don't get that sweep. As long as we close below that wick from the green box and we can consider 5th wave to be done.
AI Prediction SOL/USD Trading Plan 24 hours!💰 May 4, 2025 8:52 pm. SOL/USD Trading Plan
Long Scenario
- Entry: Breakout above 148.50 (volume >8,000).
- Stop-Loss (SL): 145.50 (below support).
- Take-Profit (TP): 149.50 (below resistance).
- Trailing Stop: 1.5x ATR ($0.77).
- Confirmation: Supertrend (long), MACD bullish crossover, RSI >50.
Short Scenario
- Entry: Breakdown below 146.50 (volume >12,000).
- SL: 147.50 (above resistance).
- TP: 145.50 (above support).
- Trailing Stop: 1x ATR ($0.51).
- Confirmation: Supertrend flips short, MACD bearish, CMF <0.

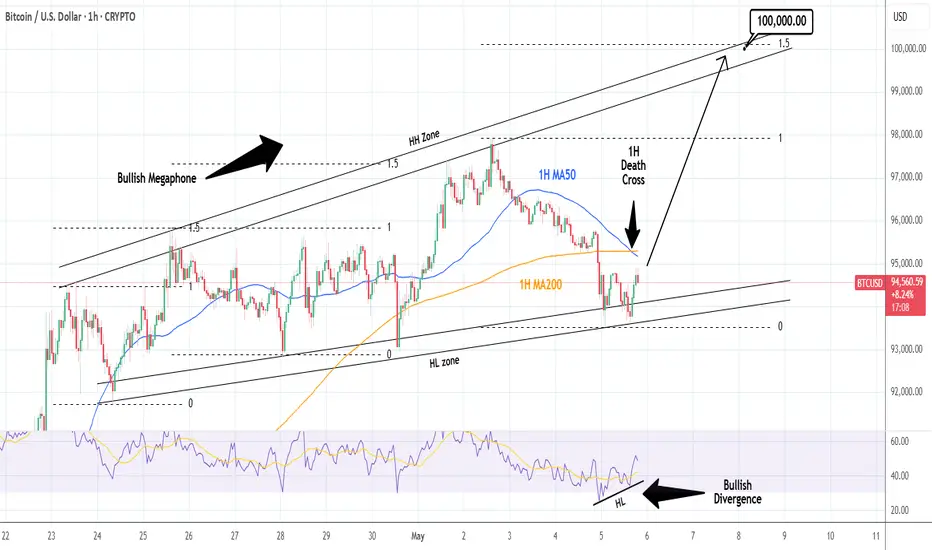
BTCUSD: 1H Death Cross might be dangerous but expect $100k if inBitcoin remains bullish on its 1D technical outlook (RSI = 61.614, MACD = 2557.800, ADX = 37.923) despite the correction since Friday's high. This is because the underlying pattern is a Bullish Megaphone which just bottomed. On the other hand, the 1H timeframe just formed a Death Cross. If this is invalidated and the price remains inside the Bullish Megaphone (also see that the 1H RSI is on a Bullish Divergence), we can see $100k on the next leg up (1.5 Fib extension like the 2 HH before). If the Bullish Megaphone breaks, testing the 1D MA200 at least, is veyr likely.
## If you like our free content follow our profile to get more daily ideas. ##
## Comments and likes are greatly appreciated. ##
BTCUSDA likely continuation on the buys for BTCUSD...
Simply expect all trap taken out then we expect a push to form a new high.

05/05/25 Weekly OutlookLast weeks high: $97,941.18
Last weeks low: $92,845.16
Midpoint: $95,393.17
FOMC week returns once again on Wednesday, the forecast suggests no change to the interest rate is expected with 4.5% staying as is. The tariff acceleration we saw last month brought into question the timing of rate cuts and if they would be brought forward, it looks like this FOMC is too early to see a cut but it is coming in the future if president Trump gets his way.
The chart is an interesting one but one that isn't too surprising. The orderblock that sent Bitcoins price to $74,500 was at ~$97,000, naturally that area would be major resistance and so a huge amount of Stop Losses were placed there, price swept that supply zone wiping out SL and SFP back under the resistance zone, a textbook move.
An accumulation under the resistance area would be a sign that the bulls are building to flip the zone, however a gradual sell-off from here would then look like a HTF lower high, a very bearish pattern.
Going into the FED interest rate decision there is usually a lot of de-risking/ sidelining from traders until the decision is made, therefor the second half of the week would give us more directional information.

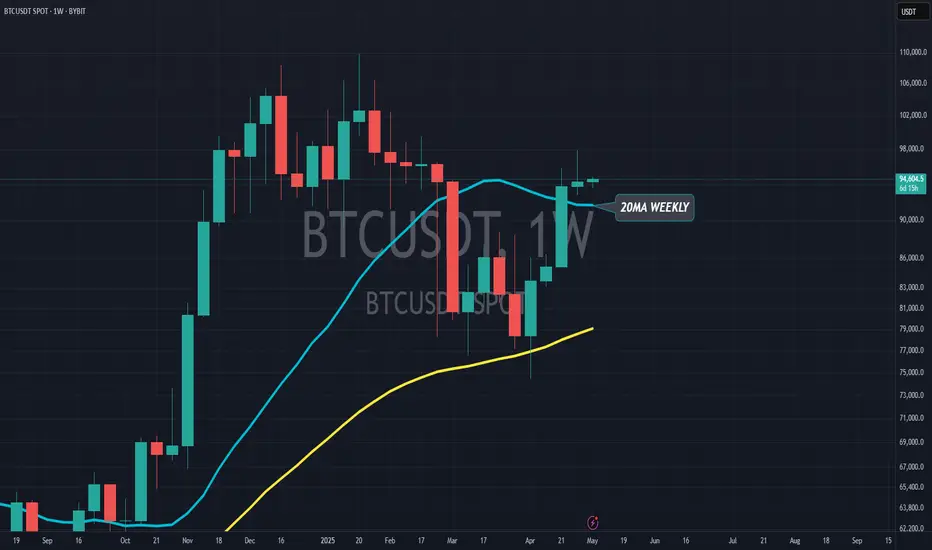
Bitcoin MAsAfter a good rally bitcoin had 2 weeks age, now still managing and staying above 20MA for weekly, which is really bullish to me
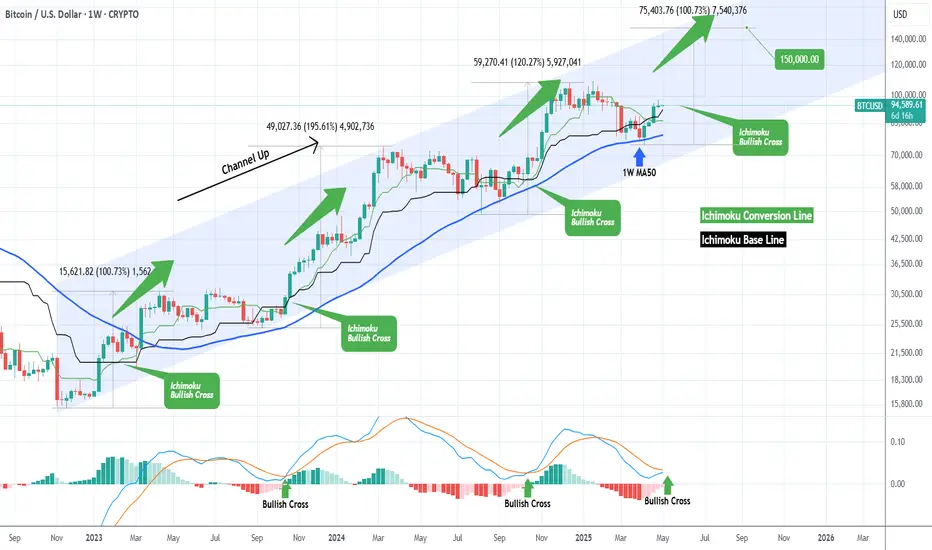
BITCOIN 1st 1W MACD Bullish Cross in 7 months!Bitcoin (BTCUSD) is ahead of completing this week a Bullish Cross on its 1W MACD, which will be the first one after 7 months (since October 14 2024).
This is a major technical bullish development as since the very first one (Sep 26 2022) right before the November 21 2022 Bear Cycle bottom, it has always kick-started the Bullish Legs of this 2.5-year Channel Up.
In addition to that, this was accompanied by an Ichimoku Bullish Cross, where the Conversion Line (green) crossed above the Base Line (black). Considering also that exactly 4 weeks ago BTC found Support and rebounded on the 1W MA50 (blue trend-line), we can safely confirm a Bottom there and call for the minimum +100.73% rise, similar to the first Bullish Leg of this Channel Up. We remain consistent to our $150000 Target.
So do you think this 1W MACD Bullish Cross is the final confirmation we need for the new Bullish Leg? Feel free to let us know in the comments section below!
-------------------------------------------------------------------------------
** Please LIKE 👍, FOLLOW ✅, SHARE 🙌 and COMMENT ✍ if you enjoy this idea! Also share your ideas and charts in the comments section below! This is best way to keep it relevant, support us, keep the content here free and allow the idea to reach as many people as possible. **
-------------------------------------------------------------------------------
💸💸💸💸💸💸
👇 👇 👇 👇 👇 👇
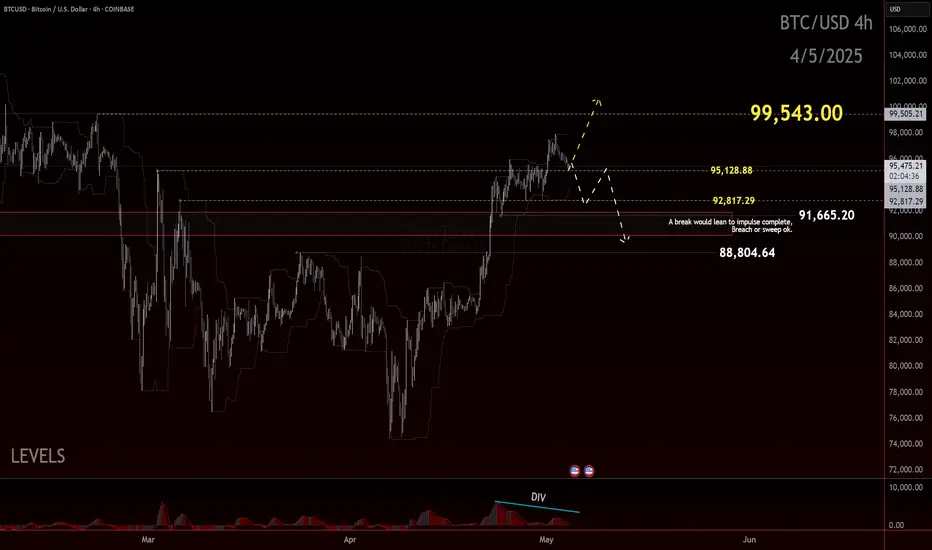
Watching for 88.5-89KMorning folks,
So, upside spike has happened and our 3-Drive + butterfly patterns are done. Although we haven't got continuation to 98K area that also was on a table.
Now short-term sentiment has changed. Recent data shows that the Fed doesn't need to hurry up with rate cut, yields turns up, so BTC also could follow the common tendency with deeper retracement.
This is the reason why we do not consider any longs today. As a nearest area that might be reached we consider 88.5-89K support.
So, for bulls it is nothing to do. If you're intraday trader, you could consider bearish positions from predefined Fib levels on the picture. 3-Drive hasn't reached its target yet, so 92.5-93K area still could be reached...

Bitcoin to create new All Time High?Fundamental Analysis
Uncertainty with the Dollar.
Institutional adoption of Bitcoin undergoing unprecedented acceleration.
COT report(Bitcoin Micro Futures) as of: April 29, 2025 shows Non-commercial traders still net short(-3,958) however, a larger percentage of investors who were short the previous week have closed their short positions(-17,401) as opposed to those long(-758).
Technical analysis(Daily TF)
Possible low of the year formed in April(on the 7th)
Displacement of sellers with buy stops above previous highs(2nd & 24th March)
-2 scenarios possible;
1. Correction to fill the liquidity void created on 20th-24th of April then continuation of the bull run or
2. If the daily FVG formed on the 1st of May holds, it could support price higher.

BTC: Balancing on the EdgeBitcoin held the $90.5K level and managed to flip prior resistance into support—an encouraging development, especially given how close price was hovering to the so-called danger zone. That flip marked a technical win for bulls, signaling potential strength in the short-term structure.
However, we’re not entirely out of the woods just yet.
While price is holding above support and showing some resilience, we’re still trading uncomfortably close to the edge of the recent consolidation zone. For now, $91.5K stands as the ideal level to hold.
The concern? If price starts slipping back below this newly established support, especially with conviction, that could be a signal of deeper retracement on the table. The bullish narrative would weaken significantly if we revisit and fail to defend those levels, potentially opening the door for a more sustained correction.
So, while the short-term structure remains cautiously optimistic, this isn’t the time for complacency. The market’s still in a precarious spot, and clarity will only come with either continued strength—or a confirmed break below support.
Eyes on $91.5K for now. Hold that, and the momentum favors the bulls. Lose it, and the deeper pullback scenario comes back into play.
Trade Safe, Trade Clarity.
BTC Outlook May 2025CRYPTO:BTCUSD
Bitcoin Nears Major Resistance – What Comes Next?
As of this writing, Bitcoin is trading around $96,000, climbing steadily as it approaches what I believe is a critical resistance zone between $98,000 and $102,000. This area has the potential to act as a major turning point.
If Bitcoin can break through and hold above the $102,000 level, I believe there's a strong chance we see continued momentum pushing the price toward $120,000 or even higher. However, if Bitcoin is rejected at this resistance zone, it could mark the beginning of a retracement, with the next major support area appearing around the $71,000 level.
This zone of resistance is, in my view, one of the most important to watch in the current cycle. Whether Bitcoin can establish new support above it—or get turned away—could shape the trajectory for the rest of the year.
Previous Bitcoin Outlook
Disclaimer: The views expressed in this article are my personal opinions and should not be considered financial or investment advice. Trading cryptocurrencies involves significant risk, and you should always do your own research and consult with a financial advisor before making investment decisions.
