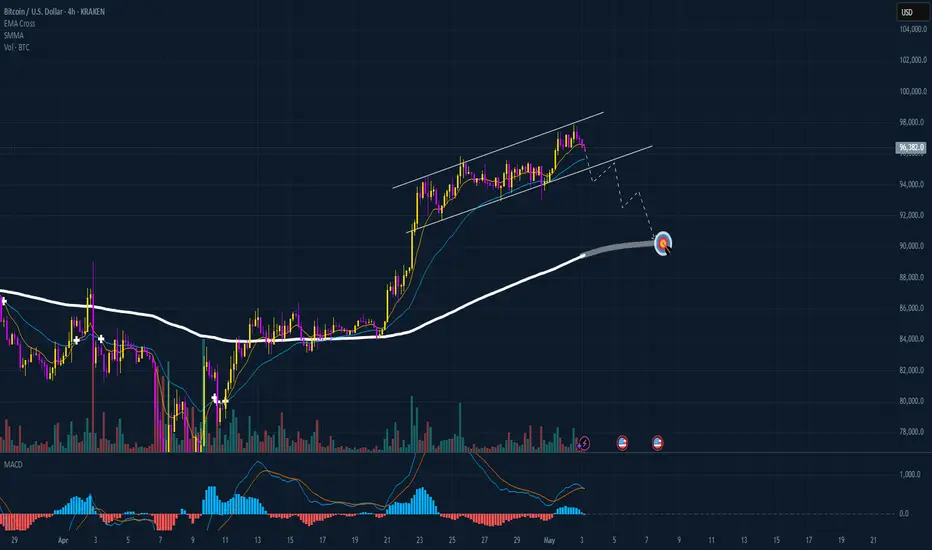
BTC HAVE A HIGH PROBABILITY TO FALL DOWN!!!The BTC starts looking weak and it's perfect time to long for a short. We are almost at the top of this run from last weeks and we can see that BTC made a perfect divergence pattern. My indicator shows me also that we are entering a mid-term bearish trend and there is a high chance that we are gonna fall much deeper than in last weeks. My target is clear and I'm holding my strategy so I wait for the price to hit my SMA line like it was in the last days but now I wait for the price to hit the SMA line at 4H chart because we didn't hit it since 2 weeks so in this moment we can see even in a few candles that the price is gonna touch it. I am actually in the short and waiting for the price to go for my target, we also have a weekend so the price will be probably slow but everything can happen. In my opinion next week are gonna be red and the price should touch my target. I recommend to watch a 1H and 2H chart and looking when price will hit the SMA line on these timeframes because my target is set in a 4H chart but we can book profits even when the price will hit the SMA at 1H and at 2H chart. Be careful and stay focused.
Cryptocurrency
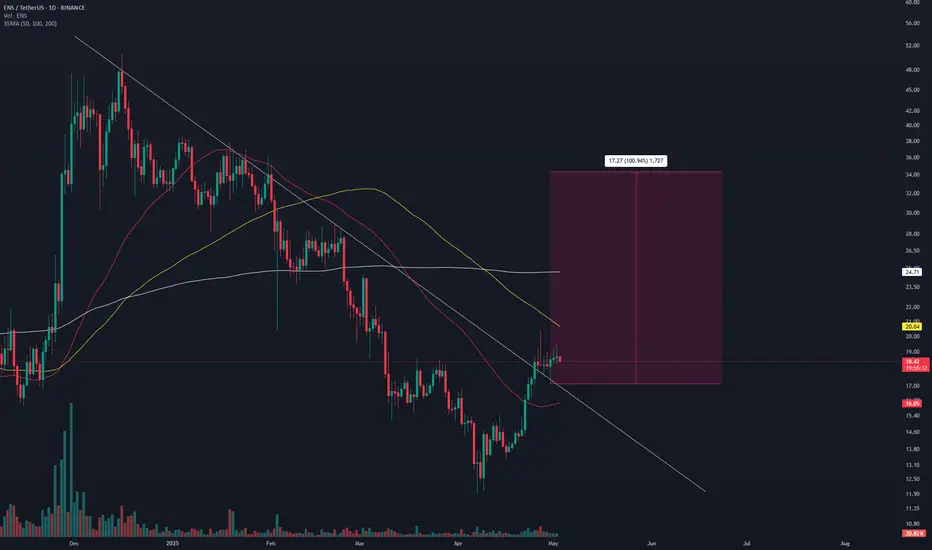
ENSUSDT Analysis D1ENSUSDT Following Setup Breakout,Retest Confirm Bouncing Expecting Solid Recovery In Coming Days .
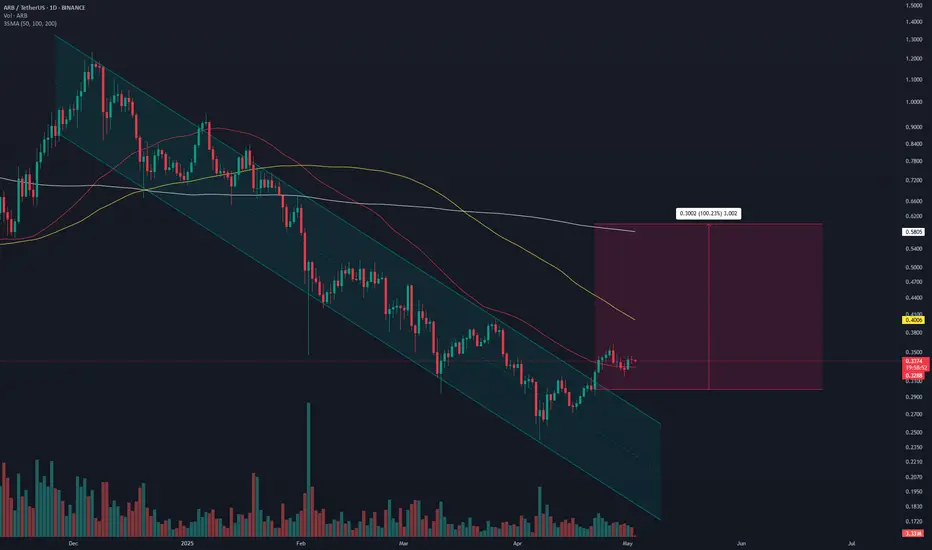
ARBUSDT Analysis D1ARBUSDT Descending Channel & Other Multiple Hurdles Has Already Got Cleared Arb Can Give Solid Bullish Rally In Coming Days
HIGHUSDT Analysis D1HIGHUSDT Already Broken Descending Broadening and started Recovery in D1 Chart
Continuity of momentum can see 80-120% Bullish Rally in Short-term .

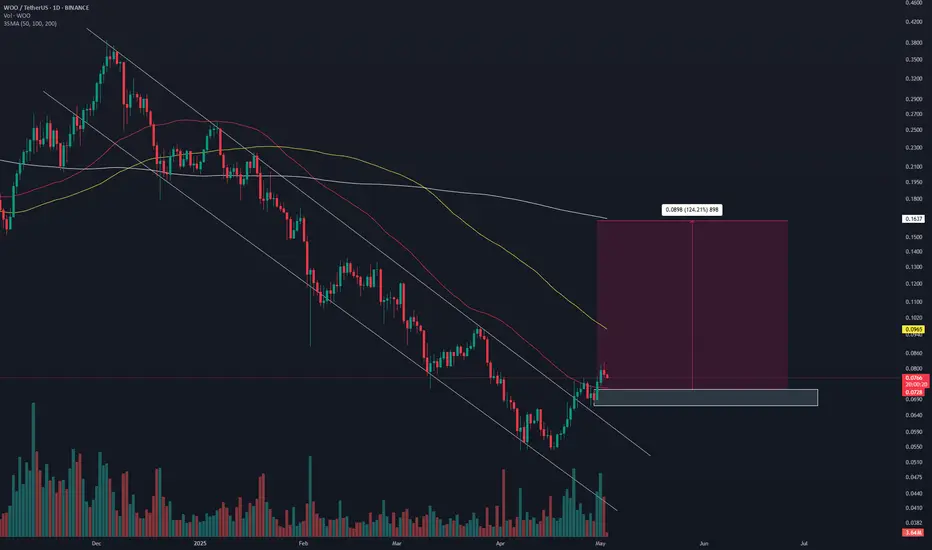
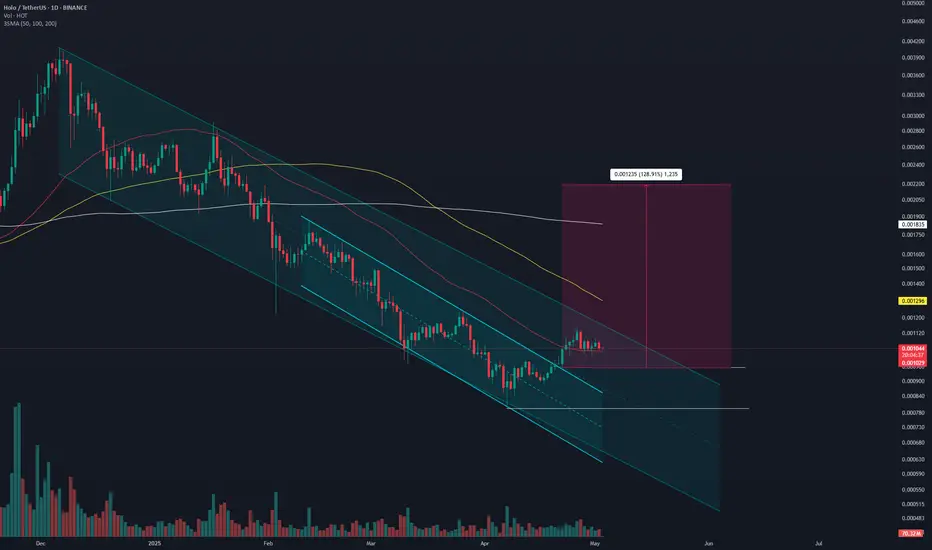
HOTUSDT Analysis D1HOTUSDT Horizontal Resistance Breakout & Retest Confirmed, Now Holochain Need To Break Descending Channel To Lead Solid Recovery, Expecting 150% Rally After Successful Breakout
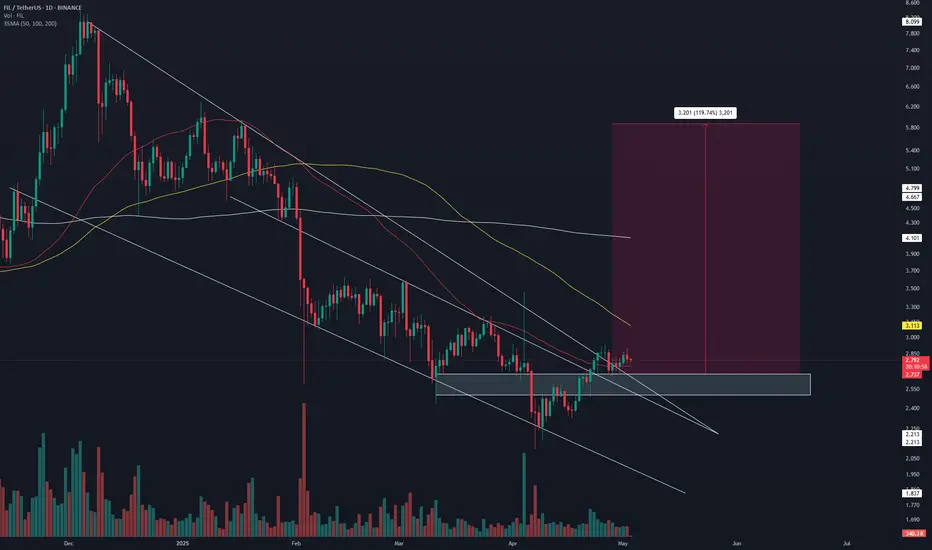
FILUSDT Analysis D1FILUSDT Looks Bullish So Far Falling Wedge Breakout, Retest Done, Horizontal Resistance Breakout, Retest Done, Another Trendline Breakout, Retest Done So Whats Next? In My Point Of View Rally Towards 5$ .
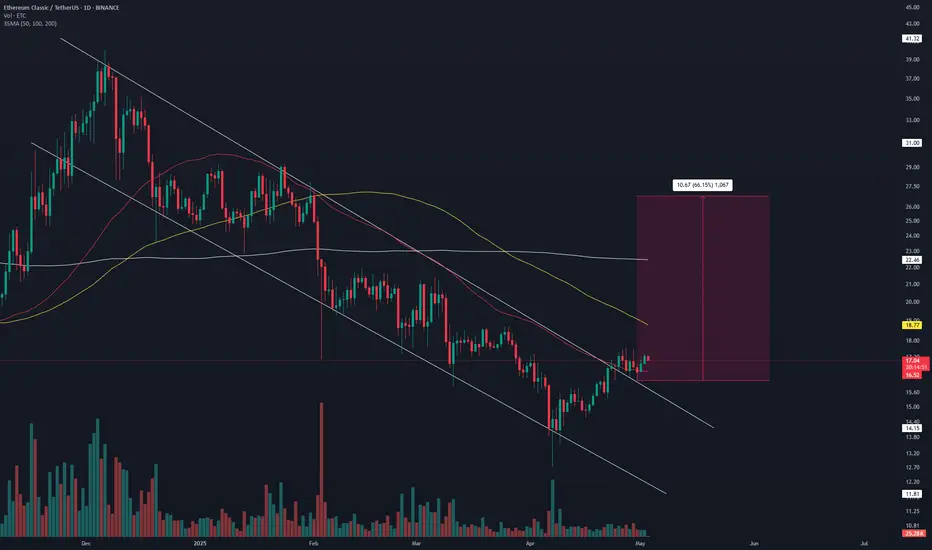
ETCUSDT Analysis D1ETCUSDT Trendline Breakout & Retest Has Already Confirmed, Currently Consolidating Within Bullish Pennant Once Pennant Got Cleared, Etc Can Lead Solid Recovery Towards 30-35$ In Coming Days .
IOTAUSDT Analysis D1IOTAUSDT Seems Like Ready For Strong Bullish Rally, Breakout And Retest Has Already Confirmed, Expecting 2x In Coming Days .

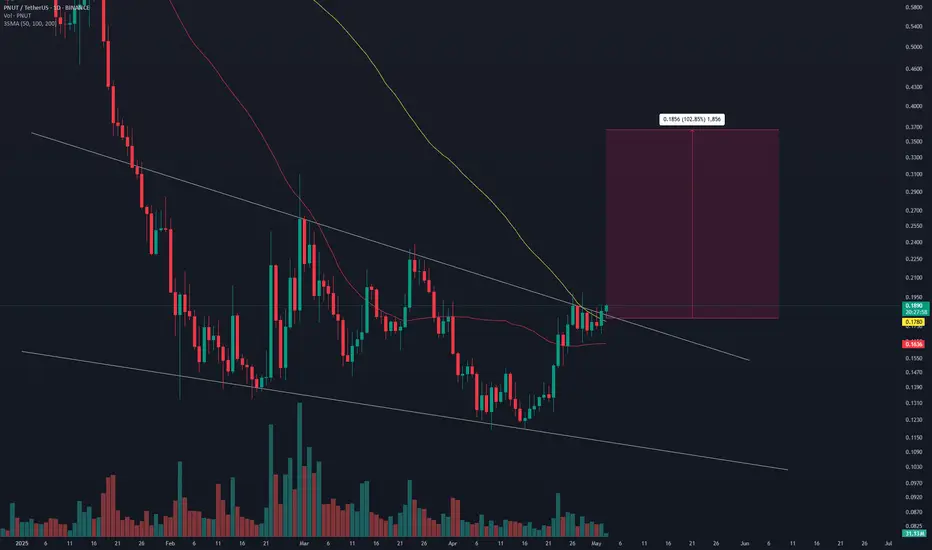
PNUTUSDT Analysis D1PNUTUSDT Building Up For Solid Breakout, Test Descending Trendline & On Verge Of Solid Breakout, usually This Type Consolidation Under Resistance Lead Massive Breakout, Expecting 2x After Breakout.
XLMUSD: Aggressive surge expected to at least 0.5500Stellar (XLMUSD) just turned bullish on its 1D technical outlook (RSI = 55.377, MACD = 0.005, ADX = 37.056), extending the rebound on its 1W MA50. The long term pattern is a Triangle so for the medium term the upside is limited to 0.55000. Since however the structure from mid 2024 resembles late 2016 onwards (price rising then pulling back to the 0.5 Fib), we expect a rise to the 1.618 Fib (TP = 2.5000) if the price crosses above the LH trendline.
## If you like our free content follow our profile to get more daily ideas. ##
## Comments and likes are greatly appreciated. ##

SUIUSD is consolidating ahead of massive Leg. Can it hit $9.500?Sui (SUIUSD) has completed Stage 1 of its recovery process following the April 07 bottom. That was a Higher Low on the 2-year Fibonacci Channel Up and having already broken above both the 1D MA50 (blue trend-line) and 1D MA200 (orange trend-line), the price is now consolidating.
This is fairly similar to what it did on September 20 2024, which was followed by a strong rise to the 1.0 Fib (previous High) where the price pulled-back to the 1D MA50. That was its final test before the peak forming rally just above the 1.5 Fibonacci extension.
As a result, we expect SUI to hit at least $9.500 on the long-term.
-------------------------------------------------------------------------------
** Please LIKE 👍, FOLLOW ✅, SHARE 🙌 and COMMENT ✍ if you enjoy this idea! Also share your ideas and charts in the comments section below! This is best way to keep it relevant, support us, keep the content here free and allow the idea to reach as many people as possible. **
-------------------------------------------------------------------------------
💸💸💸💸💸💸
👇 👇 👇 👇 👇 👇

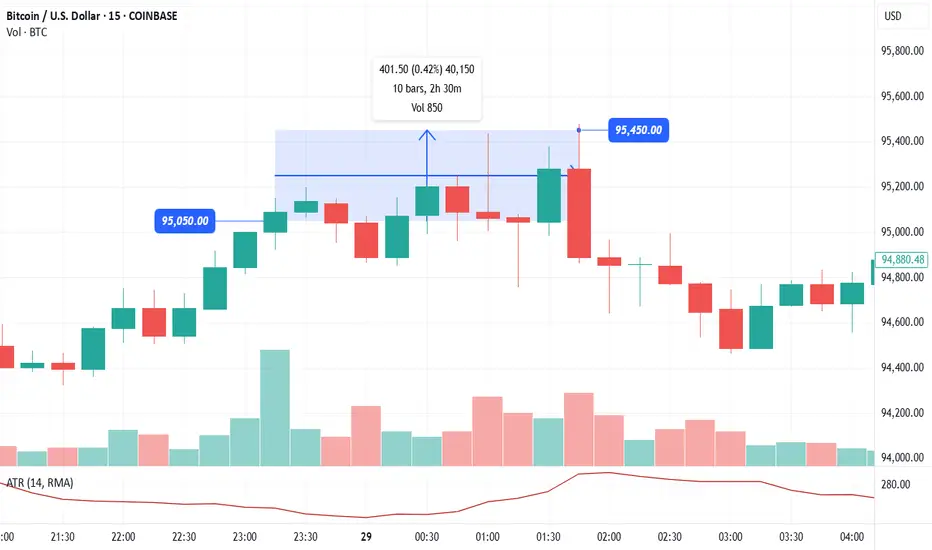
+0.42% Gain: BTC/USD April 28th Trading Plan Success📈 BTC Trade Recap (Apr 28): Bullish breakout plan hit!
✅ Long entry @ $95,050 -> Take Profit 1 = $95,450 = +0.42% profit.
🐻 Short setup didn't trigger
💰 +0.42% profit.
You can find the trading plan in the 'Related publications' section in the lower right corner.
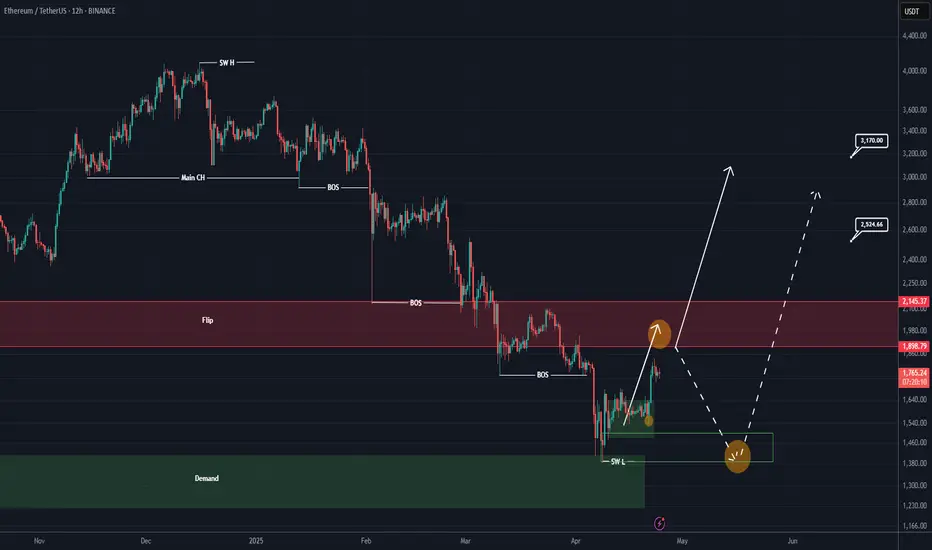
ETHEREUM is getting ready for a major breakout (12H)This analysis is an update of the analysis you see in the "Related publications" section
The red zone represents a supply area based on the Philip strategy. It’s possible that the price might not be able to break through this zone on the first attempt. If the price gets rejected, the lower green box will be a re-entry opportunity for those who missed the move.
Let’s closely monitor this chart and see how it plays out.
A daily candle closing below the invalidation level will invalidate this analysis. invalidation level : 1198$
For risk management, please don't forget stop loss and capital management
When we reach the first target, save some profit and then change the stop to entry
Comment if you have any questions
Thank You
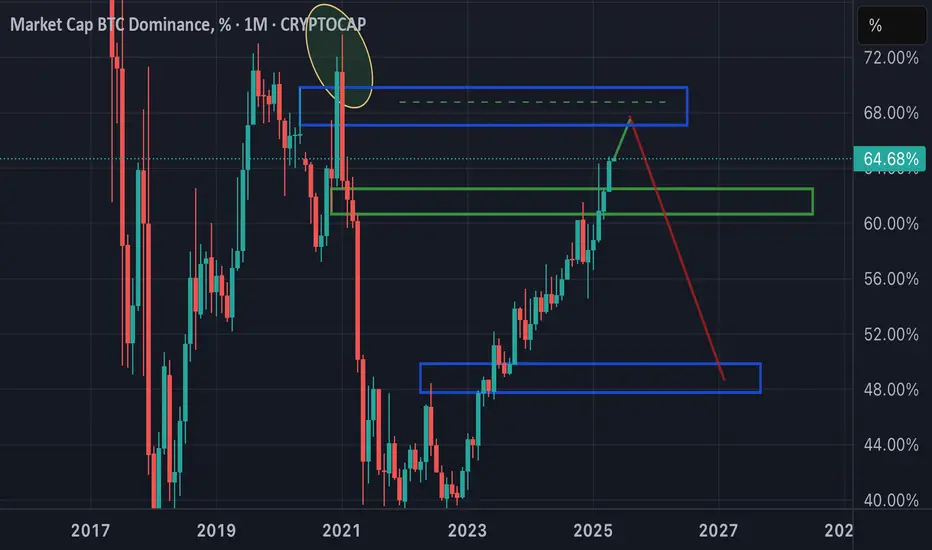
BTC DOMINANCEBitcoin dominance could break down at this point, potentially signaling the start of an exceptional altseason.
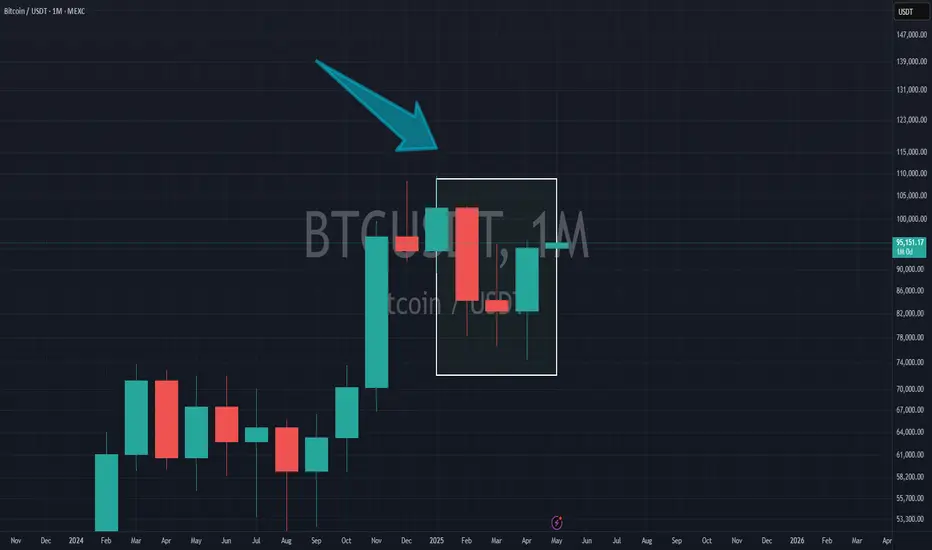
BITCOIN is filling all gaps as it should.Bitcoin (BTCUSD) is having its strongest 1D green candle since April 22 (for now) and basically today's analysis is a continuation/ modification of our April 14 buy call (see chart below):
Our Target was $99500 but we now update it to $106000 as we see a different pattern through filling the Lower Highs gaps. As you can see, since BTC's April 07 bottom, the rebound has filled one Lower High of the downtrend after the other.
At the same time, it has posted identical rallies before consolidating, the 1st one +15.37% and the 2nd +15.11%. We are currently on the 3d and if it makes again +15.11%, then it gets us to $106.9k. That is marginally above the Lower High of January 30, practically the first Lower High after the January 20 All Time High (ATH).
Moreover, the 2.0 Fibonacci extension level is at $106k and this is why we've moved our short-term Target there. This fills all dynamic conditions of this uptrend.
Do you think that's a fair estimate? Feel free to let us know in the comments section below!
-------------------------------------------------------------------------------
** Please LIKE 👍, FOLLOW ✅, SHARE 🙌 and COMMENT ✍ if you enjoy this idea! Also share your ideas and charts in the comments section below! This is best way to keep it relevant, support us, keep the content here free and allow the idea to reach as many people as possible. **
-------------------------------------------------------------------------------
💸💸💸💸💸💸
👇 👇 👇 👇 👇 👇

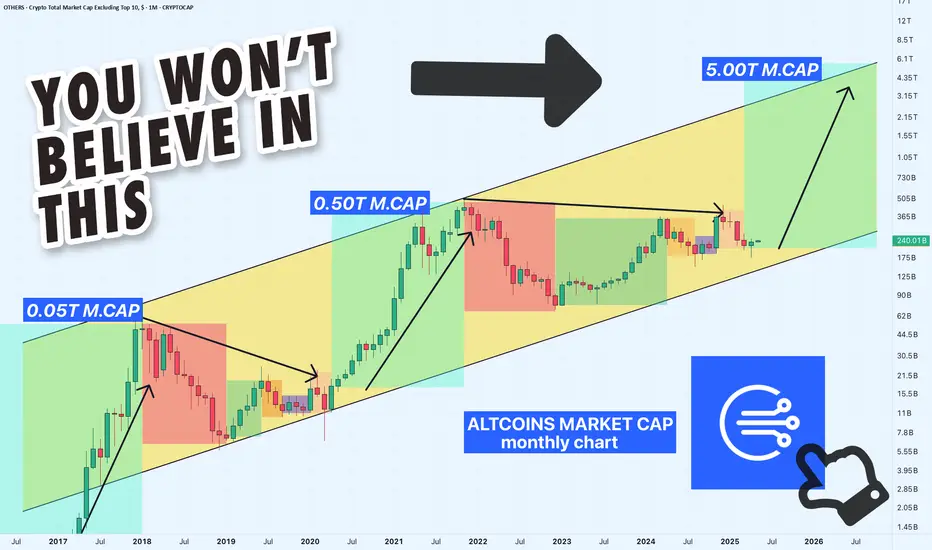
Altcoins Market Cap: We on the Verge of a 5T Exposion!Hey crypto traders! Let’s dive into this monthly chart of the Altcoins Market Cap. You won’t believe what’s brewing!
We’re currently approaching a critical channel support at 200B, a level that might act as a springboard for massive rally — check out the jumps from channel support in 2019 and 2023! Each time the market cap hit this support, it skyrocketed, and now we’re at that pivotal moment again.
The chart projects a jaw-dropping target of $5T within the next 24 months if history repeats itself!
The price action shows we’re testing the lower boundary of this ascending channel, with the market cap sitting around 239.65B. A bounce here could send altcoins on a parabolic run, potentially hitting 5T by mid-2026. But if support fails, we might see a dip toward 100B — let’s keep an eye out!
Key Levels to Watch:
Support: 175B (channel support)
Resistance: 1.55T, 5T (projected target)
Breakdown Risk: 100B
Are altcoins about to explode to 5T, or will we see a deeper correction? Drop your thoughts below!
PS take a look at others vs. btc price action here:
Bitcoin 1-Hour Chart: Quick Market BreakdownIn this concise market review, we'll analyze the latest movements on Bitcoin's 1-hour chart.

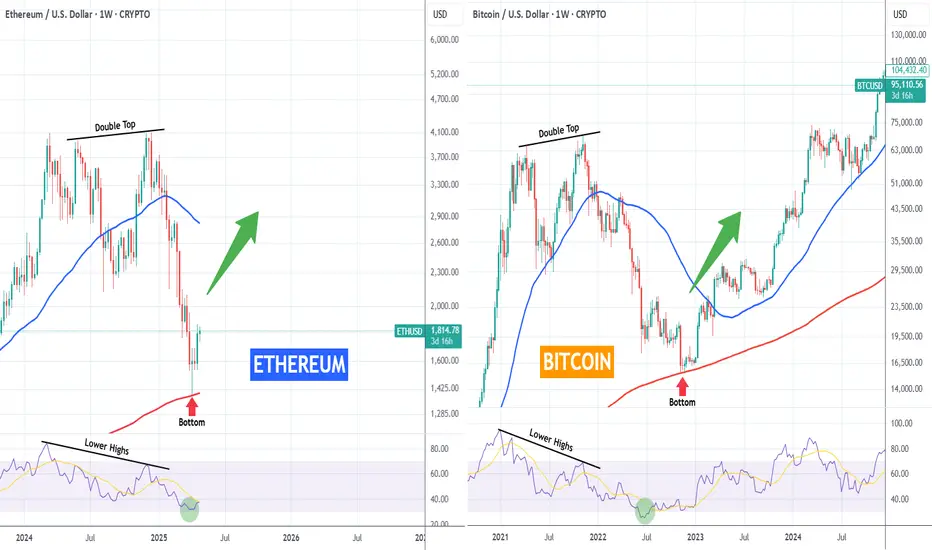
ETHEREUM vs BITCOIN fractals you'd never thought to look at!Odd comparison but you'd be lying if you say those fractals between Ethereum (ETHUSD) 2024 - 2025 and Bitcoin (BTCUSD) 2021 - 2022 don't look similar. But if you do believe it, can this mean ETH is about to see a rally to a new All Time High?
Anyway as the title says, this is fun fractal for comparison purposes only. The conclusion is yours!
-------------------------------------------------------------------------------
** Please LIKE 👍, FOLLOW ✅, SHARE 🙌 and COMMENT ✍ if you enjoy this idea! Also share your ideas and charts in the comments section below! This is best way to keep it relevant, support us, keep the content here free and allow the idea to reach as many people as possible. **
-------------------------------------------------------------------------------
💸💸💸💸💸💸
👇 👇 👇 👇 👇 👇
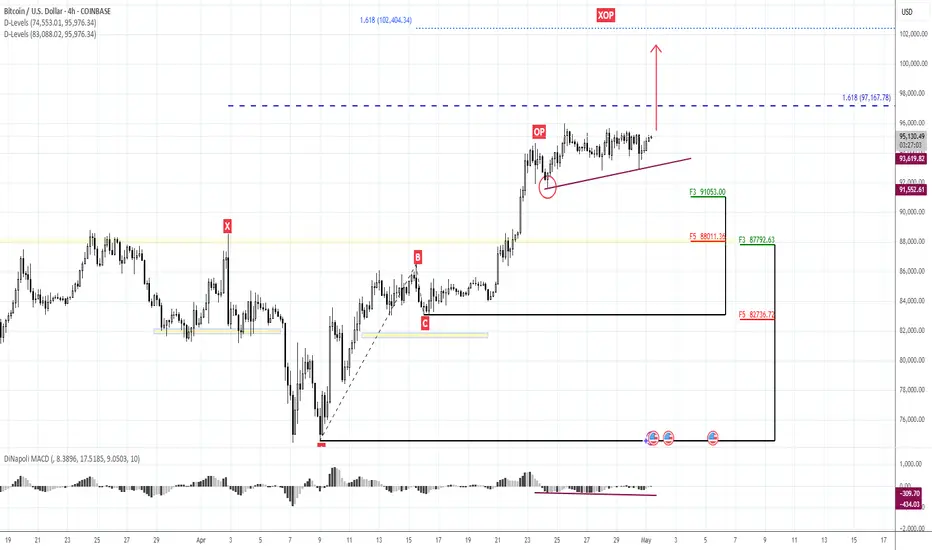
98+ actionMorning folks,
So, market mostly stands at the same place where we leave it last time :)
But now our monthly bullish pattern is officially confirmed, so mid term direction is up with 110K target at least and potential progress up to 127K.
Now we see a lot of minor bullish signs pointing on upside breakout attempt. Last time we talked about 3-Drive, but today it seems that it could go out of its limits. Not just to 97K but up to 103 K AB-CD upside target.
Until price is above 91.5K lows we do not consider any shorts. Following expected downside pullback is still on the table but not for this week probably. We return to it later as soon as upside action will be over.
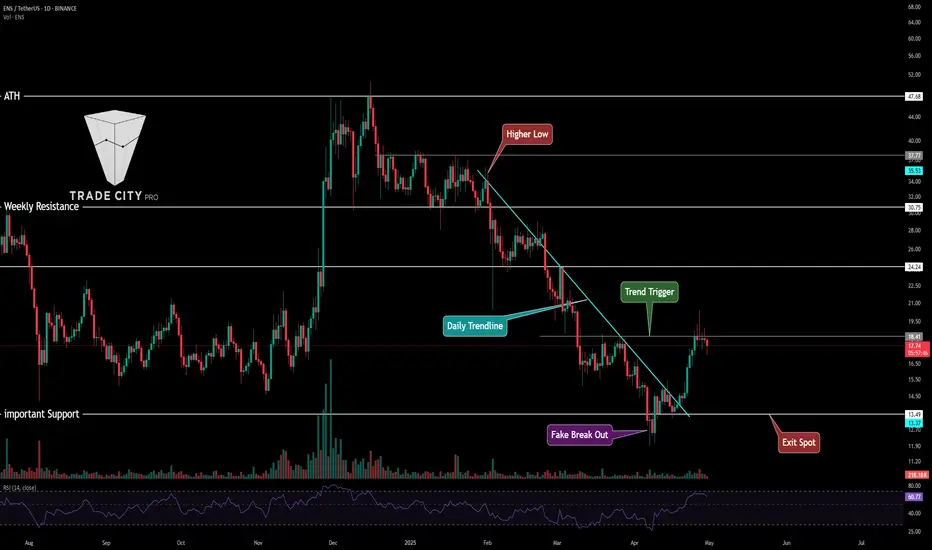
TradeCityPro | ENSUSDT Huge Breakout Coming? 👋 Welcome to TradeCityPro Channel!
Let’s dive in and analyze one of the DeFi coins, ENS, together. It’s been performing well recently and has some exciting news!
🌐 Bitcoin Overview
Before starting the analysis, I want to remind you that, as per your request, we’ve moved the Bitcoin analysis from the main section to a separate daily analysis. This allows us to discuss Bitcoin’s status in more detail and analyze its charts and dominance together.
This is the general analysis of Bitcoin dominance, which we promised to cover separately and analyze in longer timeframes.
📊 Weekly Timeframe
In the weekly timeframe, ENS is one of the bullish coins in the market with a promising outlook. It began its main upward movement before the start of 2025, back in late 2023.
After breaking the 9.99 level, we entered the main uptrend, and we can say that we broke the market cap ceiling, achieving a new ATH market cap.
We’re also riding a bullish curved line that acts as support. If this line is broken, it signals a weakening of the main uptrend. A drop below 15.90 would indicate a trend change in the MWC (Market Wide Correction).
Currently, our key weekly support has shifted. We were supported at 13.15, easily moving past this level. Our spot exit trigger is now 13.15, whereas last week it was 15.90.
📈 Daily Timeframe
In the daily timeframe, after a rejection from the ATH at 47.68, we entered a range box between 30.75 and 37.77. After some weak movements toward resistance, we saw a corrective wave.
Following a daily engulfing candle that covered the previous three candles, we experienced a sharp downward wave to 13.49. After that, seller pressure seemed to fade, and buyers stepped in. After a fake breakout at 13.49, we saw a move up to 18.41.
Additionally, the trendline formed during the recent declines in this chart was broken after the support at 13.49. However, since the trigger hasn’t been activated yet, we’re not acting on this trendline for now. But if 18.41 is broken, you could consider a risky spot buy.
✍️ Final Thoughts
Stay level-headed, trade with precision, and let’s capitalize on the market’s top opportunities!
This is our analysis, not financial advice always do your own research.
What do you think? Share your ideas below and pass this along to friends! ❤️
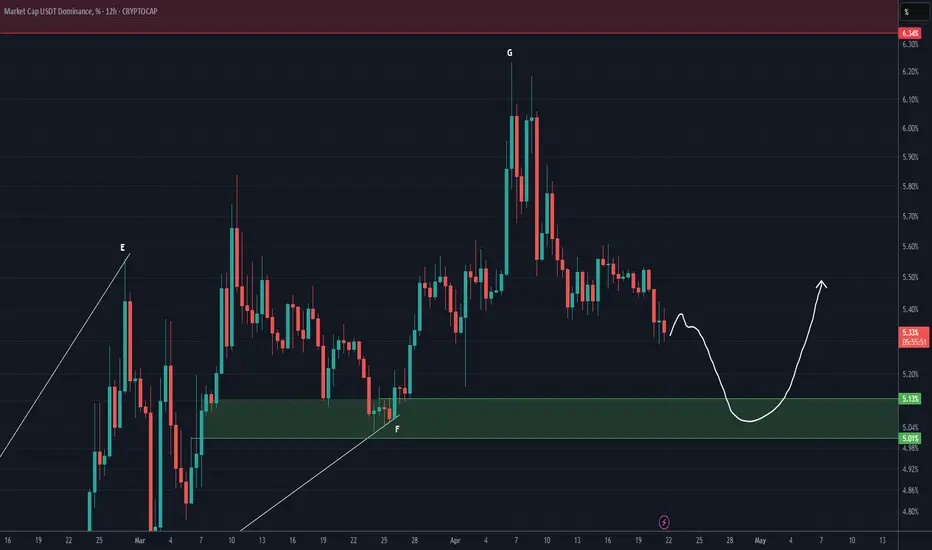
USDT Dominance Update (12H)It seems it can drop a bit more. Upon reaching the green box, it could reverse upwards and lead to a market correction in crypto.
In the green zone, caution is needed, and new purchases in the crypto market should be accompanied by precise capital management.
For risk management, please don't forget stop loss and capital management
Comment if you have any questions
Thank You