SOLANA's massive 1W MA200 rebound hints to enormous rally ahead.Solana (SOLUSD) made a very strong rebound on its 1W MA200 (orange trend-line) on the very first week of April. Now that the month is about to close, it has already completed three straight green 1W candles and is aiming for the critical 1W MA50 (blue trend-line) test.
If broken, we expect it to turn into a long-term Support again and target the Higher Highs of the Wedge at $350. After all, the 1W MA200 rebound also made contact on the 2-year Higher Lows trend-line of the Bull Cycle, so technically it is a massive Bottom cluster. The 1W RSI also broke above its MA last week, confirmed the buying pressure.
Given that the recent 3-month correction was -67.23%, identical to the last correction (May 2021) of the previous Cycle, we expect one final rally to the 2.0 Fibonacci extension at $900, if the Higher Highs trend-line breaks.
-------------------------------------------------------------------------------
** Please LIKE 👍, FOLLOW ✅, SHARE 🙌 and COMMENT ✍ if you enjoy this idea! Also share your ideas and charts in the comments section below! This is best way to keep it relevant, support us, keep the content here free and allow the idea to reach as many people as possible. **
-------------------------------------------------------------------------------
💸💸💸💸💸💸
👇 👇 👇 👇 👇 👇
Cryptocurrency

BITCOIN This is where the real BULL started in 2017.We've mentioned on numerous occasions how Bitcoin's (BTCUSD) current Cycle resembles that of 2014 - 2017 and this evidence is self-explanatory on the chart. What we want to bring forward today, and the timing couldn't be better, is that symmetrically speaking, it was the exact same time of the year (April 2017) when the past Cycle started printing predominantly green candles that lasted until the very end of 2017 (December) and the Cycle Top.
The 3W RSI sequences are identical among the two fractals with a Pivot trend-line dominating both Cycles, first as a Resistance (red arrows) and then turned into Support (green arrows). Before the end-of-year Parabolic Rally, the Bull Cycle was classified into 3 pull-back/ consolidation Phases (blue Rectangles) and, no surprise, the mini rallies started around the same times.
Can this indicate that we are about to see a strong rally of predominantly green candles towards the end of the year to form the new Cycle High? What do you think?
Feel free to let us know in the comments section below!
-------------------------------------------------------------------------------
** Please LIKE 👍, FOLLOW ✅, SHARE 🙌 and COMMENT ✍ if you enjoy this idea! Also share your ideas and charts in the comments section below! This is best way to keep it relevant, support us, keep the content here free and allow the idea to reach as many people as possible. **
-------------------------------------------------------------------------------
💸💸💸💸💸💸
👇 👇 👇 👇 👇 👇
XRP/USDT 1H Chart: Ready for a Moonshot? Hey XRP fam! Let’s break down this sizzling 1-hour chart. XRPUSDT is cooking up something big, and we’re on the edge of our seats!
We’re seeing a series of triangles forming, with XRP stuck in consolidation phases — each one tighter than the last. The price is currently testing the upper trendline of the latest triangle, sitting around $2.247 after bouncing off a solid support at $2.050. This setup screams potential breakout! I put on the chart a bold “Highway to Moon” arrow pointing upward, hinting at a possible surge toward $2.600 or beyond if XRP breaks free.
But let’s not get too starry-eyed — failure to break out could see XRP retreat to the support zone at $2.050, or even lower to $2.000 if things get shaky.
Key Levels to Watch:
Resistance: $2.299
Support: $2.2184
Breakout Target: $2.360+
Breakdown Risk: $2.000
Are we heading to the moon, or is this a fakeout? Let’s hear your thoughts below!

Phemex Analysis #77: Pro Tips to Trade SIGN! SIGN token ( PHEMEX:SIGNUSDT.P ) has experienced a remarkable surge this week, gaining 60% in a short period as seen on the 1-hour chart. This surge has attracted significant investor attention, driven by SIGN's unique approach to cross-chain verification. Cross-chain verification addresses a critical challenge in the blockchain space: the secure and efficient transfer of data and assets between different blockchain networks. SIGN aims to streamline this process, enhancing interoperability and reducing the risks associated with cross-chain transactions. This innovative solution has positioned SIGN as a potentially valuable asset in the expanding multi-chain ecosystem, contributing to the recent price appreciation.
Possible Scenarios (1-hour Chart)
Given the recent surge and the volatility inherent in the cryptocurrency market, here are potential scenarios for SIGN token, focusing on the 15-minute timeframe:
1. Continuation of the Uptrend
If SIGN maintains strong buying pressure and volume, the uptrend observed could continue. This scenario suggests that the market is highly optimistic about SIGN's cross-chain verification technology.
Pro Tips:
Identify key resistance level, such as $0.10. If the price breaks out of this level, it would suggest the continuation of this uptrend.
Consider entering long positions on the breakout, with stop-loss orders below a recent low like $0.092.
Short-term profit targets include $0.109 & $0.125.
2. Short-Term Consolidation
Following the rapid price increase, SIGN may enter a period of consolidation on the 1-hour chart. This consolidation could be characterized by sideways price action within a defined range.
Pro Tips:
$0.105 might act as the upper boundary, and $0.09 might act as the lower boundary of the consolidation range.
Be patient and watch for a breakout from the consolidation range, which could signal the resumption of the uptrend or a trend reversal.
Use volume and breakout confirmation techniques to validate any breakout trades.
3. Rapid Price Correction
Given the sharp price increase, SIGN is vulnerable to a rapid price correction, especially if profit-taking occurs or negative news emerges.
Pro Tips:
Monitor for signs of weakening momentum, such as lower highs with lower lows, and RSI divergence.
Be prepared to exit long positions quickly if a correction begins.
Consider shorting opportunities if the price breaks below key support levels (such as $0.09) with strong volume, but manage risk carefully.
Conclusion
SIGN token's recent 60% surge, driven by its innovative cross-chain verification technology, has created short-term trading opportunities. Analyzing the 1-hour chart reveals potential scenarios, including a continued uptrend, short-term consolidation, and rapid price correction. Traders should employ appropriate risk management strategies, closely monitor price action and volume, and stay informed about any developments related to SIGN token and the broader cross-chain ecosystem.
Pro Tips:
Trade Smarter, Not Harder with Phemex. Benefit from cutting-edge features like multiple watchlists, basket orders, and real-time strategy adjustments. Our unique scaled order system and iceberg order functionality give you a competitive edge.
Disclaimer: This is NOT financial or investment advice. Please conduct your own research (DYOR). Phemex is not responsible, directly or indirectly, for any damage or loss incurred or claimed to be caused by or in association with the use of or reliance on any content, goods, or services mentioned in this article.

Daily Price Action: BITCOIN BTCUSD Tuesday 4/29/2025In this video, we will be looking into the potential price action BTCUSD.

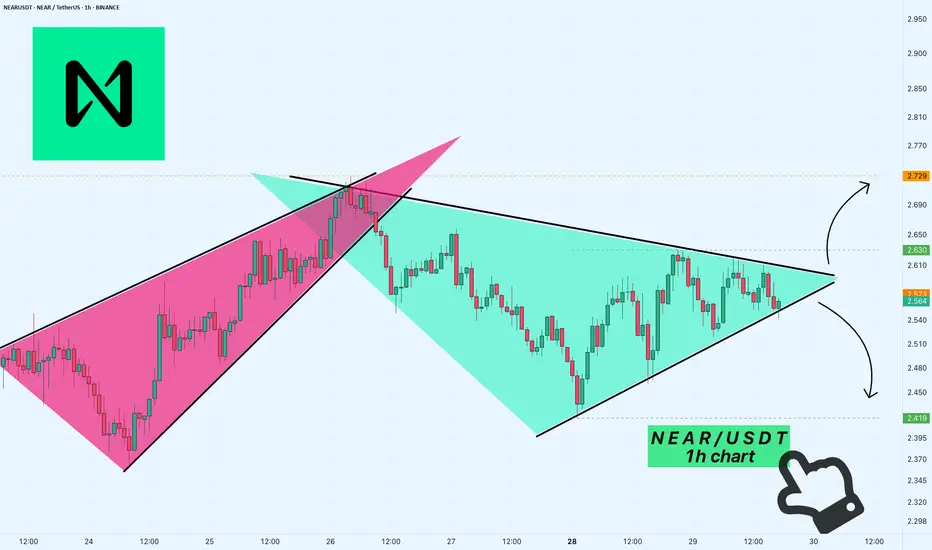
NEAR/USDT 1H Chart: Breakout or Breakdown?Hey crypto traders! Let’s zoom into this 1-hour chart, because NEAR is serving up some serious action!
We’ve got a massive triangle forming, with the price squeezing tighter and tighter between converging trendlines. NEAR is currently dancing around $2.466, teasing a breakout after bouncing between resistance at $2.729 and support at $2.419. This pattern is a pressure cooker, and a big move is coming — will it soar to new highs or crash back down?
A bullish breakout above the upper trendline could propel NEAR past $2.610, potentially targeting $2.729 or higher! But if it fails to hold support at $2.540, we might see a dip toward $2.419 or even lower.
Key Levels to Watch:
Resistance: $2.610
Support: $2.540
Breakout Target: $2.729+
Breakdown Risk : $2.419
What’s your take — bullish surge or bearish pullback? Let’s hear your predictions below!
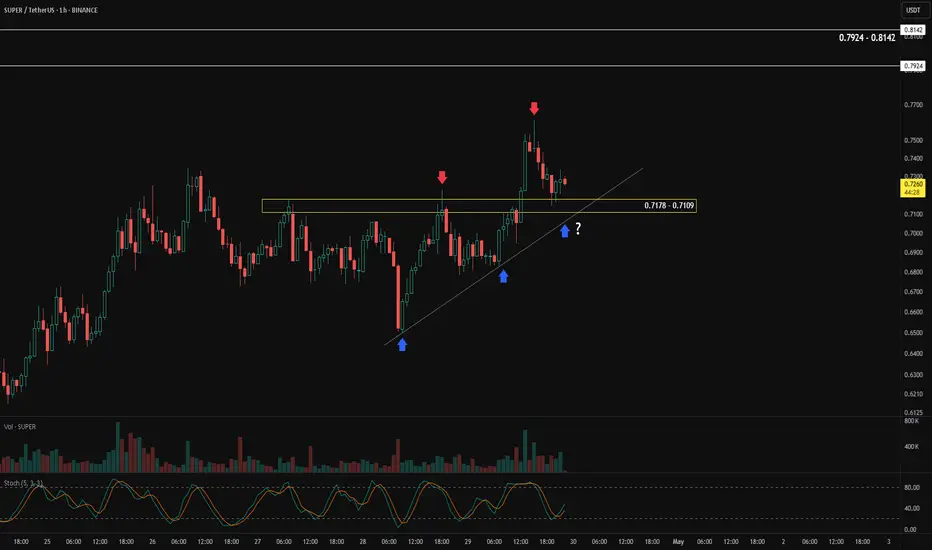
Pullback's Almost Over — Get In Before It RunsThe best time to enter in a bull market is during a pullback — when price temporarily retraces before continuing its upward trend.
In the case of BINANCE:SUPERUSDT , price is currently pulling back into a demand zone between 0.7178 – 0.7109. The overall structure remains bullish, with the blue arrows showing a series of higher lows and the red arrows indicating higher highs.
We expect the price to bounce from this demand zone and potentially break the previous high, continuing the bullish trend.
To confirm the pullback is ending and a reversal is underway, we’ll watch for candlestick patterns. Here are two possible bullish confirmation scenarios:
Price breaks and closes above the high of the last red candle — a bullish engulfing setup.
Price dips deeper into the demand zone, then forms a bullish pattern such as:
Bullish Engulfing
Bullish Harami
Other reversal signals, like a close above the high of the previous two candles.
These are the scenarios I’m watching for on $SUPERUSDT.
Let me know your thoughts!
Bullish Pennant in ARDR: A Pause Before Another RallyAfter an aggressive surge marked by a big green candle, BINANCE:ARDRUSDT is now moving sideways. This sideways action represents a "voting phase" between buyers and sellers — a battle to decide who will take control next.
Looking at the current price structure, this consolidation is setting up a potential continuation move toward the next target zone at 0.15199 – 0.15900.
Technically, the sideways movement is forming a bullish pennant pattern — a classic sign where price briefly pauses after a strong rally, gathering momentum before continuing its upward trend.
One thing to watch: after breaking the previous high (marked by the red arrow), price should not fall back into the pennant structure. A re-entry would weaken the bullish setup.
As long as price holds above the key support at 0.12273, the bullish scenario remains intact.
What's your view on this setup?

BITCOIN Why is this rally surprising you?Bitcoin (BTCUSD) has completed 3 straight green weeks, with an impressive last 1W candle closing and started the new one right where it left. This rise shouldn't be surprising to most as it has fulfilled all the conditions that initiated all major rallies since the November 2022 Bear market bottom.
The first week of April rebounded strongly on the 1W MA50 (blue trend-line), which as mentioned numerous times on our channel, has been this Bull Cycle's main Support and kickstarted the Q4 2023 and Q4 2024 rallies.
At the same time, the 1W RSI broke last week above its MA, which has been the final confirmation of those Bullish Legs. With the 1W Bollinger Bands (BB) still ranged, the top trend-line is expected to rise aggressively as BTC's uptrend accelerates, something that resembles October 2023 and October 2024.
Throughout this Bull Cycle, those rallies have lasted around the same time, the longest being 14 weeks. As a result, the latest the current Bullish Leg tops should be on the week of July 14 2025 and a +92% rise as February - March 2024 should deliver a test of the Higher Highs trend-line around $140000.
Do you think that's the most probable scenario? Feel free to let us know in the comments section below!
-------------------------------------------------------------------------------
** Please LIKE 👍, FOLLOW ✅, SHARE 🙌 and COMMENT ✍ if you enjoy this idea! Also share your ideas and charts in the comments section below! This is best way to keep it relevant, support us, keep the content here free and allow the idea to reach as many people as possible. **
-------------------------------------------------------------------------------
💸💸💸💸💸💸
👇 👇 👇 👇 👇 👇

BTCUSDTHello Traders! 👋
What are your thoughts on BITCOIN?
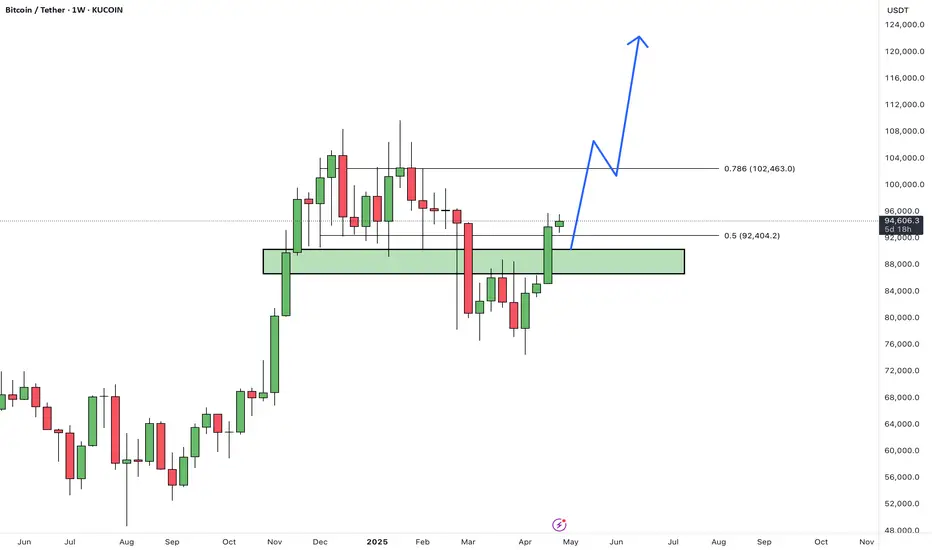
Bitcoin has reclaimed the $90K– GETTEX:92K zone after a sharp 32% correction from its all-time high, closing the week strongly above this critical area.
As long as price holds above $90,000, the primary bias remains bullish. The $90K– GETTEX:92K area now acts as a key support zone, ideal for pullback buying opportunities.
A breakout above $101,000 could trigger a strong acceleration toward the next major targets at $115K–$125K.
A weekly close below the green support zone would invalidate the bullish scenario and suggest caution.
What’s your outlook? Will Bitcoin maintain momentum and break $101K? Share your thoughts below!
Don’t forget to like and share your thoughts in the comments! ❤️
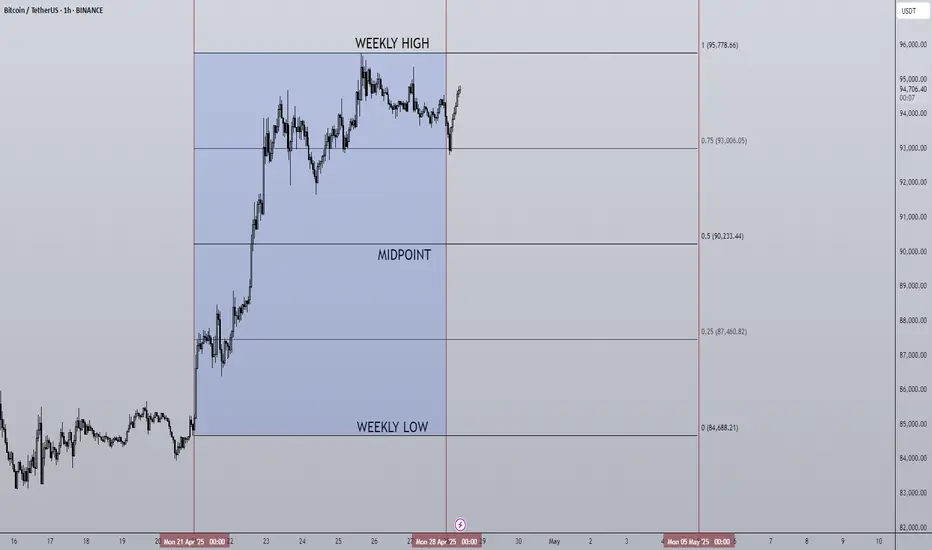
28/04/25 Weekly OutlookLast weeks high: $95,778.66
Last weeks low: $84,688.21
Midpoint: $90,233.44
Last week Bitcoin ETFs recorded their second highest net inflows ever, $3.06B between April 21st-25th. The result of this buyside volume is evident on the chart as BTC breaks up into the mid $90k's, and in doing so is now back at the level in which BTC fell from originally to hit $74,500. As a result it is fair to say this area will be a big resistance level, but where is new support after this rally?
The aggressive nature of last weeks move up has left a number of areas of imbalance that the market does tend to revisit. Just below midpoint we have the $89,000-$90,000 area just below a key S/R level at $91,000. Dipping below this area into the FWB:88K 's briefly to sweep the demand and reclaiming $91,000 would be ideal for the bulls and very healthy for the next rally.
A less appealing area of imbalance for the bulls would be towards weekly low of $85,300-$86,300, that would be very painful for anyone longing a retest of the $91,000 area and from a HTF perspective would be a lower high and a SFP of the range midpoint, both bearish signals. The 4H 200 EMA is currently around that area at $87,000 too which would mean losing the level after just climbing back above it.
This week I'm looking at that first imbalance area to be a level of support for the next leg up, that's the ideal bullish scenario in my mind. A move below midpoint with acceptance is a red flag on this move and would start to look like a lower high bearish continuation.
Good luck this week!
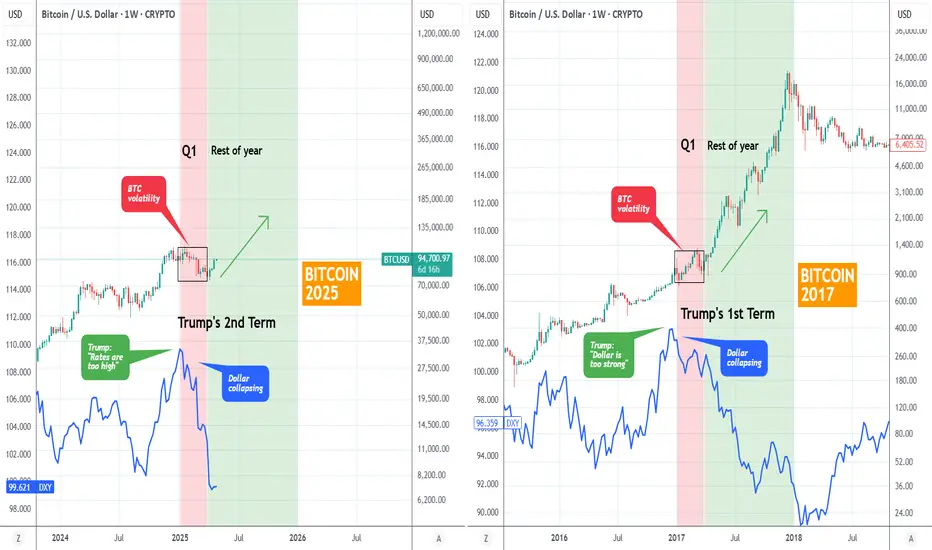
BITCOIN's Trump effect: The 2025 PARABOLIC FINALE is coming!Bitcoin (BTCUSD) has completed 3 straight green 1W candles, making an impressive start into Q2 2025. But is it a coincidence or systemic behavior of technical trends?
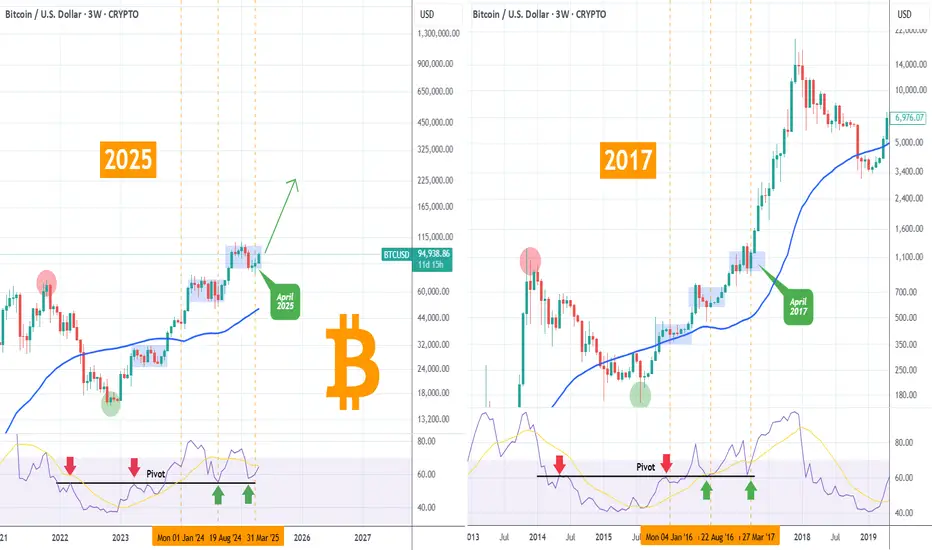
It certainly is no coincidence the structure that the market has with Trump under President. Q1 has been undoubtedly disastrous due to the Trade War fueled by back and forth tariffs. But this is a pattern we've seen before and more specifically in Trump's 1st Term during Q1 2017.
As you can see, BTC was again under heavy volatility during Trump's 1st Term Q1, even though the correction wasn't as hard initially. What's more interesting however, is that in both Terms, the U.S. Dollar Index (DXY, blue trend-line) topped in Q1 and started collapsing. In 2017 that was the catalyst that fueled BTC's insane Parabolic Rally for the rest of the year.
Can the current Dollar collapse kick-start a rally for the rest of 2025? If the Trade War stabilizes, it certainly looks so. It is no coincidence that in 2017 Trump came out storming that the Dollar was too high just like he states now that the Interest Rates are too high, pressuring the Fed to cut.
So what do you think? Is the rest of 2025 destined to be as strong as 2017? Feel free to let us know in the comments section below!
-------------------------------------------------------------------------------
** Please LIKE 👍, FOLLOW ✅, SHARE 🙌 and COMMENT ✍ if you enjoy this idea! Also share your ideas and charts in the comments section below! This is best way to keep it relevant, support us, keep the content here free and allow the idea to reach as many people as possible. **
-------------------------------------------------------------------------------
💸💸💸💸💸💸
👇 👇 👇 👇 👇 👇
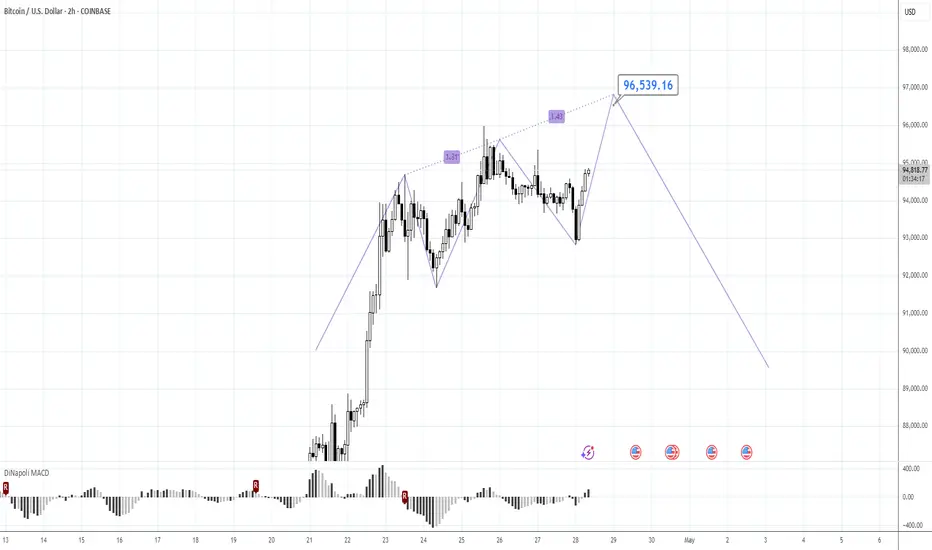
97K and 88KMorning folks,
So picture almost has not changed since our last talk. Now we get great setup on monthly chart with upside potential starting from 110K and up to 127K. And our task now is to join this coming action.
It would be great to get a pullback, but the shape of intraday market has changed slightly and it seems that BTC is forming 3-Drive "Sell" with target around 97K. Hopefully this pattern will trigger the pullback that we need.
If it happens, then the next area that we will be watching is around 88-90K, which is nice support area .
That's being said, our strategy for now is action to ~97-97.3K first and pullback to 88-90K second.
I mark this update as "bullish" due to our first point, but you've got the idea.
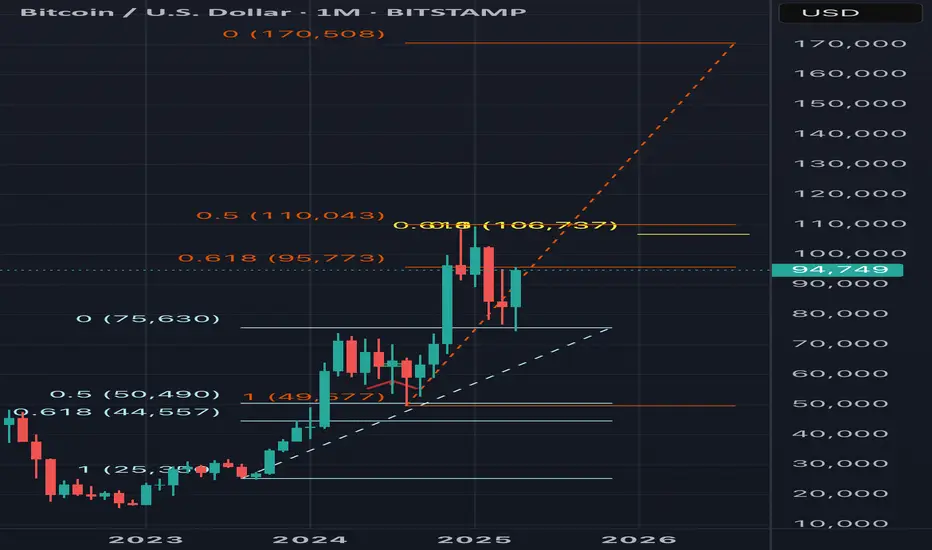
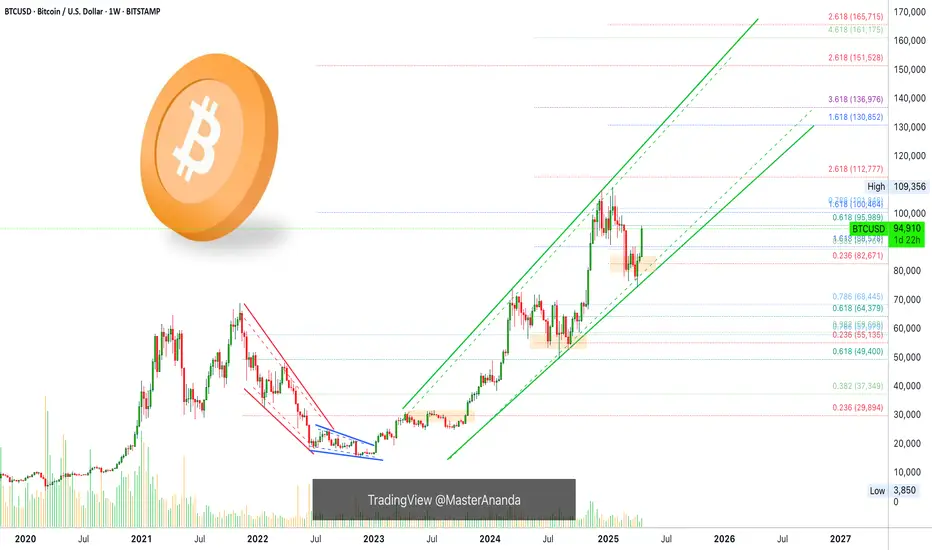
BTC ANALYSE The next Fibonacci extension level for BTC on the Monthly timeframe is between
This target could be reached within three Monthly candles, representing an advance of over 27%.
BAT ANALYSIS🚀#BAT Analysis :
🔮As we can see in the chart of #BAT that there is a formation of "Falling Wedge Pattern". In a daily timeframe #BAT broke out the pattern. Expecting a bullish move in few days if #BAT retest the levels
⚡️What to do ?
👀Keep an eye on #BAT price action. We can trade according to the chart and make some profits⚡️⚡️
#BAT #Cryptocurrency #TechnicalAnalysis #DYOR

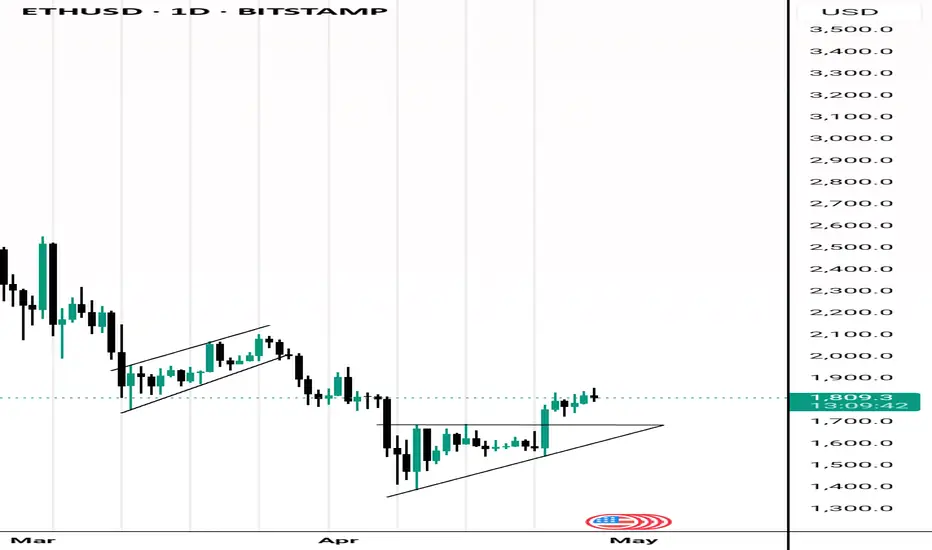
Ethereum Trade IdeaEthereum has broken out of it's ascending triangle pattern.
A possible retest of the triangle resistance levels which might turn to support.
If the level holds up that will be a begining of a new uptrend for Ethereum.
Internet Computer (ICP)ICP project was announced with great fanfare and promised great features. However, ICP's price was in a long downtrend until recently when price broke the downtrend line and made a higher high and a higher low. It's too soon to surmise the major trend reversal has happened since at least another higher high and higher low is needed. Let's see what happens.

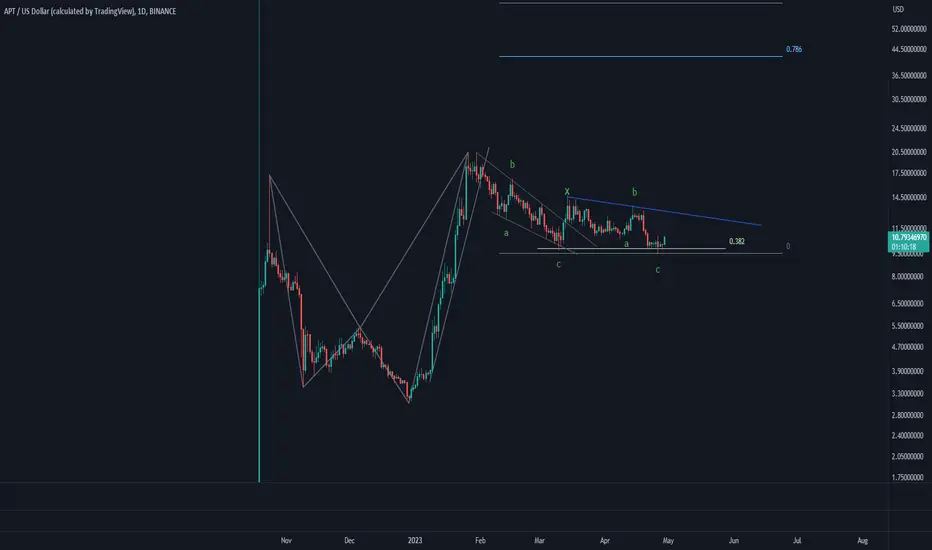
Aptos (APT)Aptos is a new project in crypto market with a lot of attention as well as features to offer. There is not much price candles to tell the big picture pattern; but as can be seen after APT made a harmonic pattern, it went into a corrective phase which seems unfolded in a complex two a-b-c pattern. Please note that this corrective wave might take longer to finish and get more complex. Anyway, we need to see the minor downtrend line break as the first signal for upward continuation. Let's see what happens.
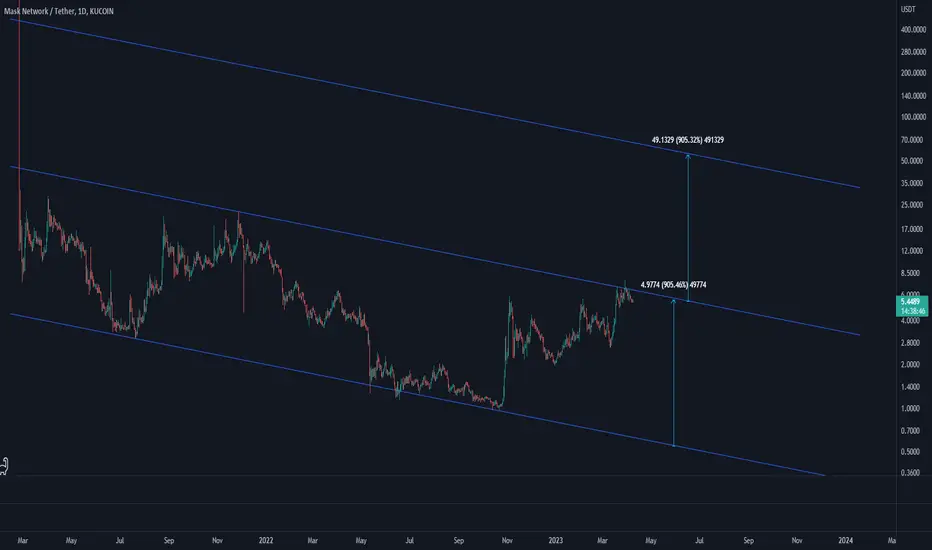
Mask Network (MASK)Mask is moving in a downtrend channel. If price breaks the upper band, theoretically, it can ascend to a level equal to the width of the channel. Although, behavior of price movement may change after the channel breaks; so keep that in mind.
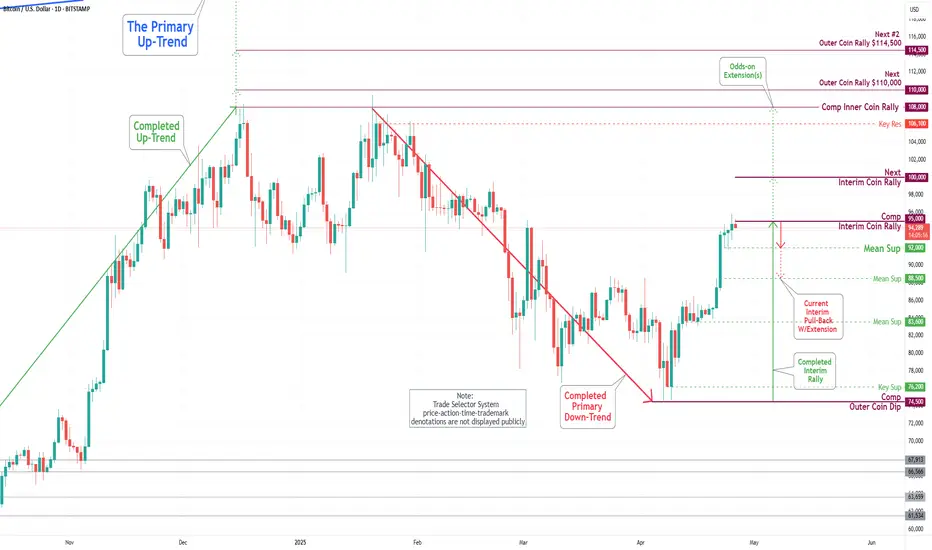
Bitcoin(BTC/USD) Daily Chart Analysis For Week of April 25, 2025Technical Analysis and Outlook:
Bitcoin experienced a significant rally in this week's trading session, breaking through all identified Mean Resistance levels: 86400, 90600, and 94500. This breakout led to the completion of the Interim Coin Rally at 88400. As a result, the newest identified Interim Coin Rally at 95000 has also been completed, indicating a possible pullback to the Mean Support at 92000 and a further decline potential toward an additional Mean Support target at 88500. However, it's important to recognize the chance of upward momentum emerging from a retest of the completed Interim Coin Rally at 95000, which could advance toward the next Interim Coin Rally at 100000.
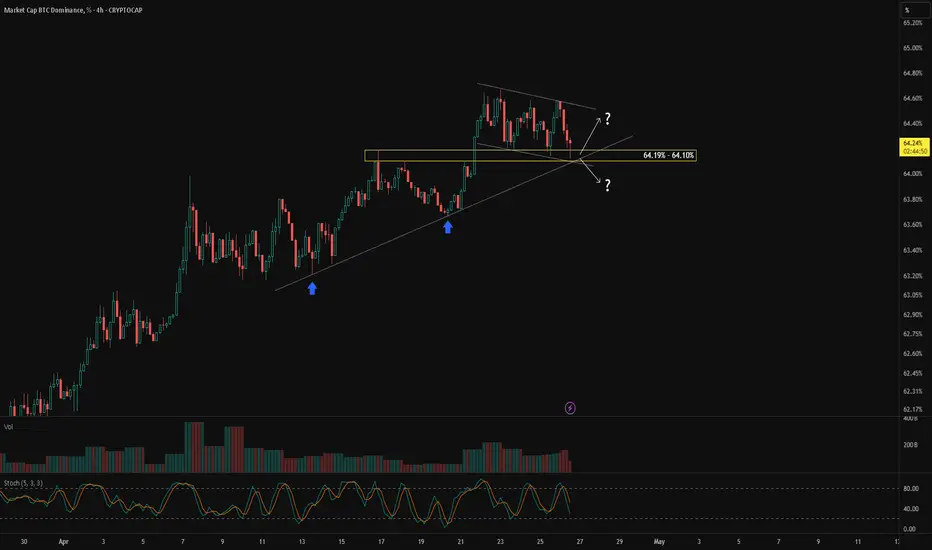
Crucial Level to Watch on BTC.DWe can see that CRYPTOCAP:BTC.D is still in a bullish trend and is currently testing a crucial level, which will determine whether it continues to make a higher high or starts weakening towards its previous low.
The influence of CRYPTOCAP:BTC.D on the crypto market is simple: if CRYPTOCAP:BTC.D moves higher, it means more money is flowing into Bitcoin. For example, if CRYPTOCAP:BTC.D is at 64%, it means 64% of the total crypto market capitalization is in Bitcoin, and the remaining 36% is spread across altcoins like CRYPTOCAP:ETH , CRYPTOCAP:SOL , CRYPTOCAP:DOGE , CRYPTOCAP:PEPE , etc.
Conversely, if CRYPTOCAP:BTC.D moves lower, it means more money is shifting into altcoins.
Strategy when CRYPTOCAP:BTC.D is rising:
You can allocate more into Bitcoin rather than altcoins. Alternatively, you can find altcoins that are outperforming Bitcoin.
How to find altcoins that outperform Bitcoin?
Look for altcoin/BTC pairs, for example: BINANCE:WIFBTC , BINANCE:NEARBTC , or $BINANCE:TAOBTC.
If the price of BINANCE:WIFBTC is going up, it means SEED_WANDERIN_JIMZIP900:WIF is gaining more value compared to $BTC. If it's going down, it means Bitcoin is performing better than $WIF.
Back to CRYPTOCAP:BTC.D :
Currently, CRYPTOCAP:BTC.D is testing the 64.19% – 64.10% zone.
This area will determine whether CRYPTOCAP:BTC.D continues upward or starts to weaken.
To get early confirmation, you can zoom into the 1-hour chart and look for signs of bullish divergence.
If bullish divergence appears on the 1-hour chart, it often leads to a bounce on the 4-hour chart and a potential continuation of the bullish trend, possibly breaking the previous high.
However, if there's no bullish divergence confirmation, or if there's a strong rejection at the support level, CRYPTOCAP:BTC.D is likely to weaken and move towards its previous low.
Bitcoin & The Cryptocurrency MarketWhat is the energy like? Are the energies rising or falling?
That's the question that you should ask yourself now in relation to Bitcoin and the Cryptocurrency market.
Falling energies lead to falling prices. What was happening just two months ago? The energy was low and the market dropped but, can you feel it? It has been heating up. Something is brewing behind the scenes and excitement is building up... It is coming, like a storm, a quiet storm.
The energies are rising and conditions are so much difference to just two months ago. Three months ago. Conditions are different now, the action on the chart will also be different now because the correction is over and once the correction is over we will always experience growth, no doubt for sure.
Mars will be in full force in May 2025 and Mars is the action planet. When Mars was retrograde the action died down, the action energy felt down and the market moved down. Mars goes full 1000% forward motion new territory high energies; fiery, impulse and barriers and blocks removed as Cryptocurrency grow.
That's the energy. It cannot be avoided it cannot be stoped, when it was going backward all the bullish action disappeared from the market, December 2024. As it goes back in full force the action is heating up and the proof will be seen clearly in the results. Bitcoin is already ultra bullish above $95,000. 80K is no more. No longer possible soon to be a dream long gone.
"Imagine buying Bitcoin when it was trading at 78,800, 80,000 or 90,000," that's exactly what people will be thinking in just a few short weeks when Bitcoin trades at $120,000 and then $150,000 with bullish momentum only growing and prices going higher.
What about the Altcoins?
You cannot have a bear market followed by a bear market supported by a bear market within a bear market. That's not how the market works. The market alternates between bearish and bullish periods between periods of corrections and growth.
Such a long correction we went through that we forget that Cryptocurrency is worth more than Gold. But we will remember soon because there is something cooking behind the scenes and the dish is almost ready to be served.
Your dish will be a desert, what you really deserve; huge profits.
The market will reward you for being a buyer when everybody was selling.
The market...
Thank you for reading.
Namaste.
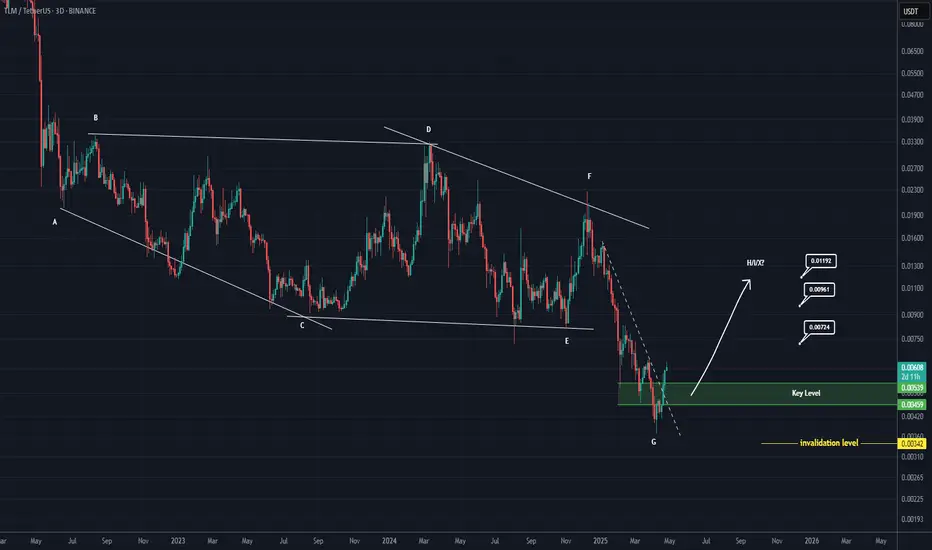
TLM Looks Bullish (3D)It seems that a diametric has completed on the chart, or Wave G of a symmetrical pattern has ended, or the price is attempting to form a bullish X-wave.
There is a key zone on the chart that the price has reclaimed, marked in green.
As long as this zone holds, the price can move toward the targets, which are highlighted on the chart.
A daily candle closing below the invalidation level would invalidate this analysis.
For risk management, please don't forget stop loss and capital management
When we reach the first target, save some profit and then change the stop to entry
Comment if you have any questions
Thank You