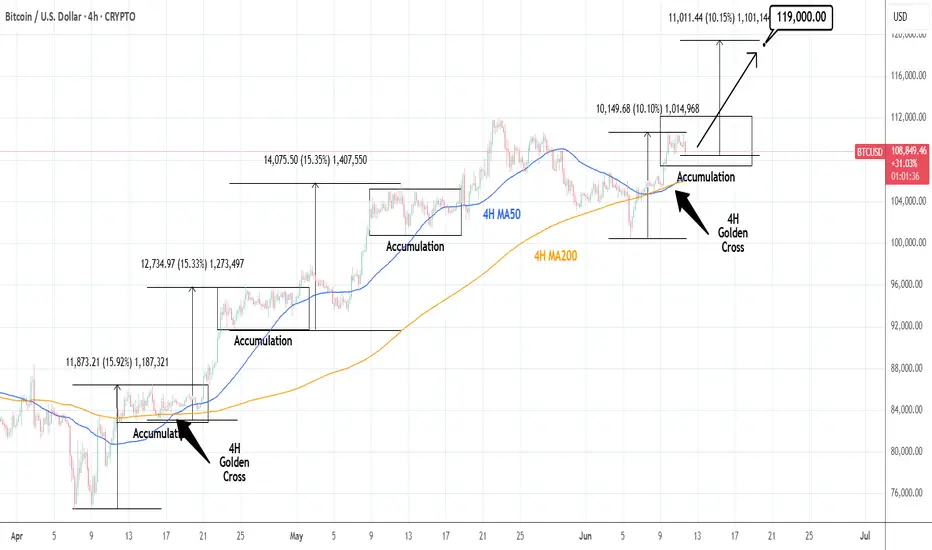
BTCUSD: 4H Golden Cross kickstarting $119,000 rally.Bitcoin remains bullish on its 1D technical outlook (RSI = 58.982, MACD = 1643.700, ADX = 1643.700) despite today's high volatility. This volatility displays similar attributes to the Accumulation Phases that were formed since the April 7th bottom. If it follows the symmetry of the first two bullish waves around the first Accumulation Phase, expect a +10% rise from the Phase's bottom. Assuming today is the bottom, the next target of this pattern is 119,000.
## If you like our free content follow our profile to get more daily ideas. ##
## Comments and likes are greatly appreciated. ##
Cryptocurrency
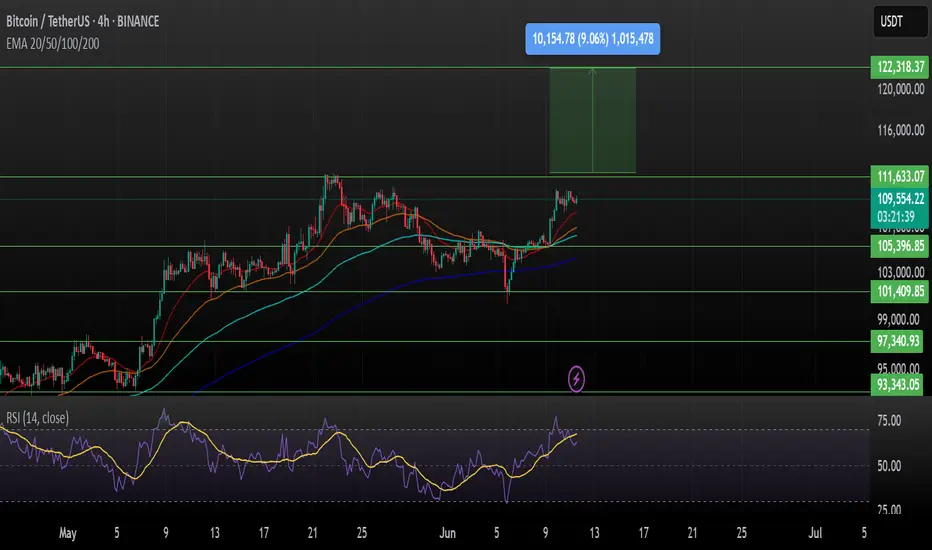
BTCUSDT – Bullish Continuation Setup (4H Chart)Bitcoin shows a strong bullish structure on the 4H timeframe after breaking and holding above key EMAs (20/50/100/200). Price is consolidating just above the breakout zone, suggesting potential continuation.
Support Levels:
$105,396
$101,409
$97,340
$93,343
Resistance Levels:
Immediate: $111,633
Major Target: $122,318 (+9.06% potential upside)
Indicators:
RSI: Holding at ~63.7, still below overbought — suggests room for momentum.
EMA Confluence: All major EMAs are aligned below price, acting as dynamic support.
If BTC holds above $109K, a move toward $122K looks likely. A clean breakout above $111.6K could ignite the next leg up.
Bullish bias intact
Target: $122,318
Risk Management: Watch for invalidation if price breaks below $105K.
This is not financial advice, please do your research before investing, as we are not responsible for any of your losses or profits.
Please like, share, and comment on this idea if you liked it.
#BTCUSDT #Bitcoin #Crypto #TradingView
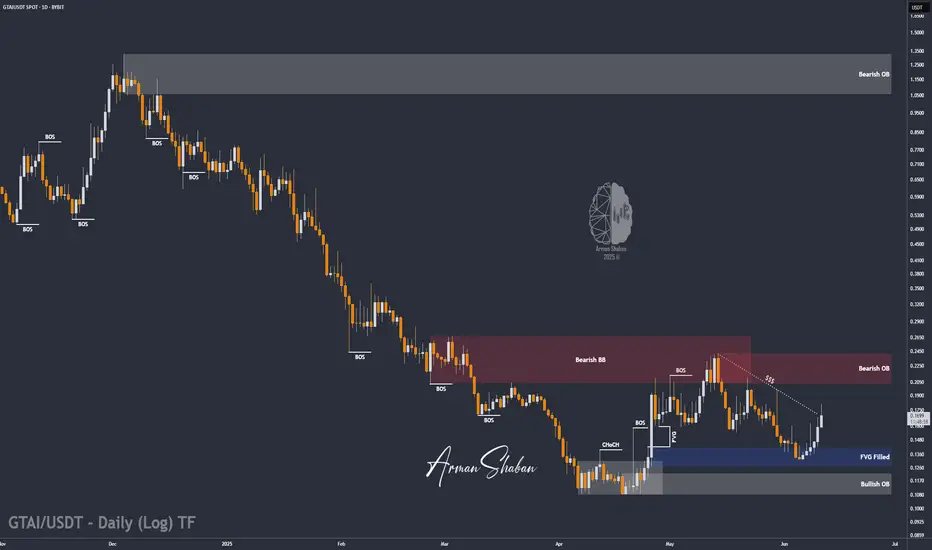
GT Protocol ($GTAI) | Breakout Loading? +500% Potential! (READ)By analyzing the #GTProtocol chart on the daily (logarithmic) timeframe, we can see that the price was forming a solid base between $0.12 and $0.15. Currently trading around $0.17, the chart structure remains bullish and primed for a potential breakout. Momentum is gradually building, and I expect the price to soon test the $0.185 level, followed by short-term targets at $0.20, $0.24, and $0.266.
In the long run, my bullish bias remains firm with targets at $0.37, $0.45, and a psychological milestone of $1.00, representing a potential upside of over 500% from current levels!
Fundamental Drivers Supporting the Move
• Tokenomics: Recent unlocks have distributed supply more evenly, easing early-seller pressure and improving liquidity dynamics.
• Utility & Adoption: As a Web3 AI-execution layer, GT Protocol is expanding its real-world use cases with new partnerships and integrations.
• Narrative Strength: Positioned as a leading AI narrative for 2024, $GTAI is gaining traction amid rising AI sector demand.
Sentiment & On-chain Signals
• Community Hype: Activity on X (Twitter) and Telegram is surging, with bullish sentiment dominating conversations since the recent breakout attempt.
• Social Volume: A spike in daily mentions suggests increasing retail attention—often a precursor to strong moves.
• Whale Accumulation: Smart money has been seen accumulating below current levels—an early sign of confidence in the next leg up.
With both the technical setup and fundamentals aligning, $GTAI looks ready for an explosive run. Keep it on your radar!
Please support me with your likes and comments to motivate me to share more analysis with you and share your opinion about the possible trend of this chart with me !
Best Regards , Arman Shaban
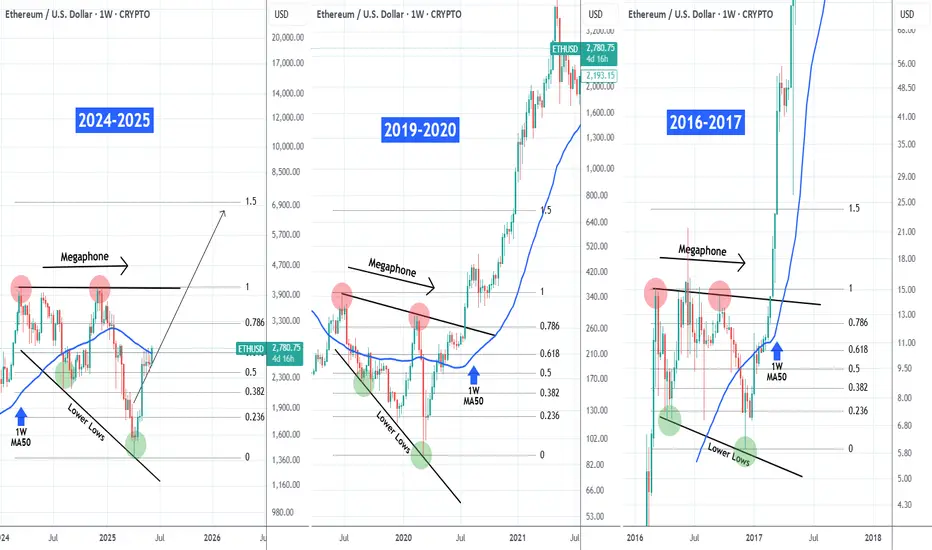
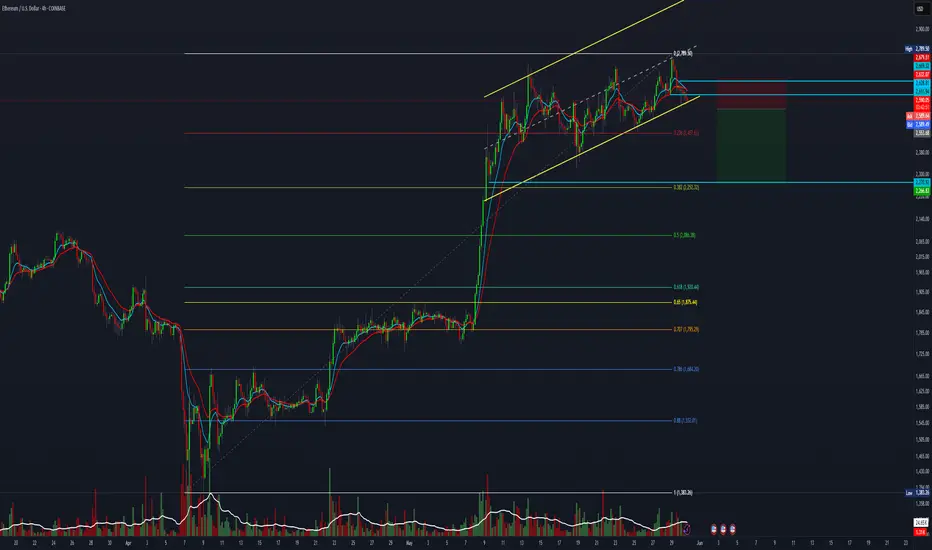
ETHEREUM This Megaphone emerged on all previous Cycles.Ethereum (ETHUSD) is showing incredible strength at the moment as it broke above its 1W MA50 (blue trend-line) and its goal now will be to close the week above it.
This resembles May 2020 and January 2017 when again the price was struggling to break above its 1W MA50, all within a similar Megaphone pattern, and eventually succeeding. The similarities among those 3 patterns so far are striking despite being formed on different Cycles.
As you can see, we are currently on the 0.618 Fibonacci level of the Megaphone, which is exactly where ETH was during the other 2 Cycles when it tested the 1W MA50 and broke out. Once the 1W MA50 turned into Support, the market never looked back and initiated the parabolic rallies of 2020/ 2021 and 2017.
Based on that, we expect ETH to test the 1.5 Fibonacci extension, around $7000.
-------------------------------------------------------------------------------
** Please LIKE 👍, FOLLOW ✅, SHARE 🙌 and COMMENT ✍ if you enjoy this idea! Also share your ideas and charts in the comments section below! This is best way to keep it relevant, support us, keep the content here free and allow the idea to reach as many people as possible. **
-------------------------------------------------------------------------------
💸💸💸💸💸💸
👇 👇 👇 👇 👇 👇
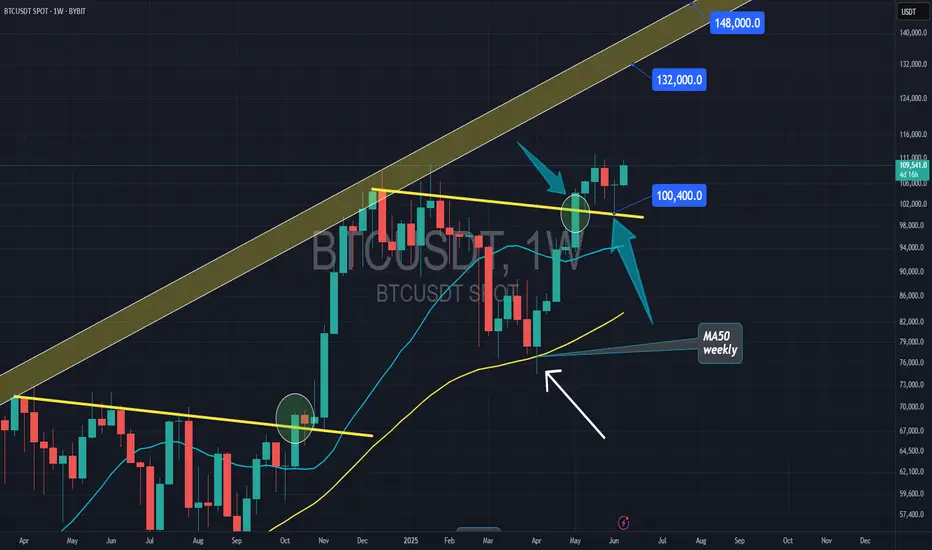
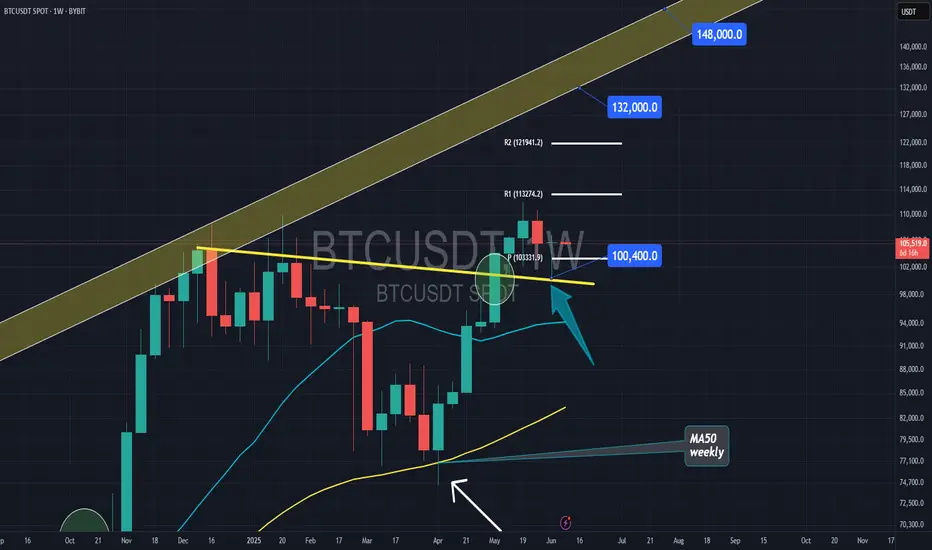
Bitcoin to $130,000Bitcoin broke out of the important yellow trendline and back tested that ( @$100k ) now its rising again. the main target now is $130,000 trendline
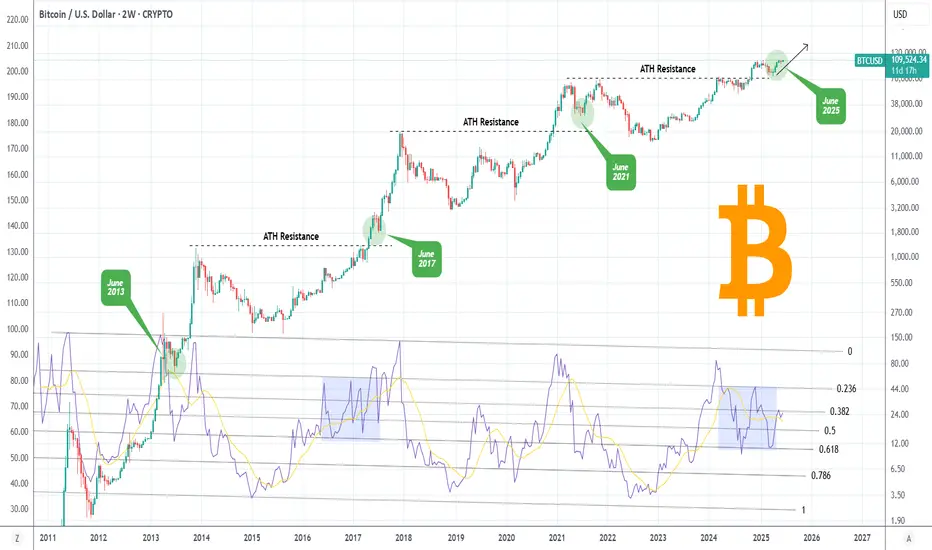
BITCOIN Is 'Bullish June Seasonality' about to kick-in?Bitcoin (BTCUSD) has started June on a very promising note, recovering most of last week's losses and is potentially headed for a new All Time High (ATH). This however, should be no surprise as BTC has exhibited amazing strength during the month of June and onwards since 2013.
As this chart shows, the market has historically rallied on June, in fact it is the month that kick-started Bitcoin's final rallies towards the Top on its last three Cycles.
Based on the 2W RSI, which is ranging within the 0.236 - 0.618 Fibonacci levels, we can argue that the price action is closer to June 2017 than other Cycles. As to how high it can get to, we've analyzed that on other studies, the current analysis only serves to show you that historically we are set for a strong 'Bullish June Seasonality' effect.
Do you agree that this is about to kick-in? Feel free to let us know in the comments section below!
-------------------------------------------------------------------------------
** Please LIKE 👍, FOLLOW ✅, SHARE 🙌 and COMMENT ✍ if you enjoy this idea! Also share your ideas and charts in the comments section below! This is best way to keep it relevant, support us, keep the content here free and allow the idea to reach as many people as possible. **
-------------------------------------------------------------------------------
💸💸💸💸💸💸
👇 👇 👇 👇 👇 👇
You can't unsee itThere is something to be said for the simplicity.
The historical price action is clear.
The RSI trend/cycles are just as clear.
There is not much space left for compression.
A BIG MOVE IS COMING.
The only question is, are you ready?
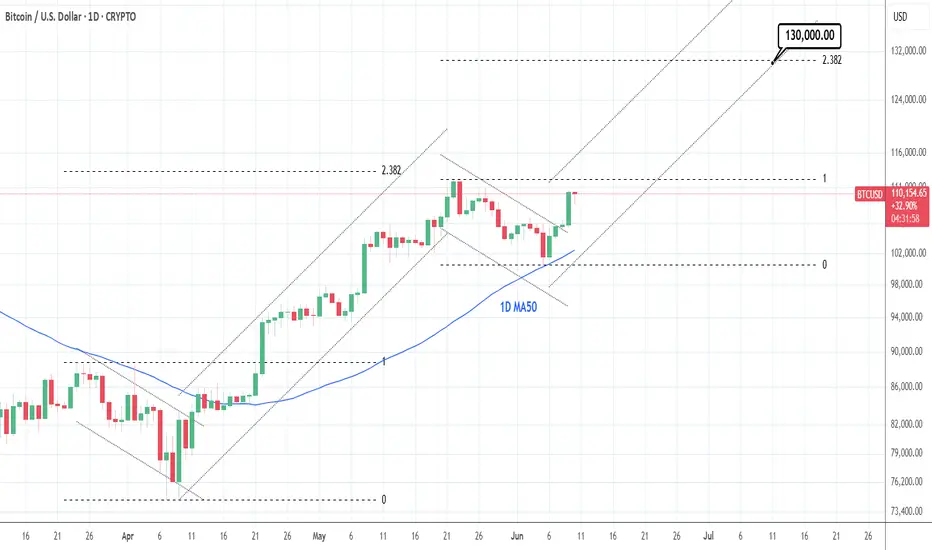
BTCUSD: Very aggressive rally to 130k has just started.Bitcoin turned bullish again on its 1D technical outlook (RSI = 61.233, MACD = 1503.700, ADX = 19.938) following yesterday's strong 1D candle, which is a result of the June 6th 1D MA50 rebound, and is even close to turning the day positive despite the correction early on. This rise is similar to the one that started after the April 7th rebound and eventually pearked just under the 2.382 Fibonacci extension. We remain bullish on Bitcoin, TP = 130,000.
## If you like our free content follow our profile to get more daily ideas. ##
## Comments and likes are greatly appreciated. ##
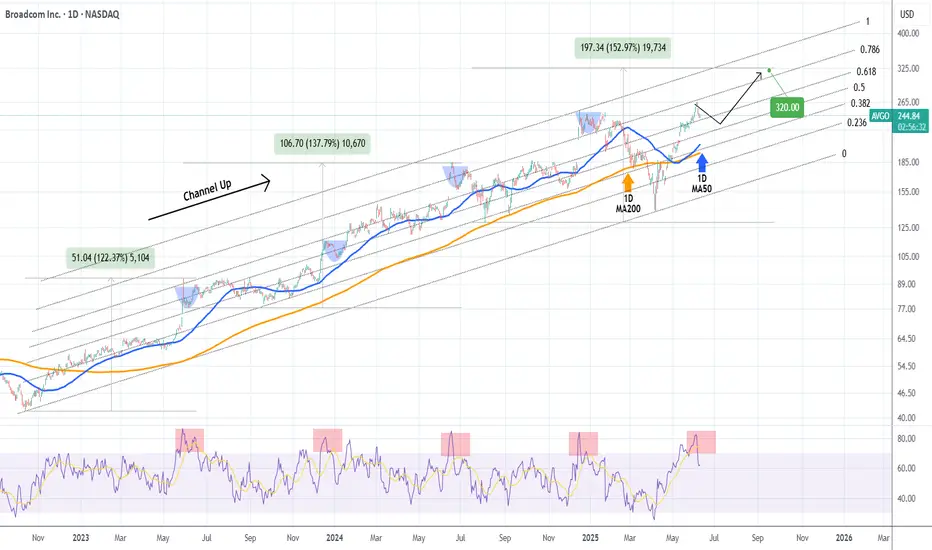
BROADCOM Pull-back to demand zone possible before new High.Broadcom Inc. (AVGO) is currently on a 3-day pull-back that started right on the 0.786 Fibonacci level of the 2.5 year Channel Up. The 1D RSI got heavily rejected from deep inside the overbought zone (>70.00) to back down below it and the only times that happened within this pattern, was during short-medium term pull-backs towards its 1D MA50 (blue trend-line).
As a result, the current pull-back can extend a little more towards the 1D MA50 and then rebound. Given a +15% added increas on each Bullish Leg of the Channel Up, we expect to see $320 next.
-------------------------------------------------------------------------------
** Please LIKE 👍, FOLLOW ✅, SHARE 🙌 and COMMENT ✍ if you enjoy this idea! Also share your ideas and charts in the comments section below! This is best way to keep it relevant, support us, keep the content here free and allow the idea to reach as many people as possible. **
-------------------------------------------------------------------------------
💸💸💸💸💸💸
👇 👇 👇 👇 👇 👇
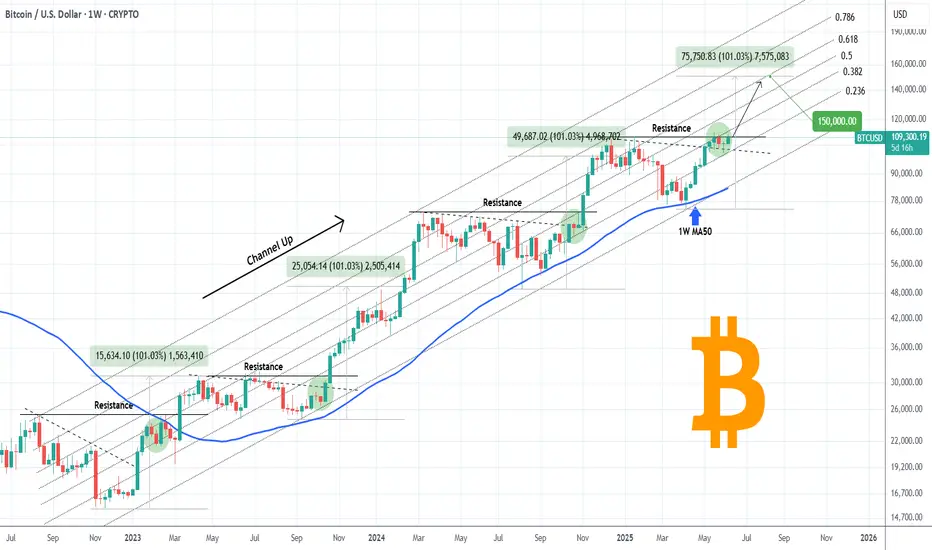
BITCOIN The beauty of structured patterns. $150k is next.Bitcoin (BTCUSD) has invalidated all bias calling for a deeper pull-back after May's new All Time High (ATH), as yesterday it broke above the previous ATH Resistance, invalidating the short-term Head and Shoulders pattern, while rebounding last week exactly on the dashed Lower Highs trend-line, confirming it as a Support level.
Within BTC's 3 year Channel Up pattern, we have seen this price action structure another 3 times. The minimum rise on such pattern has been +101% and that wasn't even a Lower Highs rebound. The other two that were exactly like the current formation, increased by a lot more.
As a result, we expect Bitcoin to complete a minimum +101% rise from the April 07 bottom, which translates to a clean $150000 Target.
Do you think the structure ill continue to hold up to $150k and possibly beyond? Feel free to let us know in the comments section below!
-------------------------------------------------------------------------------
** Please LIKE 👍, FOLLOW ✅, SHARE 🙌 and COMMENT ✍ if you enjoy this idea! Also share your ideas and charts in the comments section below! This is best way to keep it relevant, support us, keep the content here free and allow the idea to reach as many people as possible. **
-------------------------------------------------------------------------------
💸💸💸💸💸💸
👇 👇 👇 👇 👇 👇
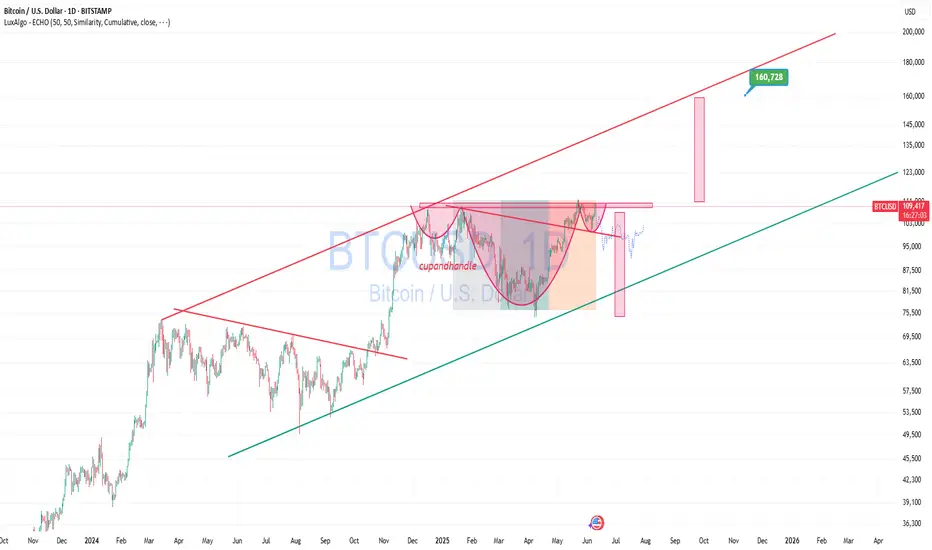
BTCUSD – continuing to buy as breakout confirms bullish setupBTCUSD is forming a classic “cup and handle” pattern, now breaking above key resistance. Price is holding within an upward channel, and if momentum stays strong, the next target could reach 160,000 and beyond.
It might seem hard to believe, but the structure points to continued bullish momentum. I’m not missing this opportunity and continue to build long positions as this breakout develops.
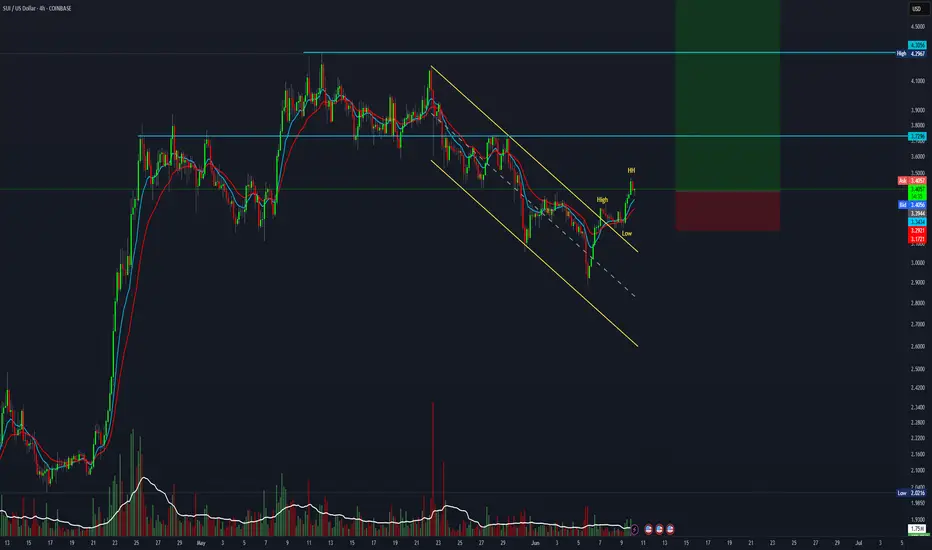
Trade setup for SUI 20 R:R. Now or never!!!BTC and ETH are already showing signs of reversal. Do you believe a bull run is coming? This might be a good setup before the market takes off. Risk-to-reward ratio of 20:1 — extremely risky but potentially very rewarding. Only two resistance levels left before reaching the all-time high (ATH).
Entry: 3.3944
Stop-loss: 3.1721
Target: 8.0000
This is for educational purposes only
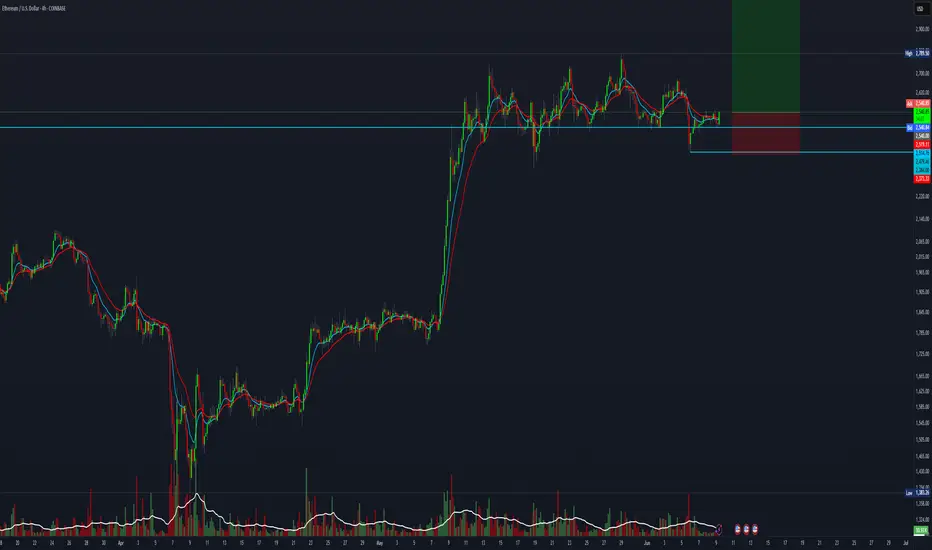
15 R:R setup for EthereumWe assume that this marks the beginning of a new uptrend for BTC. This setup offers an easy 15:1 risk-to-reward ratio.
Entry: 2534
Stop Loss: 2373.33
Target: 5000
This is for educational purposes only.
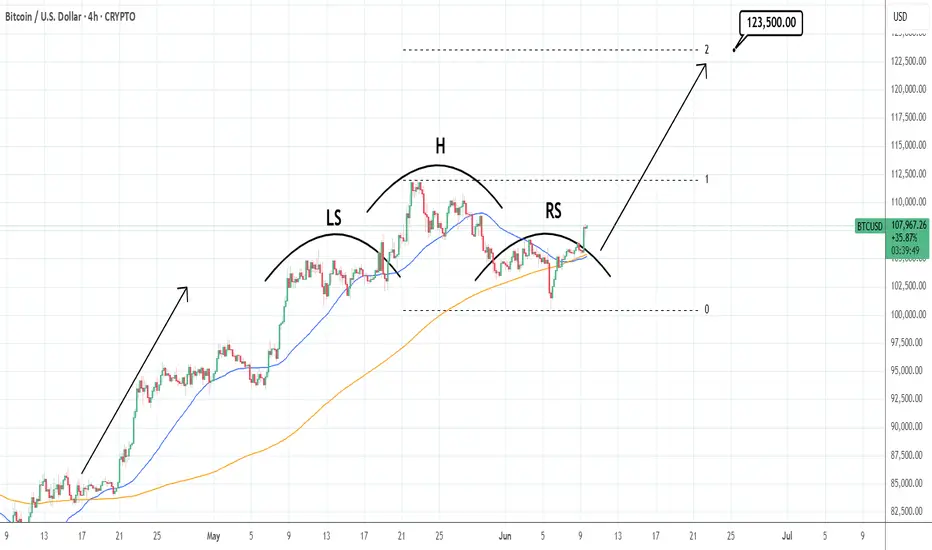
BTCUSD: H&S neckline invalidated! Heavily bullish.Bitcoin turned bullish again on its 1D technical outlook today (RSI = 58.910, MACD = 1101.600, ADX = 21.447) as it crossed over the neckling of the Head and Shoulders pattern and invalidated the bearish sentiment. This now targets the 2.0 Fibonacci extension to the upside on the short term, TP = 123,500.
## If you like our free content follow our profile to get more daily ideas. ##
## Comments and likes are greatly appreciated. ##
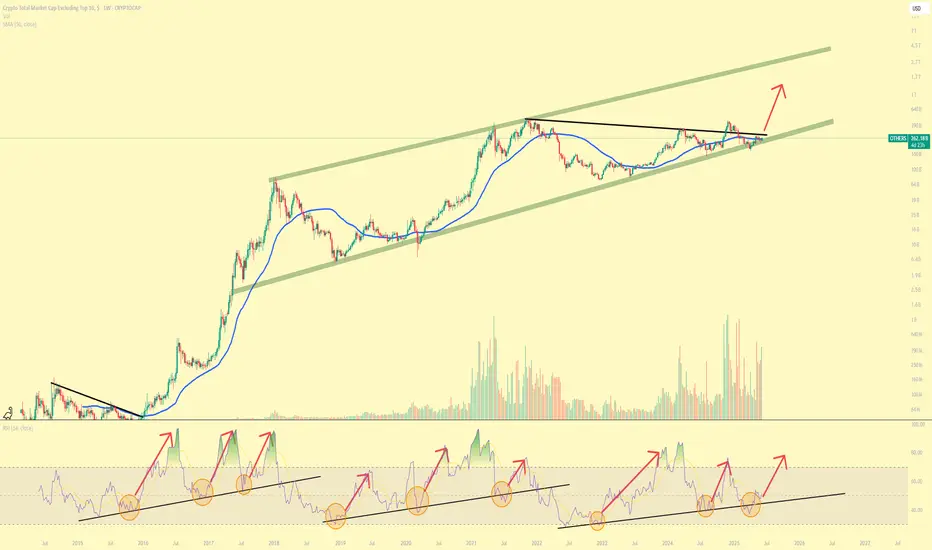
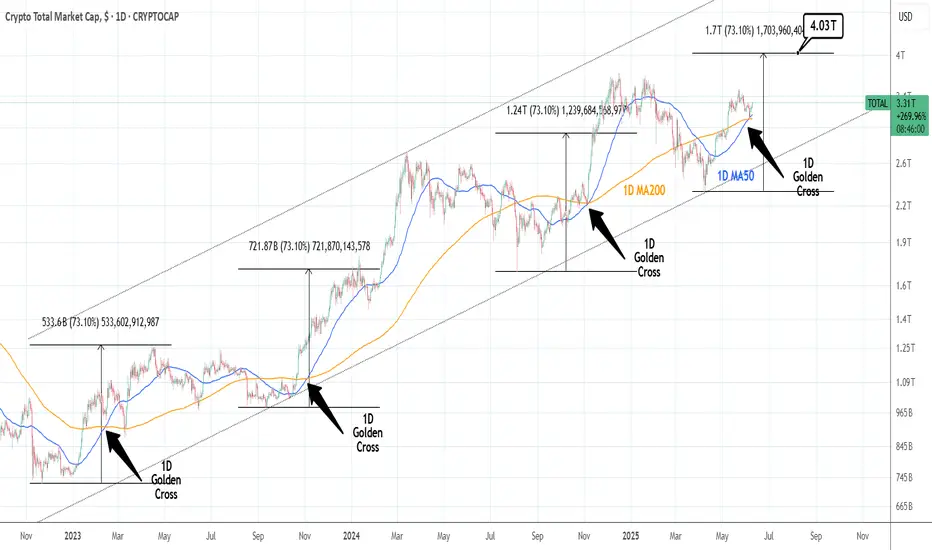
ALTCOINS made a 1D Golden Cross. First since U.S. elections.Crypto Total Market Cap just formed the first 1D Golden Cross ince November 6th 2024, which was right after the U.S. elections. The rally that followed made new highs. Since the Bear Cycle bottom, that is the 4th 1D Golden Cross and the minimum the market surged around such formation was +73.10%. This means that we can expected a 4.03T market cap at least.
## If you like our free content follow our profile to get more daily ideas. ##
## Comments and likes are greatly appreciated. ##
Ethereum Swing Trade: Short Setup with 2.2 R:R PotentialEthereum is approaching a potential breakdown from its current channel. A short swing trade setup with a 2.2 risk-to-reward ratio is forming. Wait for a confirmed break below the channel before entering.
Entry: $2,553
Stop Loss: $2,680
Target: $2,266
This is for educational purposes only.
Bitcoin above the supportBitcoin back tested the important yellow resistance on weekly and closed a hammer candle above the pivot.
I wont be surprise to see $130k in couple of weeks.
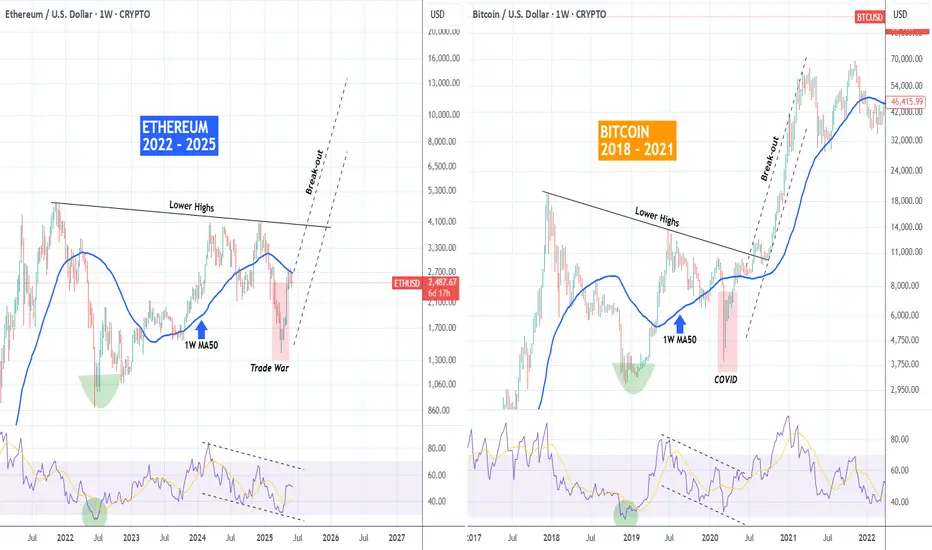
ETHEREUM is repeating BITCOIN's 2018-2021 Cycle!Ethereum (ETHUSD) has found itself on a very strong rally since the April 07 bottom, which resembles the V-shaped recovery of Bitcoin on the March 09 2020 bottom. In fact BTC's whole 2018 - 2021 Bull Cycle resembles ETH's 2022 - 2025 Cycle so far.
So far ETH is struggling to break above its 1W MA50 (blue trend-line) but the most important Resistance of the Cycle is the ATH Lower Highs trend-line. When that broke for Bitcoin, a parabolic rally started. Do you think we will see such a break-out on ETH too by the end of the year?
-------------------------------------------------------------------------------
** Please LIKE 👍, FOLLOW ✅, SHARE 🙌 and COMMENT ✍ if you enjoy this idea! Also share your ideas and charts in the comments section below! This is best way to keep it relevant, support us, keep the content here free and allow the idea to reach as many people as possible. **
-------------------------------------------------------------------------------
💸💸💸💸💸💸
👇 👇 👇 👇 👇 👇
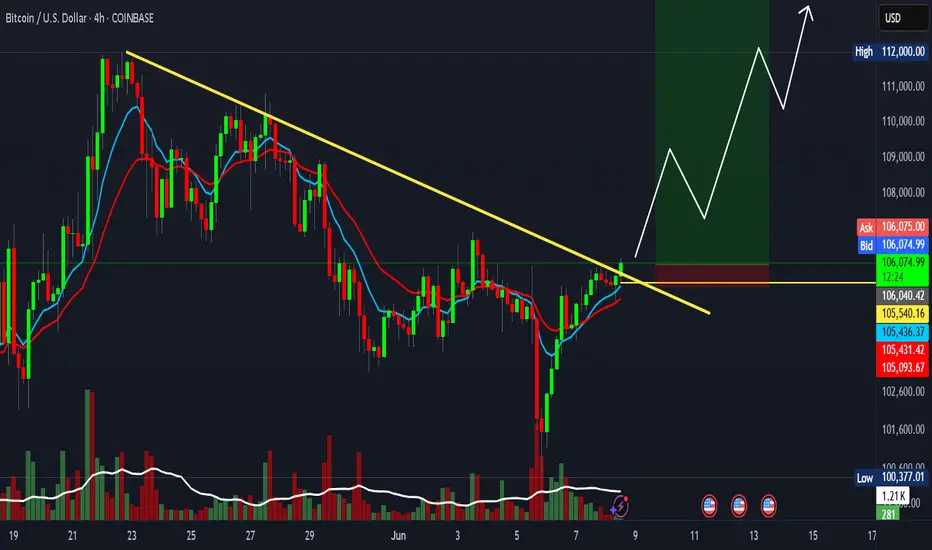
Super high risk setup BTC with 60 R:RIt looks like BTC is about to close the weekly candle above 106K.
If the bulls are still in control, they need to act very soon. The 100K support level has been successfully retested, and now could be the time for a move upward.
📈 Trade Setup (Educational Purpose Only):
Entry: 106,040
Stop Loss: 105,431
Target: 144,000
Risk-Reward Ratio: 1:60
This is a super high-risk setup, but the potential reward is significant. Proceed with caution and always do your own research.
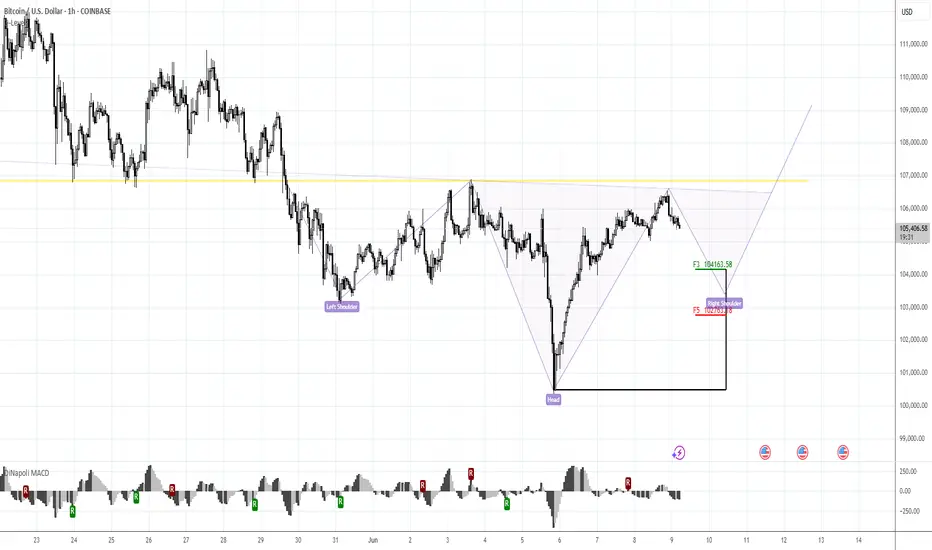
BTC 1H Reverse H&S Morning folks,
So, drop is done due to Trump-Musk conflict, although we haven't called to trade it. Anyway, current picture is much better and doesn't need a lot of comments. We have reverse H&S in progress, with potential area for entry around 102.5-103K where we expect the right arm should appear. Invalidation point is ~100K (bottom of the head).
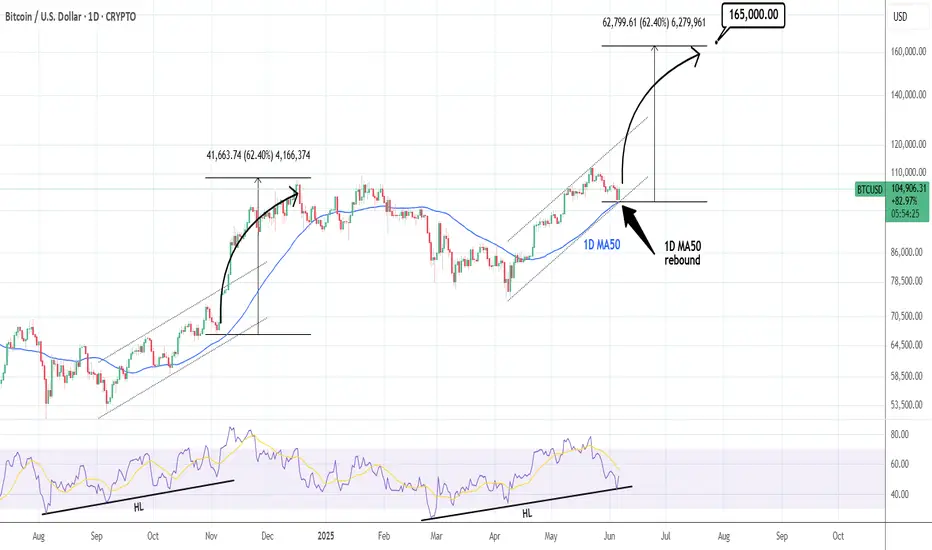
BTCUSD: Just hit the 1D MA50 and is rebounding.Bitcoin turned neutral on its 1D technical outlook (RSI = 51.000, MACD = 923.400, ADX = 25.014) as it hit its 1D MA50 for the first time since April 19th. That is a straight up buy signal, especially since the the current Channel Up with its 1D RSI HL structure, resembles September - December 2024. TP = 165,000.
## If you like our free content follow our profile to get more daily ideas. ##
## Comments and likes are greatly appreciated. ##
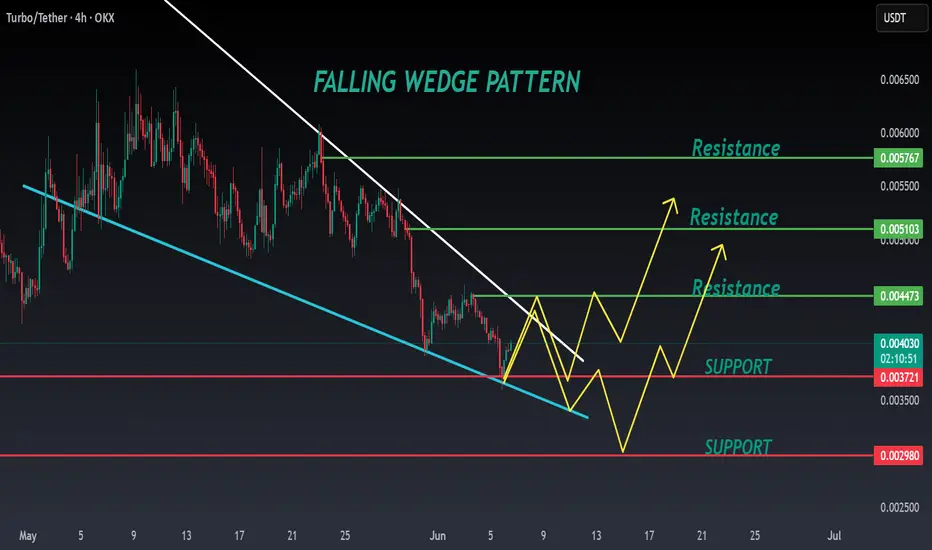
TURBO ANALYSIS📊 #TURBO Analysis
✅There is a formation of Falling Wedge Pattern on daily chart and currently pullback around its major support zone🧐
Pattern signals potential bullish movement incoming after sustain above the major support zone and breaks the pattern with good volume
👀Current Price: $0.004050
🚀 Target Price: $0.004470
⚡️What to do ?
👀Keep an eye on #TURBO price action and volume. We can trade according to the chart and make some profits⚡️⚡️
#TURBO #Cryptocurrency #TechnicalAnalysis #DYOR
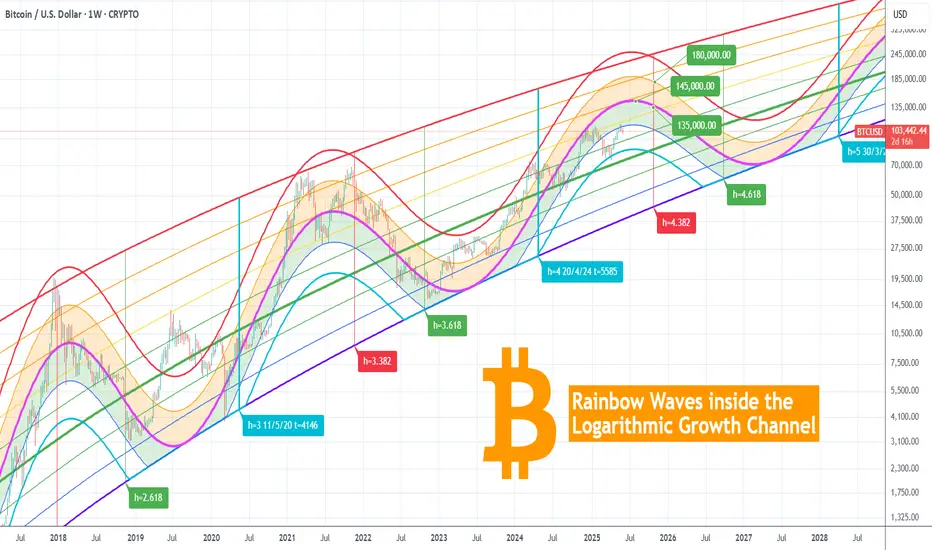
BITCOIN Log Channel and Waves show we're nowhere near the top.This is Bitcoin (BTCUSD) on its Logarithmic Growth Channel with the use of Rainbow Waves on it. This model accounts for the Halvings (light blue vertical lines) and with the use of Fibonacci Time extensions, it estimates the potential Cycle Bottoms (green vertical lines) and Tops (red vertical lines) within the Parabolic Growth Curve.
A fair value is estimated around the purple trend-line (zone top and bottom) as well as a maximum (red trend-line) and minimum (light blue trend-line) wave.
Interestingly enough, BTC hit that minimum wave trend-line on the April 07 2025 Low for the first time since June 17 2017, making it the strongest buy signal we could get at this stage of the Cycle.
So based on all the above, Bitcoin is nowhere near the top of its Cycle and this isn't just because it hasn't yet touched the next red vertical line (Time Fib 4.382) which is on October 27 2025, but also because it is currently trading below the Fair Value Zone (even below its bottom half).
Both previous Cycles topped considerably above that Fair Value Zone and almost hit the maximum wave. Even if by October 27 2025, Bitcoin 'only' hits the purple (Fair Value) trend-line, it would have reached $135000 and if earlier it can even hit $145000. That is the bare minimum based on that model. If it hits the top of the Fair Value Zone by October 27, then we can see prices as high as $180000 even.
Which price do you think we are more likely to see? Feel free to let us know in the comments section below!
-------------------------------------------------------------------------------
** Please LIKE 👍, FOLLOW ✅, SHARE 🙌 and COMMENT ✍ if you enjoy this idea! Also share your ideas and charts in the comments section below! This is best way to keep it relevant, support us, keep the content here free and allow the idea to reach as many people as possible. **
-------------------------------------------------------------------------------
💸💸💸💸💸💸
👇 👇 👇 👇 👇 👇