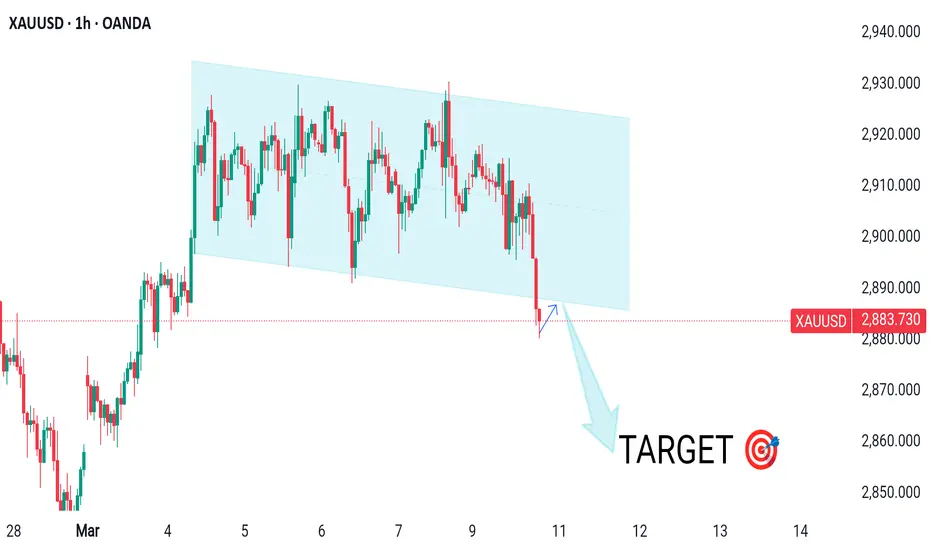
XAUUSD SHORT CHART MAPPING IN 1-H ATHello Guys Here Is Chart Of XAUUSD in 1-H AT
Sell Entry: Below 2886
Resistance: 2886 - 2890
Target: 2866 - 2860
Break-even: Your entry price (likely around 2880)
If price breaks below 2860, expect it to hit 2840 for support. If it moves above 2900, the setup may be invalid.
Cryptocurrency
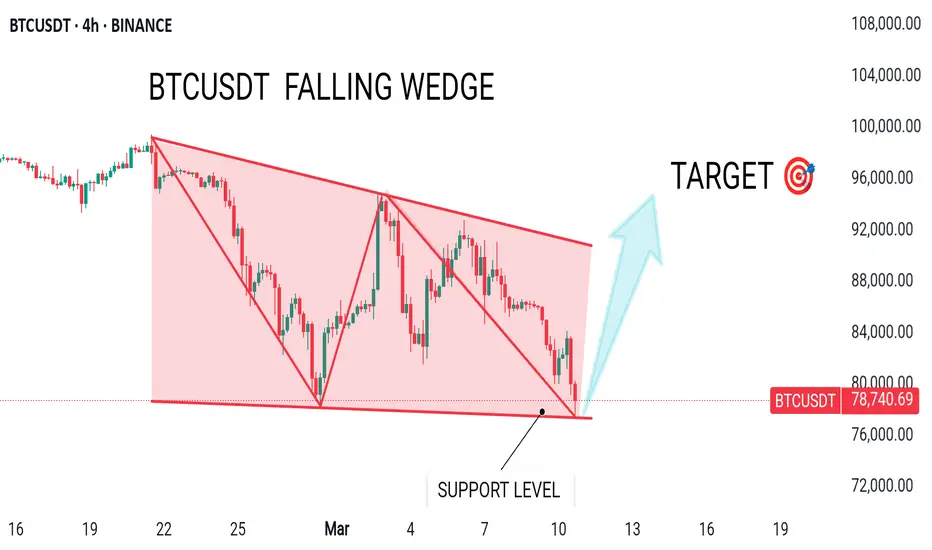
BTCUSDT MAKE FALLING WEDGE PATTERNHello Guys Here Is Chart Of BTCUSDT in 4-H AT
Entry Level: Buy Around 77500
Support: Below the recent low, around $77400 - $77000
Target Will Be : 90000
If BTC breaks below this level, the falling wedge pattern is invalidated, and further downside could occur.
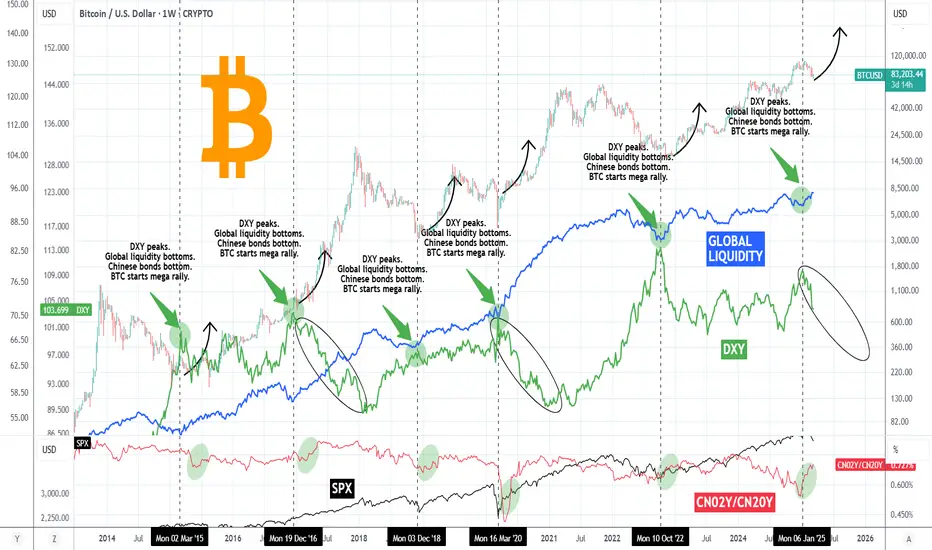
BITCOIN Money Supply, Dollar and Bonds pushing for MEGA RALLY!This is not the first time we publish a Bitcoin (BTCUSD) analysis in relation to the U.S. Dollar Index (green trend-line) or Chinese Bonds (red trend-line) and Global Liquidity (blue trend-line). In fact we have been doing this since the late 2022 bands in China and like the highly bearish sentiment that was in the market then, we decided to dive into this cross-asset analysis yet again in order to put the current sentiment in perspective.
Well it couldn't be more relevant. What we discovered is that all the financial assets mentioned above have yet again aligned to offer the strongest bullish confirmation for BTC since the November 2022 Bear Cycle bottom!
More specifically, we are a little past the point where the DXY peaks and declines aggressively, Global Liquidity bottoms and starts rising, while Chinese bonds (our CN02Y/CN20Y ratio) bottom and rise aggressively. In the past 10 years this combination of events has happened 6 times, 2 times during each Cycle: one at the bottom of the Cycle and the other when the final, most aggressive rally starts.
Notice also that (naturally) this is where the stock market (SPX, black trend-line) also bottoms and starts rising aggressively.
As a result, the above market conditions are an indication that despite the recent monthly correction and turbulence due to a number geopolitical and other trade fundamental reasons, the macro-economic parameters remain intact for the wider picture of this Cycle. Truthfully, this is where an announcement next week of future Fed Rate Cuts would come very handy.
So what do you think of this analysis above? Are you fearful that a new Bear Cycle is starting or more confident that the market will soon recover and price a new High? Feel free to let us know in the comments section below!
-------------------------------------------------------------------------------
** Please LIKE 👍, FOLLOW ✅, SHARE 🙌 and COMMENT ✍ if you enjoy this idea! Also share your ideas and charts in the comments section below! This is best way to keep it relevant, support us, keep the content here free and allow the idea to reach as many people as possible. **
-------------------------------------------------------------------------------
💸💸💸💸💸💸
👇 👇 👇 👇 👇 👇
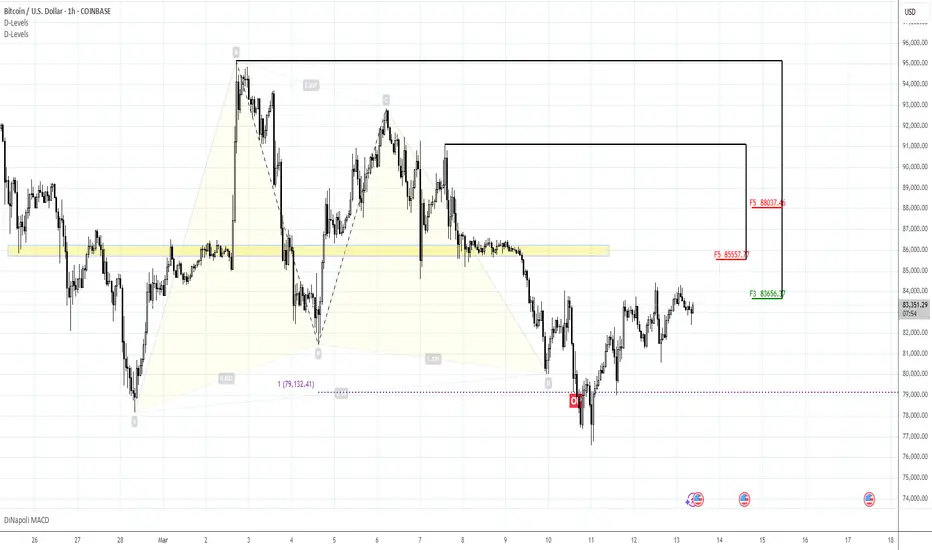
Selling?Morning folks,
So, Monday's plan has worked perfect, we're at 85K. Today we have to keep an eye on daily chart, where bearish grabber pattern might be formed and trigger downside action.
In general upside action is rather slow, so bearish context stands intact. We see only one risk for it - non-market driving factors, such as a D. Trump flood on X. But, this is out of our control.
That's why we keep everything as it is - 85K is considered for short entry. If we get daily bearish grabber also - all the better.
Next target stands around 74K
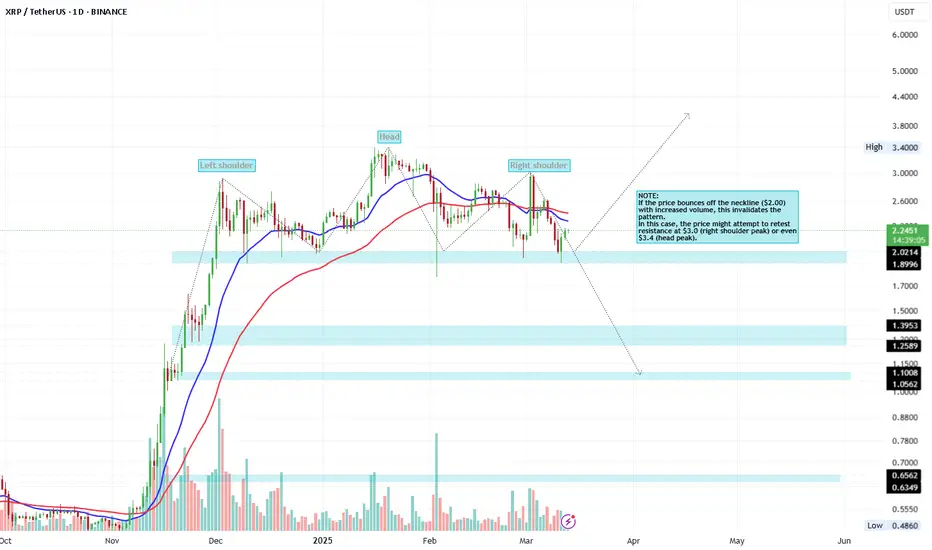
XRP | Head and Shoulders Pattern.
Head: $3.4.
Left Shoulder: $2.9.
Right Shoulder: $3.0.
The Neckline: $2.00.
Components of the Pattern:
Left Shoulder: Represents the first peak at $2.9, where the price rose and then retreated to the neckline at around $2.00.
Head: The highest peak at $3.4, the topmost point of the pattern, followed by a retreat to the neckline at $2.00.
Right Shoulder: The second peak at $3.0, lower than the head, followed by a retreat to the neckline at $2.00.
Neckline: Remains at approximately $2.00, a horizontal support level connecting the lows after the left shoulder and the head and the right Shoulder.
Implications of the Pattern:
The pattern remains a bearish reversal pattern, indicating a weakening of bullish momentum after reaching the head at $3.4.
If the price breaks below the neckline ($2.00) with increased volume, this confirms the pattern’s completion and signals a significant decline.
Current Situation (March 2025):
The current price ($2.2) is very close to the neckline ($2.00), making a breakout likely in the coming days.
The potential crossover of the moving averages (blue and red lines) supports the possibility of a trend change.
NOTE:
If the price bounces off the neckline ($2.00) with increased volume, this invalidates the pattern.
In this case, the price might attempt to retest resistance at $3.0 (right shoulder peak) or even $3.4 (head peak).
Conclusion:
The Head and Shoulders pattern: indicates a strong potential for a bearish reversal, if the price breaks below the neckline ($2.00). Confirmation of the breakout with increased volume is essential, while considering fundamental news that might influence the market.
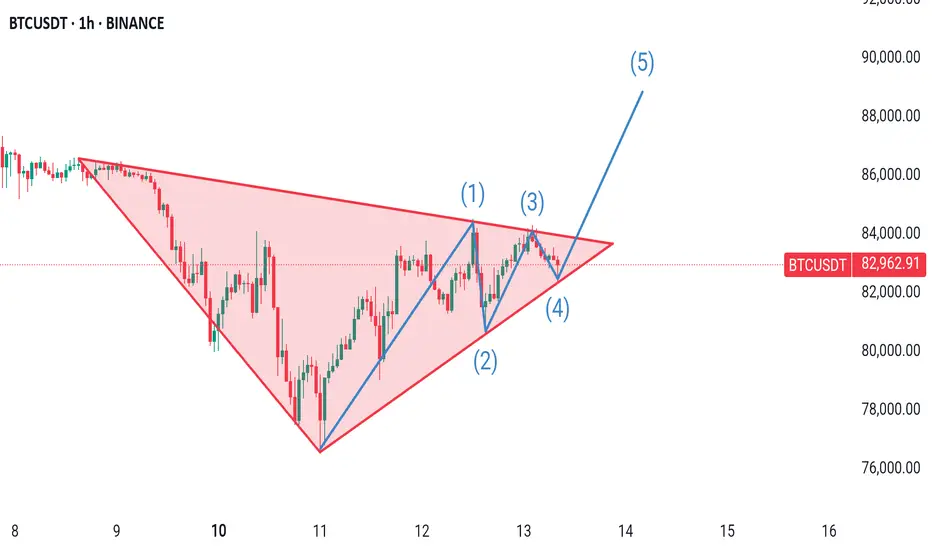
BTCUSDT TRIANGLE CHART PATTERN IS HEREHello Guys Here Is Chart Of BTCUSDT in 1-H AT
Entry Level: Buy Around 81000-80700
Support: Around $78000
Target Will Be : 88000
If BTC breaks below this level, the Triangle pattern is invalidated, and further downside could occur.
Ethereum: Rebound from here or Drop to $881?Hey everyone! Let’s explore what’s happening on Ethereum’s monthly chart. Right now, there seem to be two main possibilities to keep in mind. The first and more likely scenario involves a dip toward the lower price zones—around 881.56—and then testing important supports near 579.41 and 756.03. Observations suggest that if the price heads down to these areas, there could be a bounce, though a deeper move is possible (even if it seems less likely). On the flip side, if the price climbs from its current level toward its previous peak, we’d want to revisit this analysis for updates.
Key price zones are highlighted on the chart, showing where a lot of buying or selling could happen. A change in trend would typically be confirmed by a clear candlestick pattern and solid trading volume, so those are worth watching. As with any market, unexpected moves can always occur, so it’s good to stay prepared and flexible.
Remember, these are just observations based on the monthly chart, and personal research is always important. Stay curious, stay safe, and never hesitate to dig deeper into your own analysis before making any decisions. Good luck out there! 💼📈

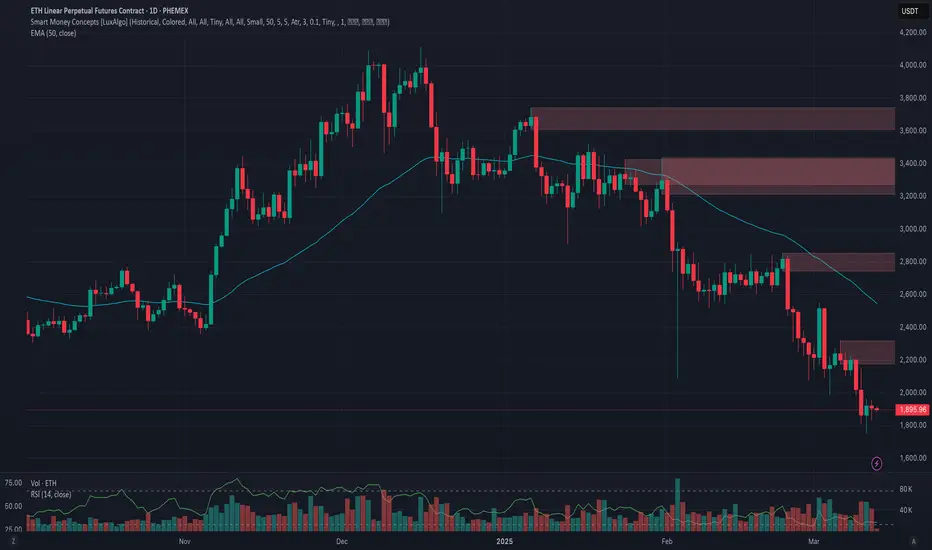
Phemex Analysis #67: Is It Time to Buy Ethereum (ETH) Now?!Ethereum (ETH), the second-largest cryptocurrency by market capitalization, has experienced significant price volatility recently. After reaching a high of $4,112, ETH's value declined to $1,752, reflecting a broader market downturn. This sharp correction has led many investors to question whether now is an opportune moment to "buy the dip." To navigate this uncertainty, it's essential to consider various scenarios that could influence Ethereum's price trajectory.
Scenario 1: Continued Downtrend
The recent breach of key support levels, coupled with the Relative Strength Index (RSI) entering oversold territory, suggests that bearish momentum may persist. If Ethereum fails to maintain support at $1,752, it could test lower levels, potentially around $1,500, $1,368, or even $1,150. External factors, such as macroeconomic pressures and reduced investor confidence, could exacerbate this decline.
Pro Tips:
Short Positions: Experienced traders might consider short-selling strategies to capitalize on further declines, ensuring they have a clear exit plan.
Buying at Support Levels: Long-term holders may consider accumulating gradually near these support levels.
Scenario 2: Consolidation Phase
Ethereum may enter a consolidation phase, trading within a defined range as the market seeks direction. This period of sideways movement could last until new catalysts emerge to drive the price either upward or downward.
Pro Tips:
Range Trading: Identify key support levels ($1,753, $1,500, $1,368) and resistance levels ($2,317, $2,856, $3,436) to execute buy and sell orders effectively within the trading range.
Patience: Avoid overtrading during consolidation; wait for clear signals before making significant moves.
Scenario 3: Bullish Reversal
Despite recent declines, Ethereum's strong fundamentals and ongoing network developments could lead to a bullish reversal. If ETH manages to reclaim and sustain levels above $2,000, it may signal renewed investor confidence and the potential for an upward trend.
Pro Tips:
Accumulate Gradually: Consider dollar-cost averaging to build a position without exposing yourself to immediate market volatility.
Stay Informed: Keep abreast of technological upgrades and institutional adoption that could positively impact Ethereum's value.
Conclusion
Deciding to invest in Ethereum during its current price dip requires careful consideration of various market scenarios. By employing strategic approaches tailored to each potential outcome, traders can better navigate the complexities of the cryptocurrency market. As always, thorough research and prudent risk management are essential when making investment decisions.
Tips:
🔥 Break free from "buy low, sell high"! Our new Pilot Contract empowers you to profit from ANY market direction on DEX coins with up to 3x leverage. Go long, go short, go further!
Check out Phemex - Pilot Contract today!
Disclaimer: This is NOT financial or investment advice. Please conduct your own research (DYOR). Phemex is not responsible, directly or indirectly, for any damage or loss incurred or claimed to be caused by or in association with the use of or reliance on any content, goods, or services mentioned in this article.
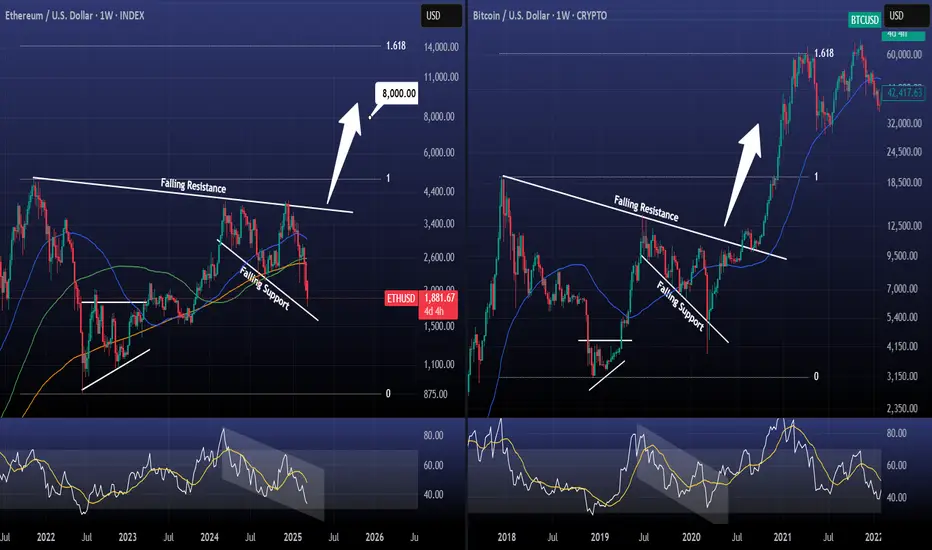
ETHEREUM copying Bitcoin's 2018-2021 Cycle and targets $8000!Ethereum / ETHUSD is under heavy pressure since the early December (2024) High and this week almost touched the 12 month Falling Support.
Even though that's devastating news for short term traders, long term holders may remain bullish just by looking at Bitcoin's 2018-2021 Cycle, which ETH has been repeating very closely.
A rebound on the Falling Support caused a massive breakout above the Falling Resistance and BTC rallied to the 1.618 Fibonacci extension.
In our opinion we can target at least $8000 on this Cycle.
Follow us, like the idea and leave a comment below!!
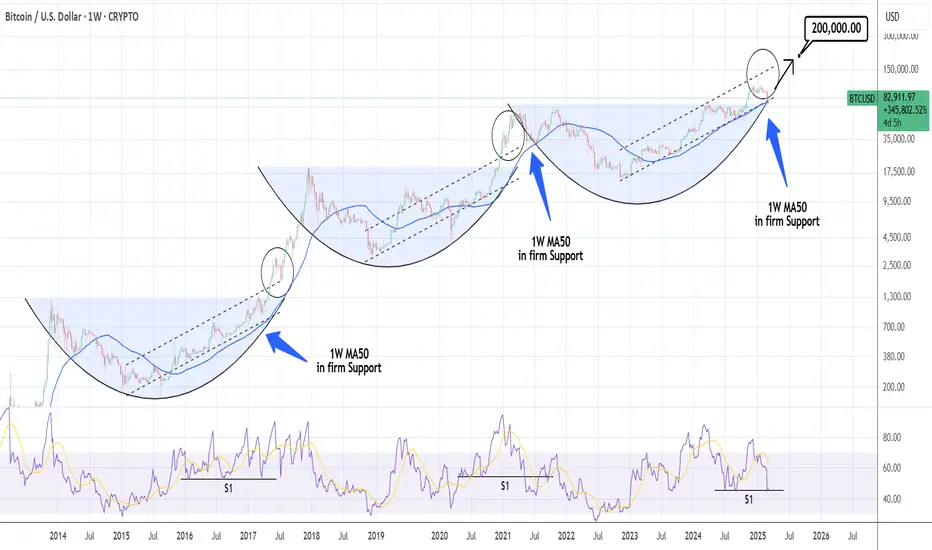
BTCUSD: Last 1W MA50 rebound to the top of the CycleBitcoin remains bearish on its 1D technical outlook (RSI = 40.004, MACD = -3484.800, ADX = 36.461) but today we see the first recovery attempt. The technical reasoning behind it is that the market is testing its 1W MA50 and in due time it will price the new HL of the Bull Cycle and form the bottom that will hold for the rest of the year until the cycle's very top. This is no different than the last two Cycles, the 1W RSI is even rebounding on its S1 level. Based on that pattern we are looking at a potential Cycle peak between 150k - 200k.
## If you like our free content follow our profile to get more daily ideas. ##
## Comments and likes are greatly appreciated. ##
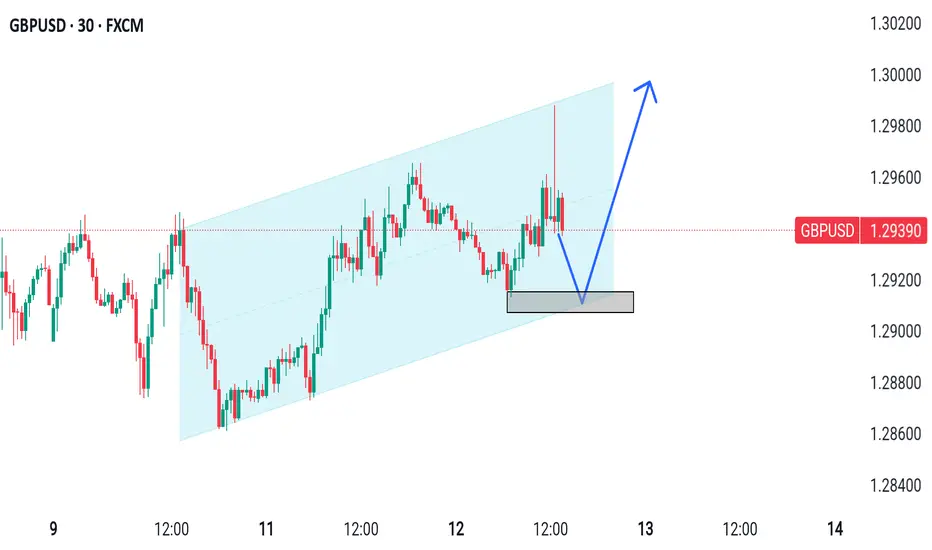
GBPUSD Looks Parallel Channel Hello Guys Here Is Chart Of GBPUSD in 30-M AT
Support: Around 1.2900
Target Will Be : 1.3000
Resistance: The upper trendline of the Trend CHENNEL around 1.3000
This analysis assumes the price respects the trend channel. A breakdown below support could invalidate the setup.
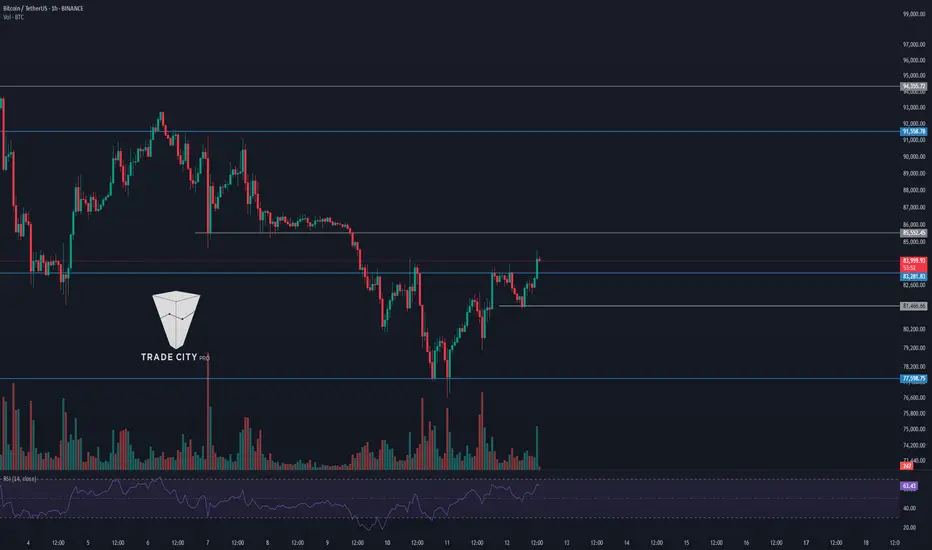
TradeCityPro | Bitcoin Daily Analysis #31Welcome to TradeCity Pro!
Let's move on to Bitcoin analysis and important crypto indicators. In this analysis, as usual, I want to review the triggers of the New York Futures Session for you.
1-hour time frame
In the 1-hour time frame, after the price reached 77598, the fall ended and we witnessed an upward correction to the 83281 area.
The 83281 area has become a very important resistance and the price is reacting well to it. A reverse head & shoulder pattern is visible on the chart that has not yet been activated, and with the failure of the 77598 area, we will confirm the activation of this pattern.
If 77598 is broken, the price can move at least to the 83281 area. The next resistances are also within reach of the price, and if strong momentum enters the market, the price can register higher targets.
The buying volume in the market is much less than the selling volume, and the sellers' power is still greater than the buyers'. However, if the 83281 area is broken, this volume can be more in favor of the buyers and the price can move up.
For a short position, if the price rejects the 83281 area or if the failure of this resistance is faked, you can enter a short position with the trigger 81466 to the target 77598.
I have no more talk about Bitcoin, let's move on to the analysis of the indicators so that we can also check the conditions of the altcoins.
BTC.D Analysis
Let's move on to the analysis of Bitcoin Dominance, Dominance has finally stabilized above the 61.61 area and reached the 62.19 area. If this area is broken, Dominance can start its new upward leg.
If Dominance rejects this important ceiling, Dominance's downward leg can continue to 61.61. Dominance's main support is currently 61.08.
Total2 Analysis
Let's move on to Total2 analysis, as you can see, this indicator is at a lower level and has not yet reached the ceiling in the 1.04 area and has recorded its new resistance in the 1.01 area.
The reason for this is Bitcoin's dominance, which has become bullish and more money has entered Bitcoin than altcoins. However, if Dominance breaks 1.01, you can enter a position if Dominance falls.
For short, the first trigger is 984 and the main trigger is 953.
USDT.D Analysis
Let's move on to the Tether Dominance analysis, as you can see, Dominance has broken the trend line it had and is now ready to fall. If it breaks 5.30, you can get confirmation of Tether's Dominance falling.
To confirm Dominance's bullishness, we can get confirmation if it breaks 5.49, which means the market can fall and if these triggers overlap with the Total2 trigger, you can find an altcoin and open a position.
📝 Final Thoughts
Stay calm, trade wisely, and let's capture the market's best opportunities!
This analysis reflects our opinions and is not financial advice.
Share your thoughts in the comments, and don’t forget to share this analysis with your friends! ❤️
BTC/USDT Price Analysis: Reversal or More Downside?:
📊 BTC/USDT 2-Hour Chart Analysis
🔻 Current Trend:
BTC is in a downtrend 📉, trading below the 30 EMA (🔴 84,270 USDT) and 200 EMA (🔵 88,644 USDT).
The price is currently 82,406 USDT and approaching a key support zone (🟣 ~80,000 USDT).
Support & Resistance Levels
🟣 Support Zone (~80,000 USDT) – Possible bounce area ⬆️
🟣 Mid-Resistance (~86,000–88,000 USDT) – First hurdle 🚧
🟣 Major Resistance (~96,000 USDT) – Final target 🎯
Possible Price Movement (🔵 Blue Line Projection)
✅ Bullish Case:
If BTC bounces off support 🏋️, it could move towards 88,000 USDT 🚀 and then 96,000 USDT 🎯.
❌ Bearish Case:
If BTC breaks below 80,000 USDT, we might see more downside ⚠️.
💡 Trading Tip:
Watch price action 📊 at support & resistance.
Look for confirmation signals ✅ before entering trades.
🚀 Are you bullish or bearish on BTC? 🔥

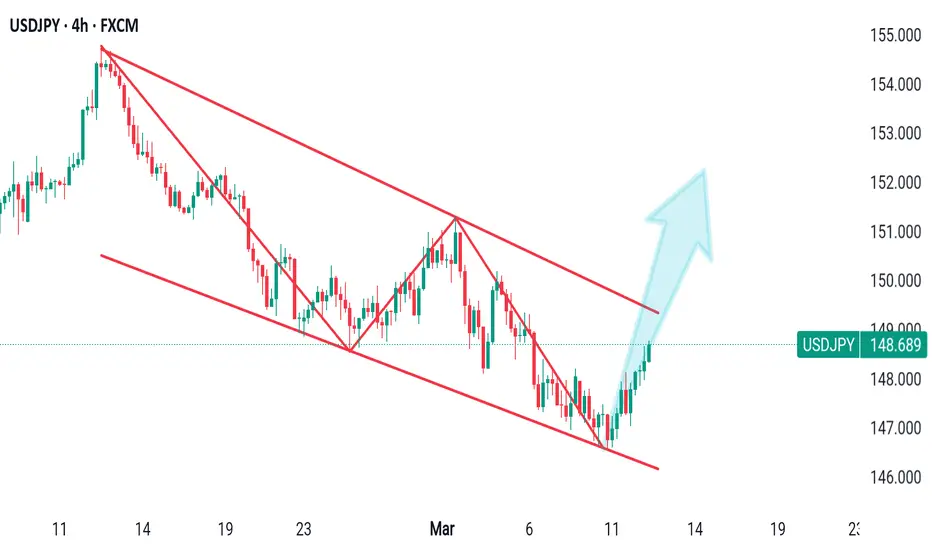
USDJPY MADE FALLING WEDGE PATTERN IN 4-H TA Hello Guys Here Is Chart Of USDJPY in 4-H AT
Entry Level: Buy Around 142.000
Support: lower Low around $140.000
Target Will Be : 154.000
If USDJPY breaks upper resistance level, the wedge pattern is successful,
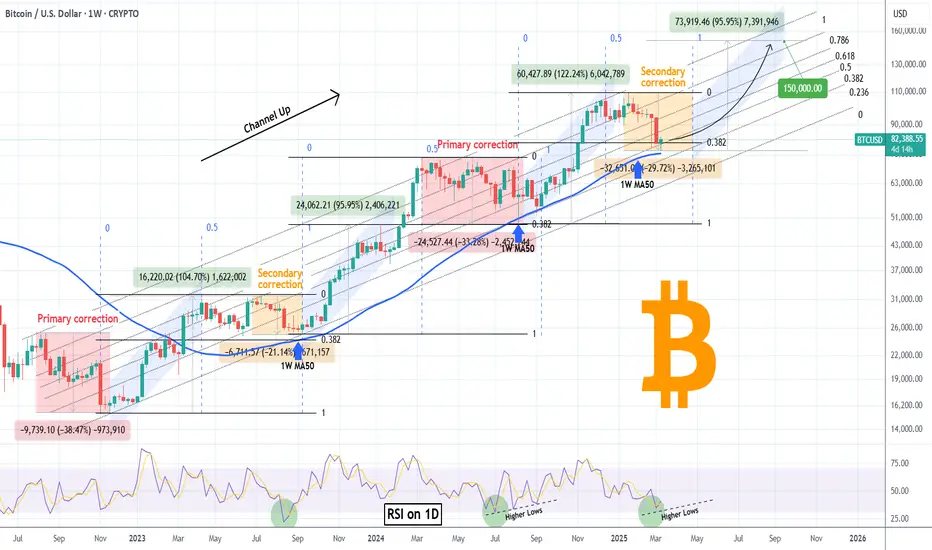
BITCOIN Cycle pattern completed. Year-end Target locked at $150kBitcoin (BTCUSD) is showing the first signs of life after nearly testing the 1W MA50 (blue trend-line) early this week. Whether this leads to a full on recovery or not, can been partially answered by this Cycle's price action so far.
Historically we do know that BTC's Bull Cycles so far tend to peak towards the end of their 3rd year and that's 2025. This Cycle has been predominantly trading within a Fibonacci Channel Up, since its very start, the November 2022 bottom. Its 1W MA50 has been supporting since the March 13 2023 break-out, so it's been exactly 2 years of holding and throughout this time period has provided two excellent buy opportunities.
As you can see, the Channel Up can be classified into two main Phases so far: each has a Primary correction (red) of more than -30% drop, followed by a rally (blue), then a Secondary correction (yellow) of more than -20%, followed by the second and last rally (blue). All rallies have so far been around +100%. Based on this model, we are now on the Secondary correction of Phase 2.
Notice that all corrections (either primary or secondary) hit or approached apart from the 1W MA50, the 0.382 Fibonacci retracement level from their previous Low. This is actually the first time that the price has marginally broken below the 0.382 Fib. At the same time, the 1D RSI almost got oversold last week (34.50) and according to the August 05 2024 (Higher) Low, this is were a series of RSI Higher Lows would be a signal of a new bottom formation.
The bottom and recovery process may take a while though, another 4-6 weeks. According to the Time Fibs (blue dashed vertical lines), each correction (whether primary or secondary) has ended at or a little before the 1.0 Fib with the 0.0 being the bottom of the previous one and 0.5 Fib the Top of the rally. Based on this, we can expect the new rally to start by the week of April 28 the latest.
So now as to how high this can get, if it repeats the 'weakest' rally of the Channel's three so far, it should rise by +95.95%, which gives us a straight price of $150000 as a Target. If the rally symmetry also holds, this should come by late September, perfectly aligning with Bitcoin's historic Cycle expectation for the final year.
Do you think that will be the case? Recovery starting within 4-6 weeks and if so, are you expecting $150k? Feel free to let us know in the comments section below!
-------------------------------------------------------------------------------
** Please LIKE 👍, FOLLOW ✅, SHARE 🙌 and COMMENT ✍ if you enjoy this idea! Also share your ideas and charts in the comments section below! This is best way to keep it relevant, support us, keep the content here free and allow the idea to reach as many people as possible. **
-------------------------------------------------------------------------------
💸💸💸💸💸💸
👇 👇 👇 👇 👇 👇
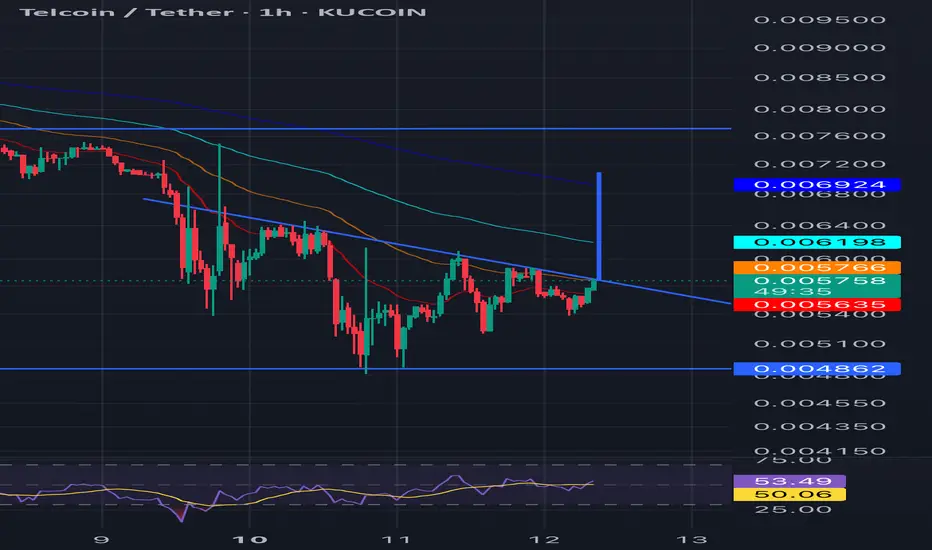
Tel coin bullish on the hourly Things are still looking bullish for Telcoin small timeframe looks bullish if we can confirm the breakout of this head and shoulders. macro timeframe looks bullish as well.
(jasmy) JASMY bar array pattern fading in and out of a low motion pattern indicator. Use examples from the past to understand the meaning. included lines from previous posts unchanged in purple representing key moments of the jasmy chart for reference. The price broke the previous lows.

2 Options, Keeping it simpleBTC is currently within its long-term ascending channel but has shown strong rejection at the upper boundary (~$100K).
A pullback toward the mid-channel support (~$70K-$75K) seems likely, aligning with historical retracement patterns.
Indicators Show Weakness:
RSI Divergence suggests a slowdown in momentum.
MACD hints at a potential bearish crossover.
📉 Key Levels to Watch:
Resistance: $95K - $100K (Upper trendline)
Support: $75K (Mid-channel), $60K (Lower trendline)
📈 Scenario 1: BTC consolidates and regains strength for a new ATH attempt.
📉 Scenario 2: A deeper correction to the lower trendline before continuation.
Needs to really break $95k first.

TradeCityPro | HBARUSDT Better Condition Than the Market!👋 Welcome to the TradeCityPro channel!
Let's go together and examine one of the popular coins in the market that has experienced less correction recently and is in better condition than other altcoins!
🌐 Overview Bitcoin
Before starting the analysis, I want to remind you again that we moved the Bitcoin analysis section from the analysis section to a separate analysis at your request, so that we can discuss the status of Bitcoin in more detail every day and analyze its charts and dominances together.
This is the general analysis of Bitcoin dominance, which we promised you in the analysis to analyze separately and analyze it for you in longer time frames.
📊 Weekly Timeframe
We go to the weekly time frame and see that hbar's condition is much better than other altcoins, and this is precisely due to the entry of momentum and Bitcoin's bullishness!
After we broke through the support at 0.04339 and engulfed the previous weekly candle, it was a bullish sign, and after the trigger at 0.06219 was activated, we broke this resistance and momentum entered this coin!
If you made your purchase in the spot section from this level, the situation is okay for now, but you can save profit or withdraw the principal capital. If you want to re-enter, you can make your purchase after the 0.33056 break.
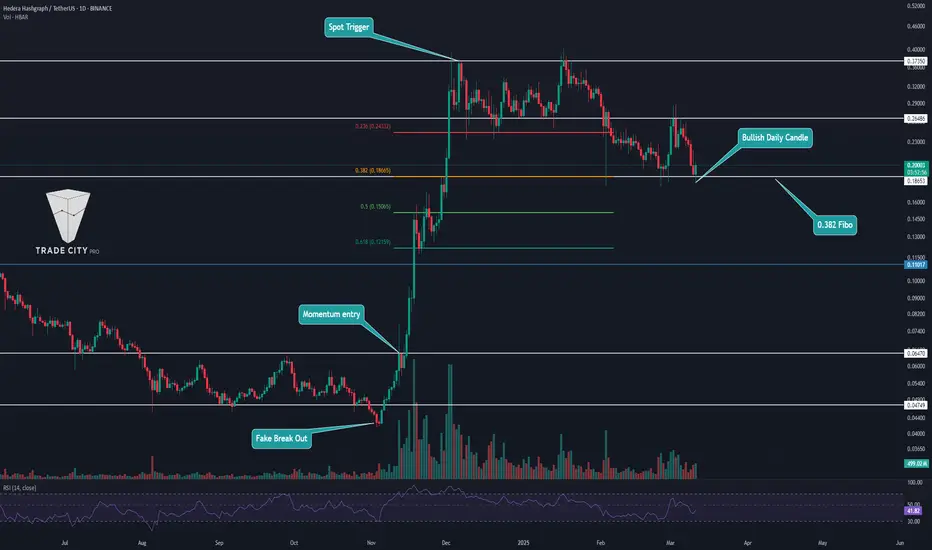
📈 Daily Timeframe
In the daily time frame, we have higher levels and a better situation than the rest of the coins, and in a situation where most altcoins are forming lower bottoms, this has not even lost its main level.
After the 0.06470 and daily box break, we experienced a movement of about 500%, and if we draw a Fibonacci, we are currently at the 0.382 level, and this in itself increases the importance of this level! If the 0.37350 ceiling is broken, it shows us that we are going to experience a new movement!
This daily candle can be a good trigger to buy again, and the reason is that we are rising from a good support level and it is also a good Fibonacci level, but this trigger is risky and after the break of 0.26486 it will be a better trigger to welcome, and for a temporary exit, you can also temporarily exit with a break of 0.18653.
📝 Final Thoughts
Stay calm, trade wisely, and let's capture the market's best opportunities!
This analysis reflects our opinions and is not financial advice.
Share your thoughts in the comments, and don’t forget to share this analysis with your friends! ❤️
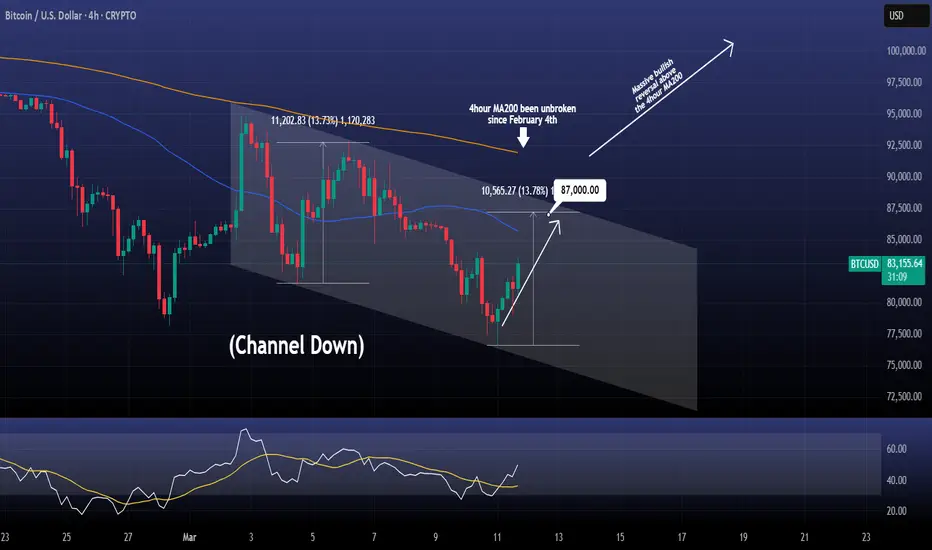
BITCOIN Short term Channel Down rebounding.Bitcoin / BTCUSD is having a rebound after the price hit the bottom of the 10 day Channel Down.
The bullish wave should attempt at least a +13.73% rise (similar to the previous one) and target 87000.
That is the short term bullish plan as the price may be rejected again at the top of the Channel Down.
If however the 4hour MA200 breaks, it will be the first time since February 4th and should be enough to restore the long term bullish bias back to the market.
Follow us, like the idea and leave a comment below!!
Bitcoin (BTC): Double Top Pattern / Wait For Neckline BreakWe are still looking for that neckline breakdown to happen from our "double top" pattern.
As soon as we get the break of the neckline, this would send the price back to lower zones (where the first target would be the 200 EMA zone at $86K, then the lower support zone).
Swallow Team

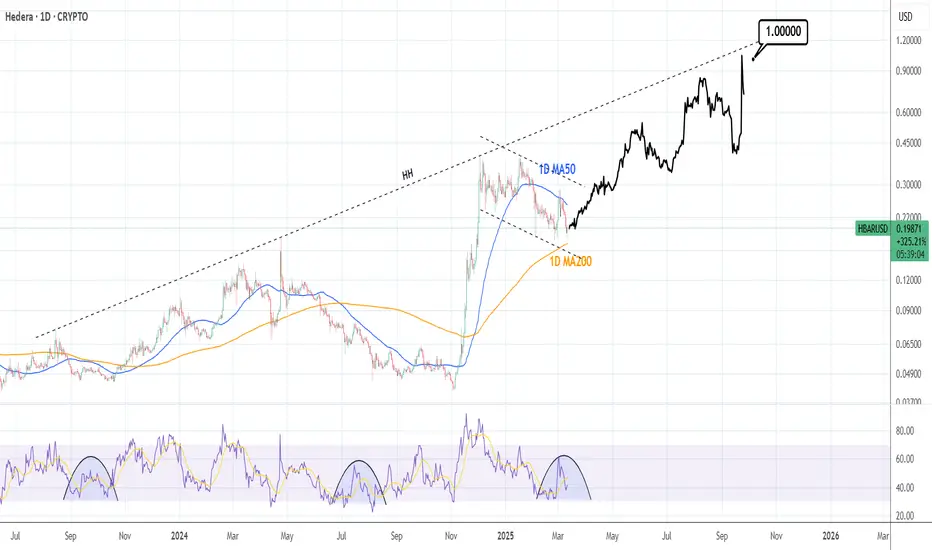
HBARUSD: Can it reach $1.00 by the end of the year?Hedera is bearish on its 1D technical outlook (RSI = 40.045, MACD = -0.011, ADX = 33.721) as it had a strong 1D MA50 rejection and approached its 1D MA200 seeking support. If it holds, the Channel Down of the past 3 months will turn out to be a Bull Flag that will greadually push the price to the HH trendline for the Cycle's Top. We believe that could be at $1.00 by the end of 2025.
## If you like our free content follow our profile to get more daily ideas. ##
## Comments and likes are greatly appreciated. ##
Hedera Goes From April Highs, To ATH, To Elliot Wave Theory? Lets break down what COINBASE:HBARUSD may be setting up for a long-term scenario!
We saw a impressive Bullish Rally from beginning of November 2024 that facilitated a Breakout of the April 2024 High @ .1842 to then create its All Time High @ .4010.
With this Price Action going from a Significant Low to create a new Higher High, we can apply the Elliot Wave Theory which is first supported by seeing some sort of Fibonacci Retracement from the Low to New High and we see that February of 2025 delivered a Fibonacci Retracement to the Golden Ratio Zone twice to now be showing support from Bulls pushing price higher!
Technically, with Wave 1 having been corrected successfully by Wave 2, both being completed, we now can expect price to give us another extension starting Wave 3, giving us a Break of the ATH created by Wave 1, to then confirm our directional bias and validate the Elliot Wave Theory.
Based on the Fibonacci Extension, we can project a potential "Roadmap" price may follow while outlining the rest of the Impulse and Corrective Waves where we see Price ultimately ending Wave 5 at the Potential Range Target of ( .7571 - .89441 )
Rules:
- The 2nd Wave cannot retrace the 1st Wave more than 100%
- The 3rd Wave can never be the shortest of the Impulse Waves ( 1,3,5 )
- The 4th Wave cannot retrace the 3rd Wave more than 100%
