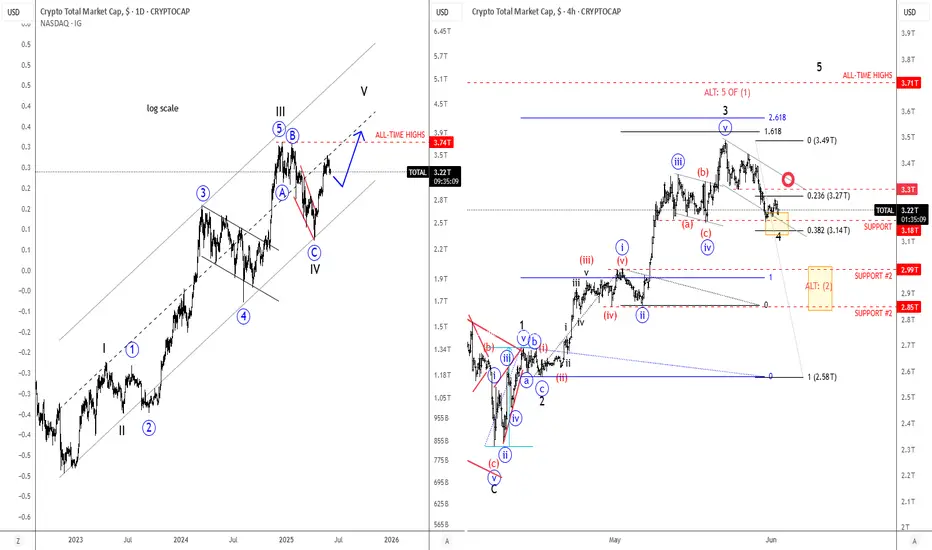
Crypto Market Slows Down For A Correction Within UptrendCrypto market nicely slowed down as expected and Crypto TOTAL market cap chart can now be finishing a projected wave 4 correction right at the former wave "iv" swing low and channel support line, which is ideal textbook technical picture that can now send the Crypto market higher for wave 5, especially if bounces back above 3.3T area and channel resistance line.
However, even if it's going to face deeper and more complex correction within higher degre wave (2) down to 3.0T - 2.8T area, sooner or later we can expect a bullish continuation, as Crypto TOTAL market cap chart is not at the all-time highs yet.
Cryptocurrency
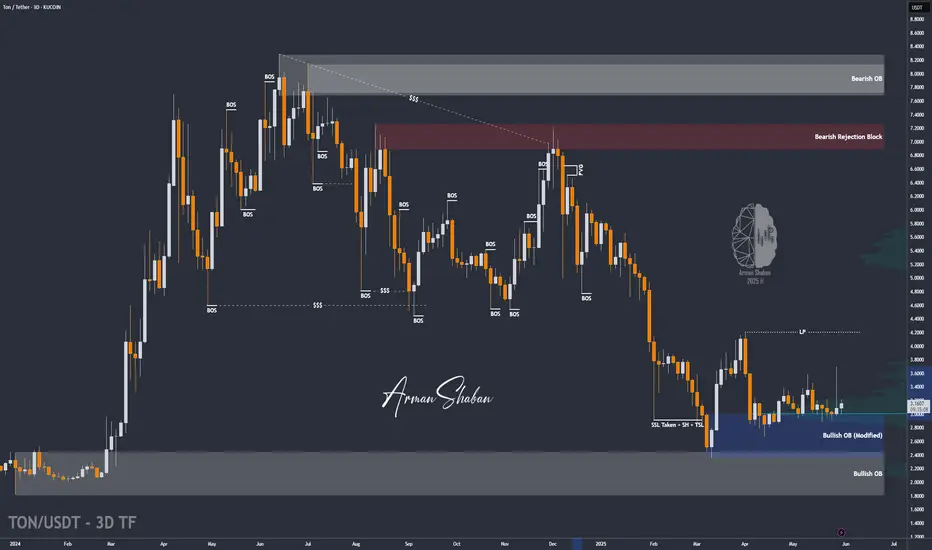
TONCOIN Hits First Target with 27% Gain – More Upside Ahead?By examining the #TONCOIN chart on the 3-day timeframe, we can see that after the last analysis, the price successfully hit the $3.64 target and has gained a total of 27%. Following this rise, the price entered a corrective phase and is currently trading around $3.15. The analysis remains valid, and I still expect further upside from this cryptocurrency. The expected return is around 20% in the short term, 40% to 55% in the medium term, and 110% in the long term.
Please support me with your likes and comments to motivate me to share more analysis with you and share your opinion about the possible trend of this chart with me !
Best Regards , Arman Shaban
SOL is next to set new ATH and here's whyHey guys! Like I said in my last review - SOL went to close GAP from the bottom, gathering liquidity.
❓ GAP is almost closed and time to reflect, what's next?
The liquidity imbalance has gotten bigger. If, as recently as last week, there was 1.5 times more liquidity in shorts. Today liquidity in shorts is almost 4 times more than liquidity in longs.
Which means that most of the speculative positions have already been closed. Of course, the volume of liquidations is not even close to the peak, which indicates that there is still no fresh liquidity on the market and therefore it is difficult for the token to maintain the current momentum.
Besides, summer is coming soon and liquidity will only become less. But for SOL this is a plus rather than a minus and here's why:
⚙️ Metrics and Indictors:
VRVP - we are approaching one of the most active levels, in the 148-136 zone. This zone is where the largest area of trader interest is concentrated. And it is in this zone that I think a lot of people will start looking at SOL from a spot buying perspective.
RSI - is 40. It is not in the oversold zone yet, but the GAP is not closed to the end. That means that the probable continuation of the decline to the psychologically important level of 150-147, may provoke a decline to the oversold level and the beginning of short-term purchases by traders.
DLD - as already mentioned. Liquidity of shorts is now 4 times more than liquidity in longs. And as we know, the price moves from one liquidity to another, which acts as fuel for it.
📌 Conclusion:
Unlike ETH and even BTC - there is no more GAP below in SOL! This means that all further declines will be based on effectively traded zones where there is already organic supply and demand. So we are unlikely to see 20% drops overnight (unless if Trump don't do something weird).
Besides, there is a lot of liquidity in shorts at levels 185 - 201 (local double top of the current momentum).
Short squeezes in historically bearish patterns are not uncommon now. As traditional technical analysis has not been working as it should for a long time due to its proliferation.
So I see the first test of the 146 -141 level as the first possible point for a price reversal, at least to renew the local high.
🔥 Congratulations to everyone on the start of summer and have a good week!

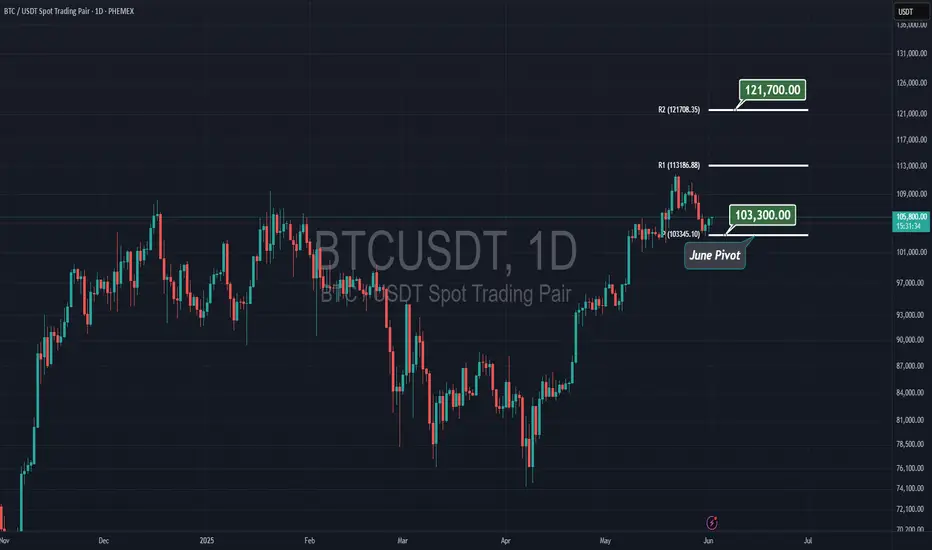
Bitcoin on JUNE's Pivot, $103kI believe $103,300 ( June's Pivot ) will hold bitcoin, and in few days we see a rally to the upside, and by the end of June, Bitcoin will reach to $121,700 which is the 2nd resistance for the pivot.
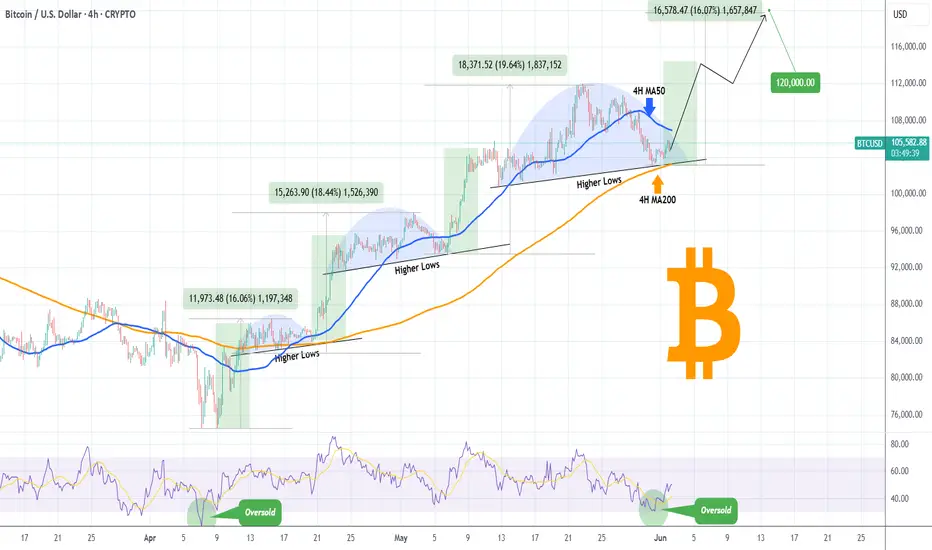
BITCOIN Can the 4H MA200 hold and kickstart the next rally? Bitcoin (BTCUSD) almost hit on Saturday its 4H MA200 (orange trend-line), which has been holding since April 16, and immediately rebounded. So far the bullish reaction is moderate as the price action is still being restricted below the 4H MA50 (blue trend-line), which is now acting as the short-term Resistance.
The blue Arc pattern that BTC has formed in the past 3 weeks, resembles the last two peak formations and pull-backs since the early April bottom. On top of all this, the 4H RSI got oversold (30.00) actually for the first time since the April 07 bottom.
With the weakest rally of this long-term Bullish Leg being +16.06%, if the 4H MA200 holds and a 4H MA50 break-out confirms it, we can expect a minimum short-term rise of almost $120k (+16.06%).
Do you think that's what's coming next? Feel free to let us know in the comments section below!
-------------------------------------------------------------------------------
** Please LIKE 👍, FOLLOW ✅, SHARE 🙌 and COMMENT ✍ if you enjoy this idea! Also share your ideas and charts in the comments section below! This is best way to keep it relevant, support us, keep the content here free and allow the idea to reach as many people as possible. **
-------------------------------------------------------------------------------
💸💸💸💸💸💸
👇 👇 👇 👇 👇 👇
TECHNICAL ANALYSIS – KASPA/USDT (Daily Chart) + TRADE PLANTECHNICAL ANALYSIS – KASPA/USDT (Daily Chart)
Chart Pattern & Price Action:
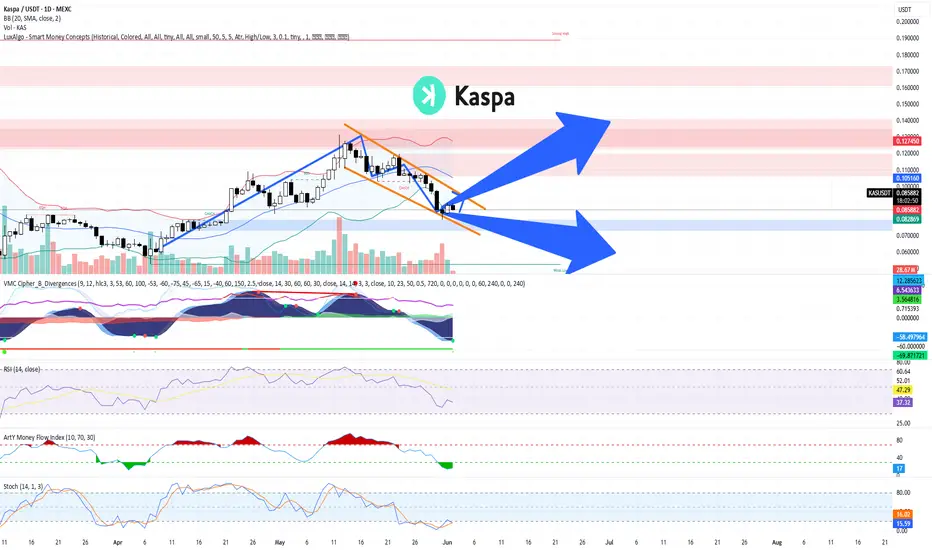
Descending Channel (Falling Wedge): KASPA has been trading within a falling wedge pattern, typically a bullish reversal setup.
Breakout Zone Approaching: Price is currently testing the upper resistance of the wedge (~$0.086–$0.088). A breakout from this level may indicate trend reversal.
Key Resistance Zone:
$0.105 – $0.127: Significant supply area (marked in red). Previously rejected, it is the next target if price breaks out upward.
Support Zone:
$0.073 – $0.082: Demand zone. Coincides with the Bollinger Band lower range and historical support.
Indicators Overview:
Bollinger Bands:
Price is trading at or near the middle band, showing a neutral-to-slightly bearish bias.
A breakout above the upper band (~$0.0895) could trigger bullish momentum.
MACD (VMC Cipher_B_Divergences):
Strong bearish momentum continues, but we can observe potential bullish divergence forming.
Green dot signal at the bottom may indicate a possible local bottom.
RSI (Relative Strength Index):
Currently at 37.06, near oversold territory.
Could signal a bounce if RSI climbs above 40 and confirms strength.
Money Flow Index (Art’ Money Flow):
MFI is deep in negative; however, these levels often precede trend reversals.
Watch for a crossover into positive territory as confirmation.
Stochastic RSI:
Bullish crossover around 14.53 / 15.67 in the oversold zone.
Early sign of potential short-term bounce.
TRADING PLAN
Entry Points:
Zone Type Price Range Reason
Buy Spot 1 Conservative $0.073 – $0.082 Strong historical support & bottom of wedge
Buy Spot 2 Aggressive ~$0.086 – $0.089 Breakout of descending wedge
Buy Spot 3 Momentum Break above $0.105 Bullish confirmation + breakout of major resistance
Take Profit Zones:
TP Level Price Notes
TP1 $0.105 First resistance / psychological level
TP2 $0.127 Strong resistance – expect rejection here
TP3 $0.15–0.16 Major extension target if strong momentum
Stop-Loss Strategy:
Strategy Type Placement
Conservative Below $0.073
Aggressive Below $0.080
Risk Management:
Use position sizing relative to account size (e.g., 1–3% risk per trade).
Adjust stop-loss dynamically if entering at breakout.
Combine with on-chain metrics or volume spikes for higher conviction.
SCENARIOS:
🔼 Bullish Scenario (Blue Up Arrow):
Breakout above wedge → retest → rally toward $0.105+
Break $0.105 confirms macro uptrend continuation
🔽 Bearish Scenario (Blue Down Arrow):
Rejection at wedge top → breakdown of $0.082 → revisit $0.073 support
Below $0.073 would invalidate short-term bullish structure
$UNI - $10 from here?Hi guys! 👋🏻
🔔I'll be trying this setup for Uniswap
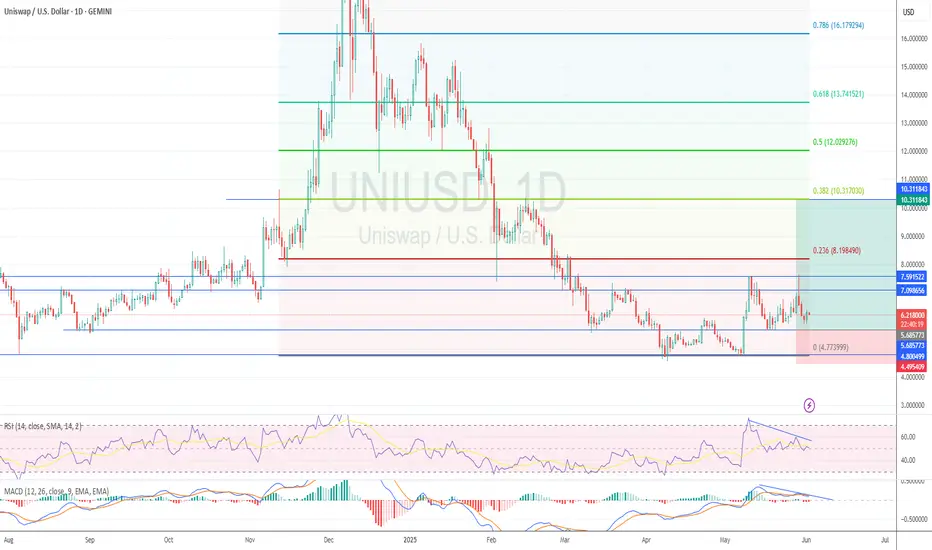
🔔 We have bounced from the strong support at $4.80, which we retested in April 25 and May 7 forming a pattern impersonating a double bottom
🔔 With the current chart pattern and levels, I'll be expecting a jump with a target on $10.
🔔 Might drop to $5.70 before another move upwards.
✊🏻 Good luck with your trades! ✊🏻
If you like the idea hit the 👍🏻 button, follow me for more ideas.
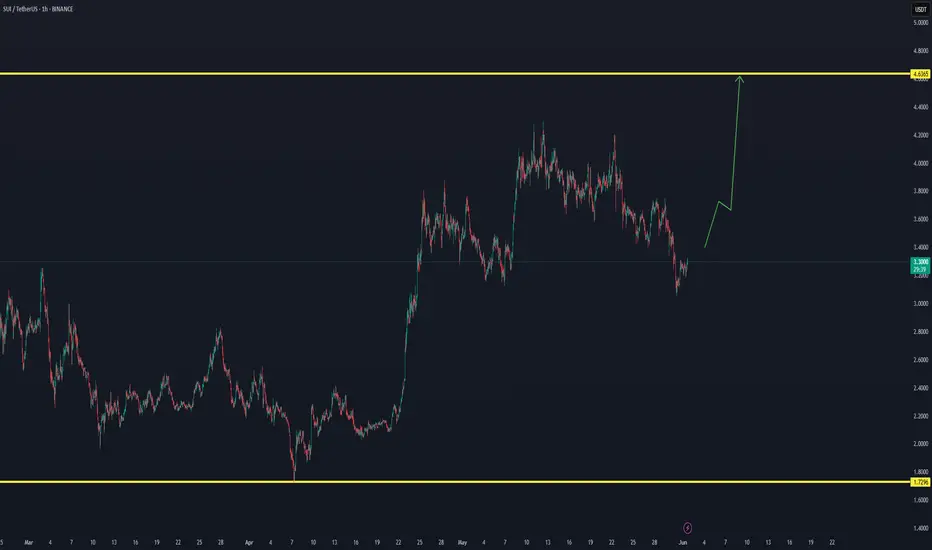
SUI NEW VOLUME UPCOMINGSUI shows on a low time frame new upcoming volume, which can allow SUI to break soon.
AAVE ANALYSIS🔮 #AAVE Analysis 💰💰
📊 #AAVE is making perfect and huge rounding bottom pattern in daily time frame, indicating a potential bullish move. If #AAVE retests little bit and breakout the pattern with high volume then we will get a bullish move📈
🔖 Current Price: $248
⏳ Target Price: $348
⁉️ What to do?
- We have marked crucial levels in the chart . We can trade according to the chart and make some profits. 🚀💸
#AAVE #Cryptocurrency #Pump #DYOR

is WLD READY FOR NEW CYCLE to $4Worldcoin looks to have new data, which could mean a new cycle is on processing.
Low time frame focus target $1,70

Kava : Day trade volumeKava can show new volume on day trade volume. We will follow this coin in the coming time frames for the uptrend.

SUIUSDT | Bullish Scenario Hello everyone.
Everything is clear in the video.
Summery
Order block zone: 3.3692-3.2294
SL: 3.2041
TP: 4.1961
I Share my ideas with you and the only thing you have to do is supporting.
Thanks.

Bitcoin is nearing a critical breakout zone at $86,000Bitcoin is nearing a critical breakout zone at $86,000.
If this level breaks with strong momentum, we could see a rapid bullish continuation toward the major resistance area around $105,000. The ascending channel remains intact, and aggressive buying near support points to a strong upside setup.
From a fundamental view, Bitcoin is gaining strength as global uncertainty rises. The latest escalation of trade tariffs has disrupted traditional markets, pushing more investors toward alternative assets like Bitcoin. Historically, Bitcoin has performed strongly during times of economic instability.
Tightening monetary policies worldwide are fueling recession fears, making Bitcoin even more attractive as a hedge — the new "digital gold." With institutional interest growing, Bitcoin is well-positioned for a significant capital inflow.
Stay ready — the next big move is close! 🚀

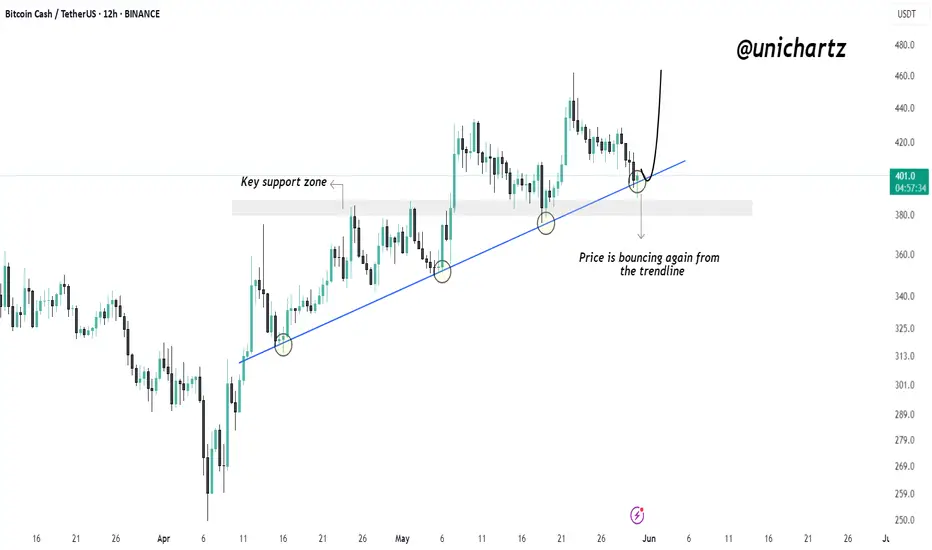
Bitcoin Cash Respects Trendline Again – Is Another Rally LoadingBitcoin Cash is showing strong trendline respect, with multiple successful bounces from the ascending support.
Price is once again bouncing off this trendline, signaling bullish intent. As long as this structure holds, the uptrend remains intact and a potential move toward higher levels looks likely.
Key support and trendline confluence continues to act as a launchpad.
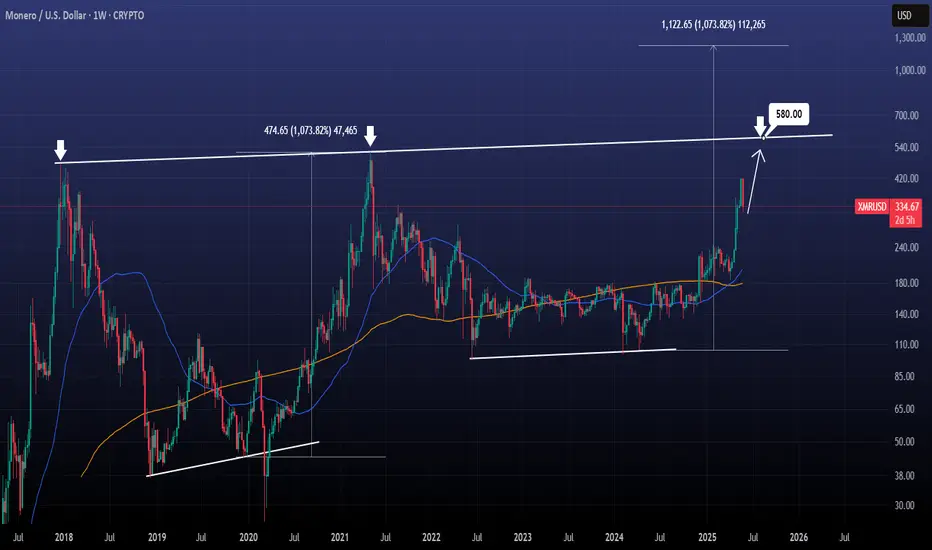
Will XMR tripple top?Monero / XMRUSD has been seeing amazing gains since the April 7th Low, despite this week's natural technical correction.
There is a massive Rising Resistance originating from the December 18th 2017 High that price also the 2021 Cycle Top, which poses as the next most probable target.
We expect to test it around 580.
If it breaks, it is not impossible to see the uptrend complete a +1000% rise from the bottom as it did in 2021.
Follow us, like the idea and leave a comment below!!
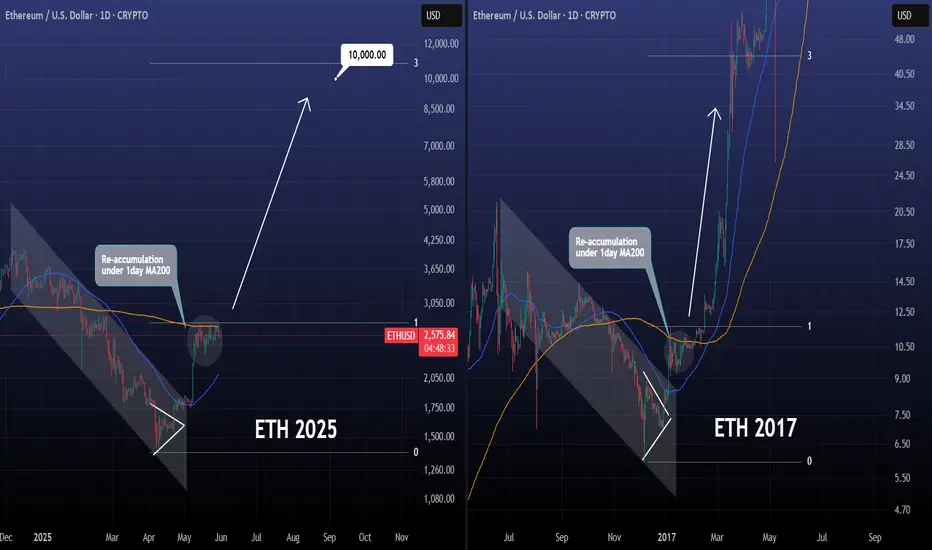
ETHEREUM can reach $10000 if 2017 is repeated.Ethereum / ETHUSD is consolidating under the 1day MA200 (resistance) and over the 1day MA50 (support).
The 2025 correction has been quite similar so far to 2016, both bearish Channels bottoming on a Triangle pattern and then rebounding.
In 2017 that rebound resulted in an insane rally above the 3.0 Fibonacci extension.
Even if the market doesn't rise this time this aggressively and that quickly, it can still approach the 3.0 Fib at 10000 and form the top for this Cycle.
Follow us, like the idea and leave a comment below!!
BTCUSD: Neutral on 1D means buy opportunity during rallies.Bitcoin has turned neutral on its 1D technical outlook (RSI = 51.351, MACD = 2908.600, ADX = 27.535) which is far from alarming as during Bull Cycle rallies such pullbacks are buy opportunities. Especially now that the price is even supported by the 1D MA50, which having cross above the 1D MA200 last week, they formed a Golden Cross. The pattern is identical to the last 1D Golden Cross, steady rally phases supported by HL trendlines that rose by roughly the same percentage. Their 1D RSI sequences also display similar formations. For that reason, we remain bullish on Bitcoin despite the current correction, targeting short term 119,000.
## If you like our free content follow our profile to get more daily ideas. ##
## Comments and likes are greatly appreciated. ##

TradeCityPro | Comprehensive Bitcoin Analysis for 2025👋 Welcome to TradeCityPro Channel!
Let's go for the most complete BINANCE:BTCUSDT Bitcoin analysis you can see. In this analysis, we are going to examine the data from monthly to weekly to daily time frames and more in the most complete way possible!
🌐 Monthly Timeframe
In the monthly timeframe, as you can see, Bitcoin is positioned between two curved trendlines and has reacted to these zones multiple times.
The last time the price hit the bottom of this channel, it recorded a low of 16,000, after which the crypto bull run began. The top of this channel also coincided with the 69,000 peak in the previous bull run, allowing us to identify the end of that bull run.
One key point about this channel is that the slope of its trendlines is decreasing, and overall, a weakening trend in Bitcoin is observed, which is logical. This is because every time Bitcoin has made an upward leg, a massive amount of capital has flowed into it, so it naturally moves less in the subsequent leg.
This point might seem negative to newer market participants, as Bitcoin’s bull runs used to happen faster in the past, and the price moved more significantly in percentage terms. For example, the 2017 bull run saw Bitcoin grow by nearly 7,000%, while in the 2019 bull run, it grew by about 1,500%.
However, within this seemingly negative point, there’s a positive aspect: this reduction in volatility indicates Bitcoin’s maturity and that of the broader crypto market. When an asset has a large amount of capital invested in it, its volatility naturally decreases, but this also reduces the risk of investing in that asset.
For instance, gold currently holds the top spot globally with a market cap of 21 trillion dollars, while Bitcoin’s market cap is around 2 trillion dollars. This gap makes Bitcoin appear as a better investment choice at first glance, as its lower market cap suggests greater growth potential.
On the other hand, the risk of investing in Bitcoin is higher because it has less capital invested in it, and large institutions like governments prefer to invest in gold, earning lower returns over time compared to Bitcoin. For these institutions, the most important factor is risk optimization, and gold has proven itself as the lowest-risk asset over centuries.
So, overall, we can conclude that the more capital flows into Bitcoin, the lower its volatility becomes. As volatility decreases, it becomes a safer asset for investment, attracting more interest from large institutions.
Additionally, we should consider that if Bitcoin isn’t destroyed or proven to be a scam, it could become a safe-haven asset like gold in the future. Its supply is well-optimized, and due to the halving mechanism, its issuance is tightly controlled, which gives it an inherently bullish nature like gold.
Note that when I say Bitcoin’s movements are slowing down and more capital inflow reduces its volatility, I don’t mean it will stop moving upward. Rather, it means its cycles will take longer, and its movements will be heavier. For example, gold, despite its high market cap, still moved upward last year.
Currently, Bitcoin has started a new upward leg after rising from the 16,000 zone. It first reached the previous high, then, after reacting to the 0.5 Fibonacci Extension level (which overlapped with the 71,000 zone), it pulled back to the 57,000 zone and has now moved to the 0.618 level near 101,000.
Based on the candles formed in the monthly timeframe, it seems the upward movement is ongoing. If the 0.618 level is broken, the price could see a few more bullish candles. The next Fibonacci level is 0.786, near 165,000, and if the price movement extends a bit longer, this level could also overlap with the top of the curved channel.
In my opinion, the maximum potential for Bitcoin in this bullish cycle is between 160,000 and 180,000. However, keep in mind that this is just my personal view, and I’m not making decisions based solely on this analysis or planning to sell if Bitcoin reaches this range. This is merely a mental target, and if I see Bitcoin reaching this range with strong bullish momentum, there’s a chance it could break through.
In that scenario, if Bitcoin reaches this range without any trend weakness and with high momentum, I’ll update the analysis for you and examine higher targets Bitcoin could reach.
On the other hand, if I see Bitcoin’s momentum weakening and showing trend deterioration before reaching the resistance zone, I’ll adjust my perspective. If the trend reversal triggers I’ll discuss later are activated, I’ll exit the market.
In the RSI oscillator, we have very important zones that can help us assess the trend’s health. A ceiling at 77.65 has formed, which, if reached by RSI, could indicate a momentum-based market top. However, if this level is broken, the bullish scenario I mentioned is highly likely to occur, and the price could move beyond our expected target.
On the other hand, there’s a support floor at 58.90, and I believe the confirmation of the end of Bitcoin’s bull run will come with a break of this level in RSI. If RSI consolidates below this zone, bullish momentum will weaken, and the price will gradually enter a corrective phase.
Regarding volume, I should note that the decreasing volume in this timeframe isn’t reliable data because Bitcoin’s volume is spread across various exchanges, and comparing volume at this scale isn’t accurate or useful.
I have nothing more to say about the monthly timeframe. Let’s move to lower timeframes.
📊 Weekly Timeframe
Let’s dive into the weekly timeframe, where we can observe price movements in greater detail.
As you can see, after being supported at the 16,000 zone, Bitcoin faced a significant resistance at 31,000. Breaking this level kicked off the bullish trend. In the first leg, the price moved from 16,000 to 31,000, and after breaking 31,000 in the second leg, the upward move continued to 72,000.
One of the main reasons for this bullish cycle was the U.S. interest rate. Simultaneously with the breakout of the 31,000 zone, the U.S. Federal Reserve changed its policies and began lowering interest rates. This triggered a massive capital inflow into Bitcoin, initiating its bullish move.
During the corrective phase, the price oscillated between the 72,000 and 55,000 zones for several months. After breaking the 72,000 ceiling, another bullish leg took the price to 105,000.
One of the reasons for this bullish move was Trump’s strong support for crypto during the U.S. election. He frequently mentioned Bitcoin positively in his speeches and considered it part of his policies.
However, after Trump was elected president, he didn’t fully deliver on his promises. The imposition of tariffs not only impacted Bitcoin but also significantly affected the U.S. dollar, major company stocks, and indices like the S&P. As a result, Bitcoin dropped back to near the 72,000 zone.
Additionally, for the past few months, the U.S. Federal Reserve has not changed interest rates due to these tariffs. In all its statements, it has indicated that it’s waiting for the tariffs to be finalized and is in no rush to make decisions regarding monetary policy. Thus, in recent months, the interest rate variable has been effectively neutral, with the most significant fundamental news being the U.S. tariffs against China and Europe.
After Bitcoin’s drop to near 72,000, news of a 90-day agreement between China and the U.S. emerged, stating that tariffs would be lifted for 90 days to allow negotiations. This news was enough to restart the bullish move for Bitcoin and stocks like the S&P. As you can see, Bitcoin has now surpassed the 105,000 ceiling and is currently deciding its next move above this zone.
Looking at RSI, there’s a key support level at 44.75, where every time the price has hit this level, a new bullish leg has started. This level accurately indicated the 55,000 and 72,000 bottoms and has been very reliable.
However, there’s a clear divergence in RSI between the 72,000 and 105,000 peaks. The current peak above 105,000 is higher, but RSI is still forming lower highs, which could strengthen the divergence.
Currently, RSI is near the overbought zone and appears to be rejecting from the 70 level. If RSI is rejected from this zone, the price might fake out the 105,000 breakout and drop below it. If this happens, it would signal a significant trend weakness, greatly increasing the likelihood of a trend reversal.
However, if RSI consolidates above the 70 level and the price makes another bullish leg, we’ll still have divergence, but the trend weakness will be much less severe than in the fake-out scenario. If the price makes another bullish leg, our targets based on Fibonacci are the 130,000 and 160,000 zones.
In any case, if RSI forms a lower high compared to its previous peak and the price enters a corrective phase, I believe the 44.75 level will break, activating the divergence. If this happens, we’ll get a momentum-based confirmation of the bull run’s end, and we’ll then need to wait for a price-based confirmation.
Currently, the price confirmation for a trend reversal would first be a fake-out of the 105,000 breakout, with the main trigger being a break of the 72,000 level. If the price forms a higher high, we’ll need to wait and identify the trend reversal trigger based on market structure and conditions.
Personally, I believe Bitcoin will have another bullish move to the 130,000 zone, and simultaneously, dominance will move upward again. After this move, as Bitcoin consolidates or corrects, dominance will drop, leading to an altcoin season for a few months. After Bitcoin’s consolidation and the end of the altcoin season, the market’s bearish phase will begin, which I’ll discuss further if it occurs.
If you’ve bought Bitcoin at lower levels and are holding, I think you can continue holding, as there’s a high chance of another bullish leg, and we don’t yet have any confirmation of a trend reversal. I suggest continuing to hold until we get a clear reversal signal.
For buying Bitcoin on the spot market in this timeframe, it’s not possible to provide a trigger right now, as we’re at the end of a bullish leg, and the upward trend from 16,000 has been very prolonged. I believe we’ll see at most one more bullish leg, so if you’re skilled at trading, I suggest using this capital to open positions in futures to maximize profits.
Be cautious—I’m saying this only if you have trading skills, not to blindly open positions with all your capital without a trigger. That would only lead to losses.
If you haven’t bought any Bitcoin in this bullish trend yet, you can wait for the potential altcoin season. I suggest starting now to identify good projects so that when Bitcoin dominance shows bearish confirmation, you can buy the altcoins you’ve researched and profit from that market phase.
📈 Daily Timeframe
In the daily timeframe, as you can see, Bitcoin underwent a corrective phase, dropping to the 76,000 zone. After forming a base at this level, a bullish leg to 106,000 was triggered at 87,700.
Currently, the price is above the 106,000 zone but hasn’t consolidated above it yet. The reason I say it hasn’t consolidated is that market volume is decreasing after the breakout. Additionally, when the price breaks through a supply zone like an all-time high, significant momentum is required, but that hasn’t happened, and the price is ranging above this zone without significant movement.
If Bitcoin consolidates above this zone, the bullish move could continue. The targets we can consider are the 116,000 and 130,000 zones.
The RSI oscillator has a critical support at 59.78, which is a very important momentum level. If this level is broken, this bullish leg could end, and the market might enter a corrective phase. Volume is also slightly decreasing and showing some divergence with the trend, which is another sign of trend weakness.
If the price consolidates below 106,000, we’ll get confirmation of a fake-out of this breakout, and the price could move downward again. The lower support zones are 102,600 and 92,300.
If the price forms a lower high and low below 106,000, we can confirm a trend reversal. Breaking the 76,000 level would be the main confirmation of a trend change.
💼 4-Hour Timeframe
In the 4-hour timeframe, Bitcoin entered a corrective phase after reaching the 111,700 zone and has formed a descending triangle between the 106,000–107,000 range and a downward trendline.
The 106,000–107,000 range is a very strong support zone, and the price has tested this level multiple times but keeps forming lower highs compared to 111,700, increasing the likelihood of breaking this support zone.
On RSI, there’s a support level at 35.94, which is a very strong momentum zone. Breaking this level could confirm the entry of bearish momentum, increasing the likelihood of breaking the support zone.
With a break of the support zone and the 35.94 level in RSI, we can enter a short position. If the price forms a lower high and low below this support zone, we can confirm a trend reversal. The next key support zones are 101,600 and 93,700.
For the bullish trend to continue, breaking the downward trendline would confirm an upward move. If the trendline is broken, the price could rise to 111,700. Breaking the 111,700 level would be the main confirmation of the bullish trend’s continuation, activating the trendline breakout as the primary trigger.
🔍 Binance Open Interest is Surging as BTC Regains Bullish Momentum
Tracking what’s happening in the derivatives market has become essential, given the current market structure.
Derivatives volumes are significantly higher than those on spot markets or ETFs, especially on Binance, which ranks just behind the Chicago Mercantile Exchange in terms of volume.
As a result, derivatives activity can have a major impact on Bitcoin’s price, making on-chain data related to derivatives extremely valuable to monitor.
This has clearly been the case since BTC resumed its bullish trend, reflected in the rising Open Interest on Binance. It jumped from $7.5B on April 8th to over $11.2B today. We can also note that the 30-day and 50-day SMAs have just crossed back above the 100-day average. Derivatives activity has clearly helped fuel the price move, even though many short positions were opened along the way.
Seeing Open Interest climb is generally a good sign, as it gives the market momentum and can lead to strong upward moves. However, this kind of push tends to be fragile.
At the moment, we haven’t yet returned to a new Open Interest ATH on Binance, which may suggest that we’re not in a full-blown euphoric phase on derivatives markets just yet.
📊 Minimal Sell Pressure Despite STH & LTH Deposits on Binance
Keeping an eye on STH (Short-Term Holders) and LTH (Long-Term Holders) behavior gives us valuable clues about market sentiment.
In this update, we’re focusing on Bitcoin inflows to Binance from both STHs and LTHs. These flows help us measure selling pressure and get a feel for how price action might unfold.
Let’s start with STHs the group that tends to react quickly and emotionally to market shifts.
🧠 We’ve seen their behavior play out clearly in the past:
During the August 2024 correction, they sent over 12,000 BTC to Binance.
Then again, around late February to early March, during the tariff news-driven panic that pushed BTC below $80K, they dumped over 14,000 BTC.
But here’s the good news: right now, STH inflows are still moderate only about 8,000 BTC has been sent to Binance so far, which is roughly in line with the last correction.
🔍 As for LTHs, the numbers are even calmer.
Currently, just 86 BTC has flowed in from long-term holders—far lower than the 254 BTC seen before the last major top and way below the 626 BTC peak back in 2024.
📊 Bottom line?
Whether we’re looking at STHs or LTHs, there’s no real sign of strong selling pressure at the moment. Still, it’s worth watching in the context of ongoing demand—which remains relatively healthy for now.
Coinbase Premium Signals Strong Institutional Demand
There’s no doubt institutions are stepping in and no, it’s not just because of ETFs.
💡 Why not ETFs?
Because spot Bitcoin ETFs aren’t exclusive to institutions. Retail investors can access them just as easily, and in terms of raw volume, ETFs still don’t come close to the spot or futures markets.
That said, the inflows are still impressive: the 30-day average daily inflow is now over $330 million, and that trend is holding strong.
🚀 The Real Signal? The Coinbase Premium Gap
This metric tracks the price difference between Coinbase Pro (favored by U.S. professional/institutional investors) and Binance. Right now, the 30-day moving average of the premium gap is 55 a clear sign of heightened U.S. investor activity, which strongly points to institutional participation.
💰 Futures Activity Surges as Spot Demand Fades on Binance
Futures volume on Binance has been rising, while spot volume has dropped significantly in recent days even as Bitcoin broke into price discovery. This shift in volume composition is worth watching closely, as it provides important clues about the market’s internal strength.
Volume isn’t just a number—it reflects the type of demand driving the market. When demand comes from spot markets, it often suggests long-term conviction. In contrast, demand driven by futures markets tends to reflect short-term speculation, which can introduce instability.
Since May 5, we’ve seen futures activity increase modestly, while spot volumes have clearly declined. This suggests that the current price action may be fueled more by leverage and short-term bets than by solid, long-term buying.
Without strong spot support, trends powered by derivatives are more fragile and prone to sharp reversals. This environment calls for increased caution, especially for those considering new entries or leveraged positions.
⚡️ BTC Gains Bullish Momentum as Binance Open Interest Rises
Tracking what’s happening in the derivatives market has become essential, given the current market structure.
Derivatives volumes are significantly higher than those on spot markets or ETFs, especially on Binance, which ranks just behind the Chicago Mercantile Exchange in terms of volume.
As a result, derivatives activity can have a major impact on Bitcoin’s price, making on-chain data related to derivatives extremely valuable to monitor.
This has clearly been the case since BTC resumed its bullish trend, reflected in the rising Open Interest on Binance. It jumped from $7.5B on April 8th to over $11.2B today. We can also note that the 30-day and 50-day SMAs have just crossed back above the 100-day average. Derivatives activity has clearly helped fuel the price move, even though many short positions were opened along the way.
Seeing Open Interest climb is generally a good sign, as it gives the market momentum and can lead to strong upward moves. However, this kind of push tends to be fragile.
At the moment, we haven’t yet returned to a new Open Interest ATH on Binance, which may suggest that we’re not in a full-blown euphoric phase on derivatives markets just yet.
🔄 Bitcoin Heatmap Analysis
Let’s move on to the Bitcoin heatmap analysis, which was missing from this analysis and completes the most comprehensive data for these days. I hope it’s useful for you.
In the 6-month timeframe, Bitcoin has had a good upward trend but experienced a rejection after hitting orders in the 110,000–113,000 range. It’s currently in the 104,000 zone, with the most important support zone at 92,000, which is likely to hold.
In the monthly timeframe, we’ve broken through the 106,000 zone, which was a strong support level based on orders, but there isn’t a strong support zone immediately below. The next support level is 100,000–102,000, which could be a solid level, while the 110,000–112,000 zone is currently the most valid resistance level for Bitcoin.
In the weekly timeframe, a similar event has occurred. We’ve been rejected from the significant 110,000 resistance zone and are heading for further downside, but at a slow pace. In this timeframe, no specific support orders have been registered yet, and it will take some time for traders to place their buy orders on exchanges. However, even if we bounce from this level, we shouldn’t underestimate the 110,000 resistance.
📝 Final Thoughts
This is the most comprehensive Bitcoin analysis for the community.
We’ve done our best to collect the data comprehensively in this post for your awareness and present it to you in this analysis, hoping it has been useful for you!
Our team has worked on this analysis for several days, so we’d be thrilled if you boost, comment, and share the analysis with your friends.

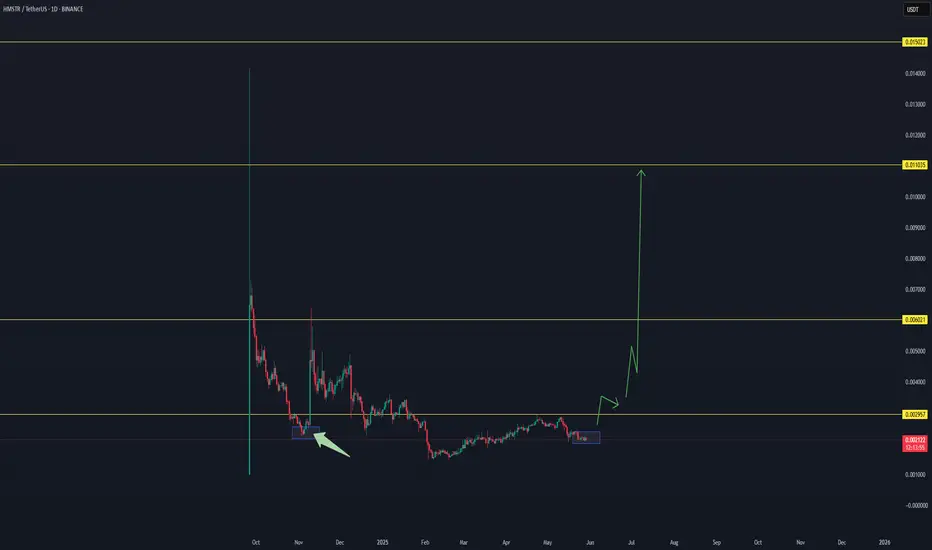
HAMSTER CAN EXPLODE TO THE MOON AS NEVER BEFORE..Depending on our study and trends, we expect with high chance that hamster is going to see a new volume in the upcoming time, which will allow this coin to increase to new levels.
These are our expected targets.
$0,0.0024
$0,006
$0,011
$0,015
This coin is at this moment in a stable time frame, and can build unexpectedly in the coming time a new break followed by a whale's increase in volume.
Time will tell if this coin will act as we expect.
There are some important reasons based on data that let us expect this coin is going to break, at last its a market, which has never 100% guarantee.
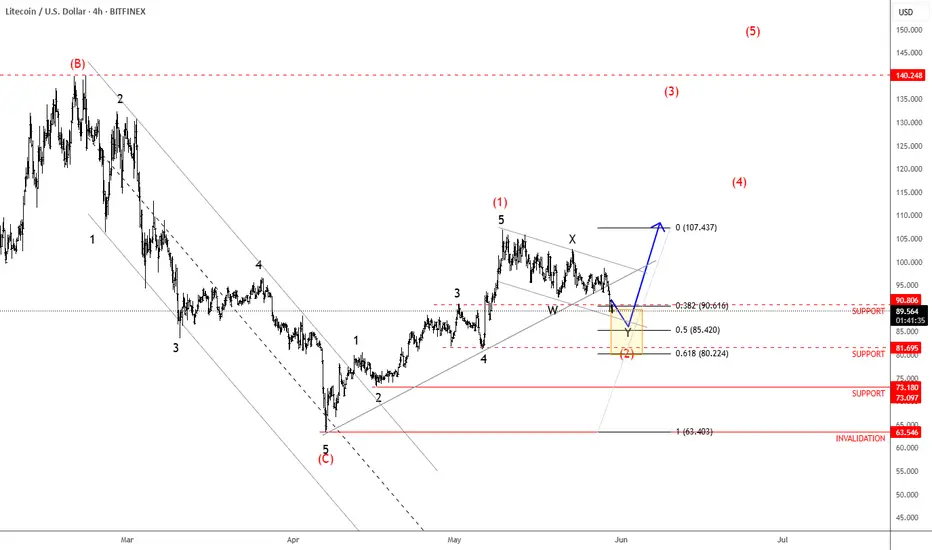
Litecoin Is Forming A Bullish PatternLitecoin with ticker LTCUSD made nice and clean five-wave recovery back to 100 area in the 4-hour chart, which confirms support in place and bullish reversal, so it can be a higher degree wave (1), thus more upside is expected for a higher degree wave (3) after current complex W-X-Y correction in wave (2) that can be in final stages. First support is here around 90-85 area, while second deeper one would be at 80 area.
BITCOIN targets 165k based on VIX's 10-year SupportBitcoin (BTCUSD) has started a new (and possibly last for this Cycle) Bullish Leg following April's bottom and has already made a new All Time High (ATH).
The BTC/VIX ratio on that very same day (April 07 2025) hit and rebounded on its 10-year Higher Lows trend-line, a Support level that has been holding since the August 24 2015 market bottom.
Every rebound on this Higher Lows trend-line, has produced a strong medium-term rally, the 'weakest' of which has been the most recent (August - December 2024), which rose by +121.44%. If BTC repeats this 'minimum', we are looking at a $165000 High, which aligns perfectly with the majority of projections for this Cycle's Top.
Do you think we will see that price by October? Feel free to let us know in the comments section below!
-------------------------------------------------------------------------------
** Please LIKE 👍, FOLLOW ✅, SHARE 🙌 and COMMENT ✍ if you enjoy this idea! Also share your ideas and charts in the comments section below! This is best way to keep it relevant, support us, keep the content here free and allow the idea to reach as many people as possible. **
-------------------------------------------------------------------------------
💸💸💸💸💸💸
👇 👇 👇 👇 👇 👇

Ethereum @ 20M MAEthereum on monthly time frame has reached to the 20MA & the 61% of Fibonacci. Because of April hammer candle & May 50% raise candle, we might see June close above $3200 and a rally after that to about $8000.

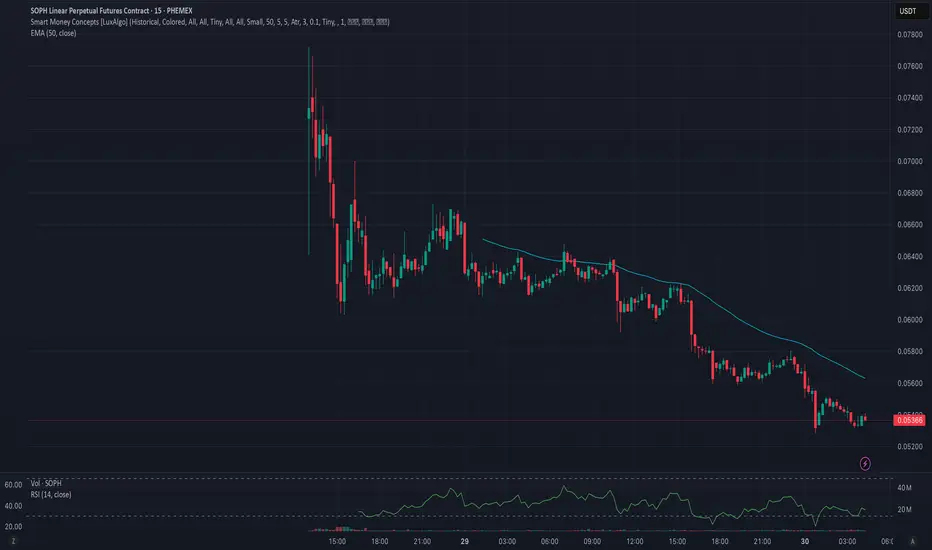
Phemex Analysis #85: Is it Time to Enter SOPHON (SOPH)?!SOPHON ( PHEMEX:SOPHUSDT.P ), a rising project in the cryptocurrency space, has recently attracted traders' attention with its dynamic price action and notable volatility. Currently trading around $0.055, SOPH experienced a bearish move after failing to maintain earlier gains above $0.065. As the price now hovers near crucial short-term support levels, traders are evaluating whether this dip presents a buying opportunity or signals further downward pressure. Let’s explore several potential scenarios based on SOPH’s 15-minute chart to determine if now is the ideal moment to enter the market.
Possible Scenarios (15-minute chart)
1. Double Bottom at $0.05 with RSI Divergence (Bullish Reversal)
A closer examination of SOPH's 15-minute chart reveals the potential formation of a double bottom near the $0.05 level, accompanied by RSI divergence. Specifically, the RSI is showing higher lows while the price revisits its previous low, signaling diminishing selling pressure and a likely bullish reversal.
Pro Tips:
Long-term Accumulation: Consider gradually accumulating SOPH near the $0.05 support if bullish divergence persists.
Confirmation: Wait for price stabilization and rising volume near the support level to confirm the reversal before scaling in.
2. Breakout Above $0.058 (Bullish Confirmation)
If SOPH decisively breaks the immediate resistance level at $0.058, especially accompanied by high trading volume, it could mark a strong bullish signal. However, after the breakout, a minor retracement could form a classic "cup and handle" pattern—historically a robust bullish setup—prior to resuming its upward trajectory.
Pro Tips:
Long Entry: Go long upon confirmed breakout above $0.058.
Pattern Recognition: If a cup and handle pattern forms after the breakout, look to add positions on the subsequent confirmation, preparing for potentially significant upward movement.
3. Bearish Continuation (Cautionary Scenario)
On the downside, if SOPH falls below the critical support at $0.0528 accompanied by higher-than-average trading volume, it indicates the bearish momentum might persist. Such a breakdown could lead to further declines and test deeper support zones.
Pro Tips:
Risk Management: Avoid entering new long positions if this bearish scenario plays out.
Market Observation: Remain on the sidelines, observing until clear bullish reversal signals or price stabilization at a lower support level appear.
Conclusion
SOPHON (SOPH) currently sits at a crucial juncture, offering potential opportunities depending on how price action unfolds in the short term. Traders should closely watch for bullish divergence signals around $0.05, breakout confirmations above $0.058, or bearish continuation below $0.0528. Employ disciplined risk management, and remain adaptable to market dynamics to confidently and strategically trade SOPHON (SOPH).
Tips:
Elevate Your Trading Game with Phemex. Experience unparalleled flexibility with features like multiple watchlists, basket orders, and real-time adjustments to strategy orders. Our USDT-based scaled orders give you precise control over your risk, while iceberg orders provide stealthy execution.
Disclaimer: This is NOT financial or investment advice. Please conduct your own research (DYOR). Phemex is not responsible, directly or indirectly, for any damage or loss incurred or claimed to be caused by or in association with the use of or reliance on any content, goods, or services mentioned in this article.