What’s Your Bullish Price Target for ETH?
Ethereum has been trailing behind some of the alts in the top 100 and even BTC when it comes to parabolic runs. However, I’ve been analyzing the charts, and things are starting to look VERY interesting. Here’s my take:
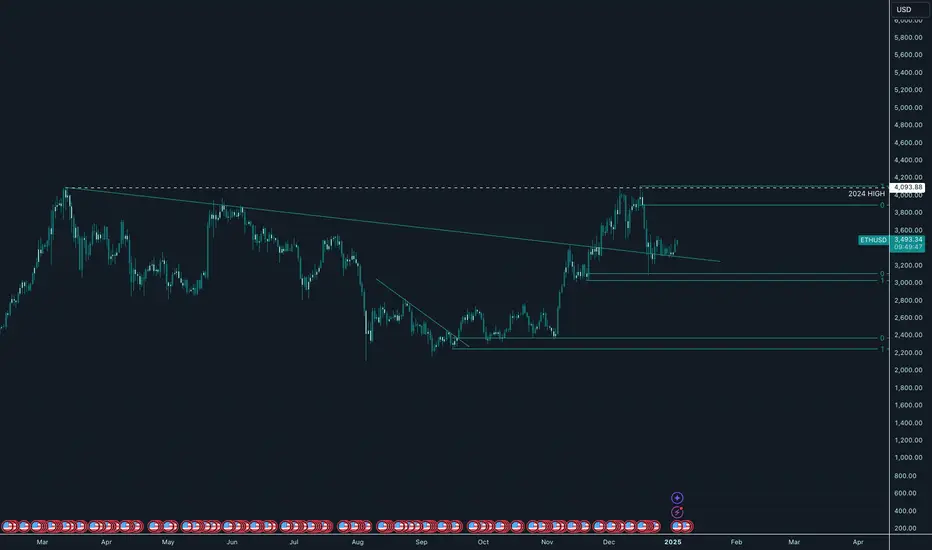
- On the **3-day chart**, I see a strong **resistance level around $3,830**.
- Using a **Fibonacci extension**, the **1.6 level targets just over $5,000**—a number that feels astronomical but achievable in a bullish scenario. 📈
- The **daily MACD** is screaming **LONG**, indicating potential upward momentum.
### **Positive ETH Data to Back It Up**
Ethereum's fundamentals are stronger than ever:
1. **Total Value Locked (TVL):** Ethereum continues to dominate DeFi, holding **58%+ of all DeFi TVL** at ~$24B.
2. **24H Trading Volume:** Ethereum sees an average of **$6-8B traded daily**, showing its massive liquidity and adoption.
3. **Burn Mechanism:** Since the London Hard Fork (EIP-1559), over **3.9M ETH (~$6.3B)** has been burned, contributing to its deflationary narrative.
4. **Staked ETH:** With **32M ETH staked**, nearly **26% of the supply** is locked up, reducing selling pressure.
### **What's Driving the Bullish Sentiment?**
Recent activity in the **layer-2 ecosystems** is fueling optimism:
- **Optimism (OP)** and **Arbitrum (ARB):** Both L2s have seen substantial adoption, with millions of dollars in daily transactions and climbing TVL.
- **Lido Finance (LDO):** The largest liquid staking protocol continues to thrive, with **~30% of all staked ETH** on its platform.
These projects are growing **on Ethereum**, reinforcing the network’s pivotal role in the crypto ecosystem.
---
What’s your price target for ETH in a bull run? Do you see $5,000 as achievable, or do you have even higher targets in mind? Let's discuss!
Cryptocurrency
TradeCityPro | ZIL: Charting the Peaks and Troughs of Zilliqa👋 Welcome to TradeCityPro!
In this analysis, I will examine the ZIL coin, which is part of the Zilliqa project. This analysis will cover both the daily and 4-hour timeframes.
📅 Daily Timeframe: Ready for the Next Wave
In this timeframe, we are observing a very large range box that is more noticeable in higher timeframes, but as you can see, the ceiling of this box is at $0.03592 and the floor is at $0.01235.
🔍 In the floor area of this box, we witnessed an Accumulation Zone. After breaking $0.01797, a new upward trend phase began, and the price moved up to the ceiling at $0.03592 and is currently in a corrective phase.
🧩 So far, the price has corrected to the 0.618 Fibonacci level, reaching $0.02010, and has tested this area twice, appearing to be forming a bottom there. A short-term resistance formed above this area coincides with the 0.382 Fibonacci level at $0.02475.
🔽 If the correction continues, the next supports are $0.01797 and the 0.786 Fibonacci area, which are significant levels. The ultimate support price is $0.01235, which was the previous price floor. Breaking this area could trigger a new downward wave, potentially moving the price towards $0.00893.
📈 Conversely, if the price can stabilize above the 0.382 and 0.236 Fibonacci levels, there's a chance it could retest the resistance at $0.03592. This resistance is more like a supply zone from $0.03592 to $0.04064, and the price needs to stabilize above $0.04064 to confirm breaking this area. If this resistance is broken, the next resistance will be at $0.05728.
📊 The market volume has been decreasing during the correction, aligning volume with the bullish trend. Stabilizing the RSI above 50 also increases the probability of a bullish scenario.
⏳ 4-Hour Timeframe: Range Box and Futures Triggers
In this timeframe, we see a range box from $0.02010 to $0.02343, with the price currently at the box's ceiling. The box ceiling and the 0.382 Fibonacci level are close to each other and could form a strong consolidated area together.
🔼 For a long position, breaking $0.2343 is suitable, but be mindful of the 0.382 Fibonacci level so you can make the right decision when the price reaches this area. The next resistance levels will be at $0.02896 and $0.03592. Entry of the RSI into Overbuy would be a good confirmation for breaking the resistance at $0.2343.
📉 For a short position, the best current trigger is $0.02010. Breaking this area would breach a strong Potential Reversal Zone (PRZ), and the price could initially move down to $0.01797 and then to $0.01610.
📝 Final Thoughts
This analysis reflects our opinions and is not financial advice.
Share your thoughts in the comments, and don’t forget to share this analysis with your friends! ❤️

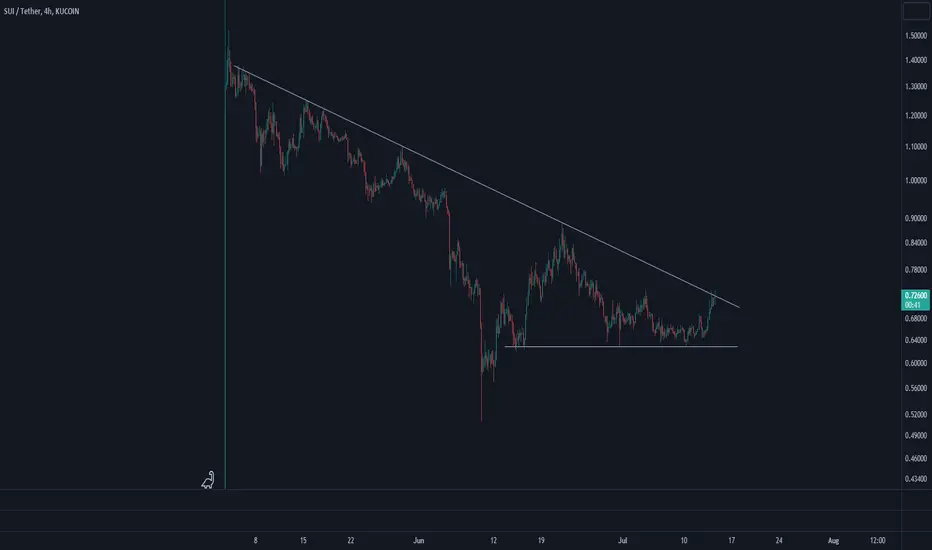
SuiSui, one of the most highly anticipated projects, is a Layer-1 blockchain and smart contract platform that is fast, private, secure, and accessible to everyone. Anyway, it is clear there is a downtrend line, and SUI is trying to break it upward. Let's see what happens.
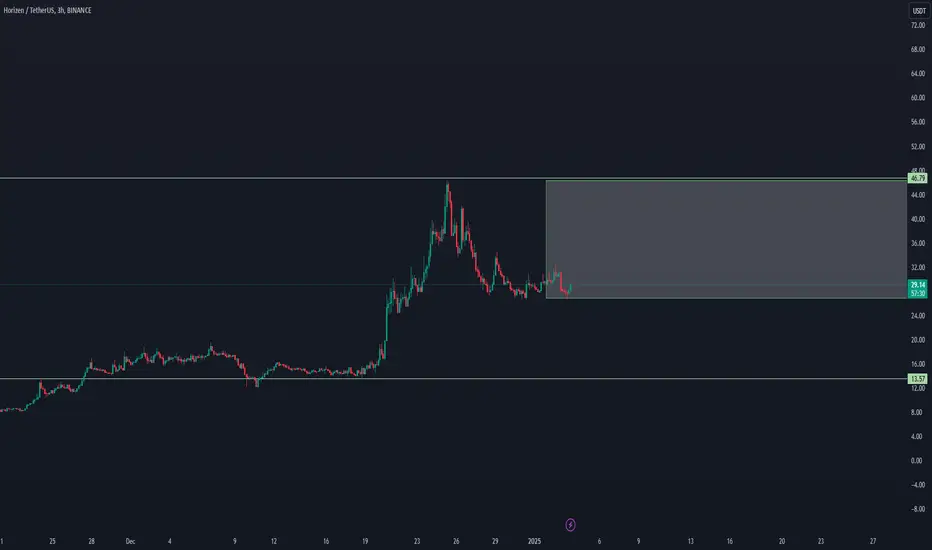
TradeCityPro | ETCUSDT Still Ranging in the Box!👋 Welcome to TradeCityPro Channel!
Let’s analyze Ethereum Classic during the market's holiday period, where we saw some movement. We’ll review the triggers together.
🌐 Overview Bitcoin
Before diving into today’s altcoin analysis, as usual, let’s check Bitcoin in the 1-hour timeframe. Bitcoin is still under a descending trendline. Once this is broken, it can move toward 98599, and after that, to 99443. It’s better to open or maintain positions after breaking 99443, as volatility is expected to increase at higher levels.
Whether I open a long position after breaking the trendline or resistance at 98599 depends on Bitcoin dominance. If Bitcoin dominance shows a red candle at the time of the breakout, I’ll focus on altcoins or BTC pairs. If it’s green, I’ll prefer Bitcoin itself. This could lead to another wave movement.
📊 Weekly Timeframe
It feels like we’re analyzing forex charts—completely ranging! This is normal given Ethereum Classic’s mining-related dynamics and the heavy movements associated with it.
For around 1100 days, this coin has been ranging within a large 130% box. Without a proper trigger, investing in this range might have tied up your capital, especially when other projects provided much higher returns over the same period. This highlights the risk of entering the market without a trigger.
If you’re holding ETC and want to set a stop-loss, you can exit if a weekly candle closes below 14.68.
For re-entry, the box top trigger at 36.58 is an excellent option. Since ETC is rebounding from the box’s midline, the likelihood of breaking the top is higher. The 24.78 support level can serve as a suitable stop-loss for box breakout attempts.
📈 Daily Timeframe
ETC has been performing well since breaking the daily box top at 20.92. It moved from the box’s bottom to its top, emphasizing the 38.24 resistance even further.
The $25 level currently serves as the most crucial support, coinciding with the weekly box’s midline. Staying above $25 indicates a higher low and a rebound from the channel’s midline, reflecting stronger buyer activity. This could lead to testing 38.24 again and possibly breaking it.
If you bought after the 20.92 breakout, your stop-loss should be below 17.55, with some profits already secured. If you haven’t acted yet and if resistance at 28.49—better yet, 30.20—causes a rejection and forms a lower high, consider exiting below $25 and look for new triggers later.
For re-entry, breaking 28.49 is a potential entry point, but your main entry should be after breaking 38.24, with momentum and increased volume supporting it.
⏱ 4-Hour Timeframe
ETC belongs to the group of coins that didn’t break their 4-hour resistance and box top yesterday, possibly setting up futures positions next week.
📈 Long Position Trigger
The rejection from 28.49 clearly defines the trigger. Open a long position after breaking this resistance or after the RSI breaks 72.58.
📉 Short Position Trigger
The main trigger at 24.92 is quite distant. However, if the 28.49 resistance turns out to be a fake breakout, you can use the fake breakout strategy. Look for the first trigger in lower timeframes to open a short position.
📝 Final Thoughts
Stay calm, trade wisely, and let's capture the market's best opportunities!
This analysis reflects our opinions and is not financial advice.
Share your thoughts in the comments, and don’t forget to share this analysis with your friends! ❤️

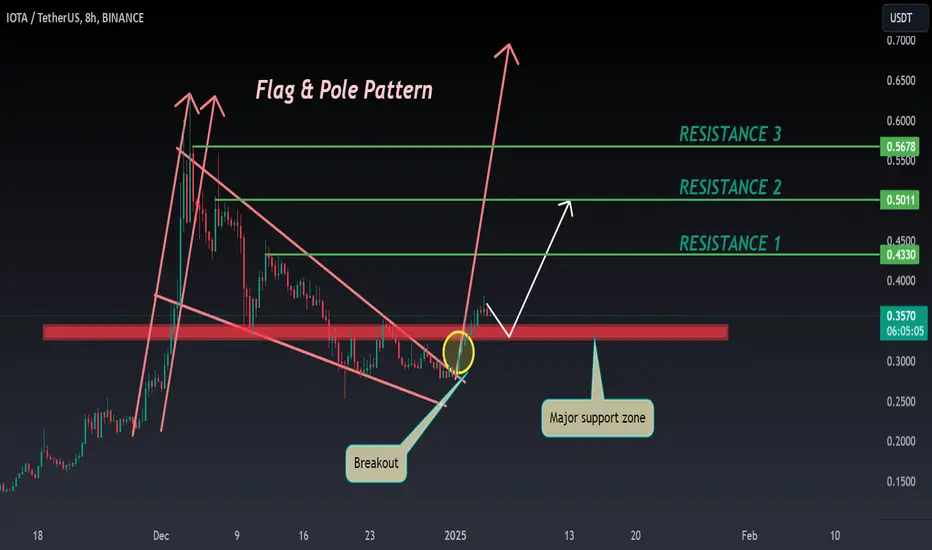
IOTA ANALYSIS🌸#IOTA Analysis : Bullish Trend 🚀🚀
🚀As we can see that there is a formation of Flag & Pole Pattern in #IOTA in 8 hr time frame. Right now #IOTA is trading above it's crucial support zone and we can see a bounce back from its support zone 💪
🔖 Current Price: $0.3569
⏳ Target Price: $0.4330
⁉️ What to do?
- We can trade according to the #IOTA chart and make some profits. Keep your eyes on chart price action, observe trading volume. Always observe market sentiments and update yourself everyday.🔰🔰
🏷Remember, the crypto market is dynamic in nature and changes rapidly, so always use stop loss and take proper knowledge before investments.
#IOTA #Cryptocurrency #Breakout #TechnicalAnalysis #DYOR
TradeCityPro | OM: Upward Momentum and Airdrop Anticipation👋 Welcome to TradeCityPro!
In this analysis, I will examine the OM coin, which is associated with the MANTRA network. This coin is about to start its airdrop rounds in a few days.
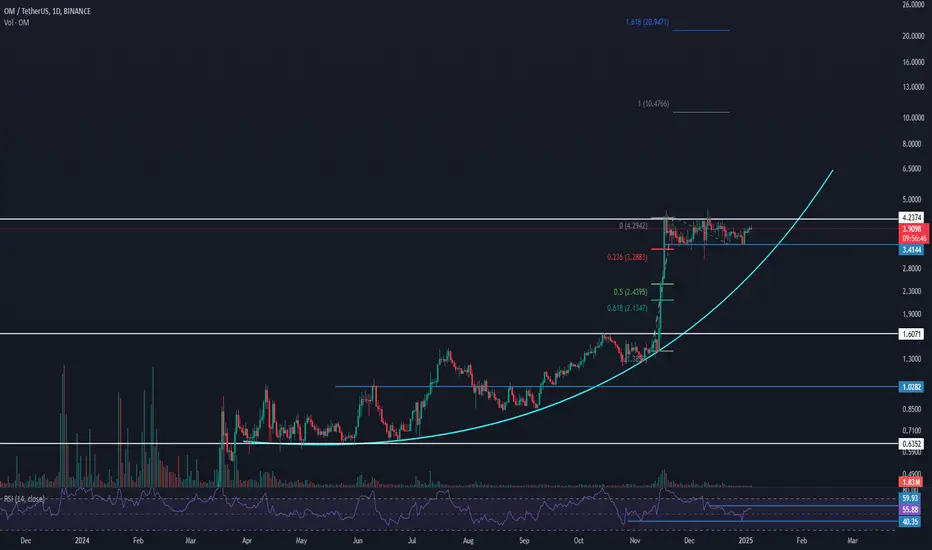
📅 Daily Timeframe: High Upward Momentum and Readiness for the Next Leg In the daily timeframe, we are observing a very strong and powerful upward trend. Over the past year, this coin has grown more than 5000% and has garnered significant attention from the crypto community and enthusiasts.
🔍 Currently, a curved upward trend line has emerged in the latest cycle, starting after the price bottomed out at $0.6352 and corrected to $1.6071 before starting a new upward move reaching $4.2374.
✨ The price has touched this upward trend line several times and now, having reached the resistance at $4.2374, has formed a ranging box between this resistance and $3.4144, potentially undergoing reaccumulation. Breaking above $4.2374 could significantly impact the further price increase of this coin.
🚀 If the ceiling breaks, the next price targets based on Fibonacci would be around $10 and $20, technically feasible as the price has not corrected significantly and has maintained market momentum. However, reaching a $20 target would require OM to enter the top 10 market cap, surpassing cryptocurrencies like AVAX, SUI, and TON, which is a challenging task.
🧩 The RSI oscillator is ranging between 40.35 to 59.93, and breaking either of these areas will significantly impact the market trend. A break below 40.35 could increase the likelihood of a correction down to the $2 area, around the 0.5 and 0.618 Fibonacci levels. Breaking above 59.93 would increase the likelihood of surpassing $4.2374.
⏳ 4-Hour Timeframe: Futures Triggers In this timeframe, we see a long-term 47-day box, which is very clean and has well-defined ceilings and floors between $3.4144 and $4.3140. Breaking either of these areas would provide a good position.
📉 For a short position, breaking $3.1440 is suitable with the next supports at $2.5442 and $2.2264, near the 0.5 and 0.618 Fibonacci levels of the daily timeframe.
📈 For a long position, breaking $4.3140 is the only long trigger for now, and no target can be set for this movement until a new structure is formed.
🔑 The market volume is nearing its lowest point, increasing the likelihood of breaking one of these areas each day.
📝 Final Thoughts
This analysis reflects our opinions and is not financial advice.
Share your thoughts in the comments, and don’t forget to share this analysis with your friends! ❤️
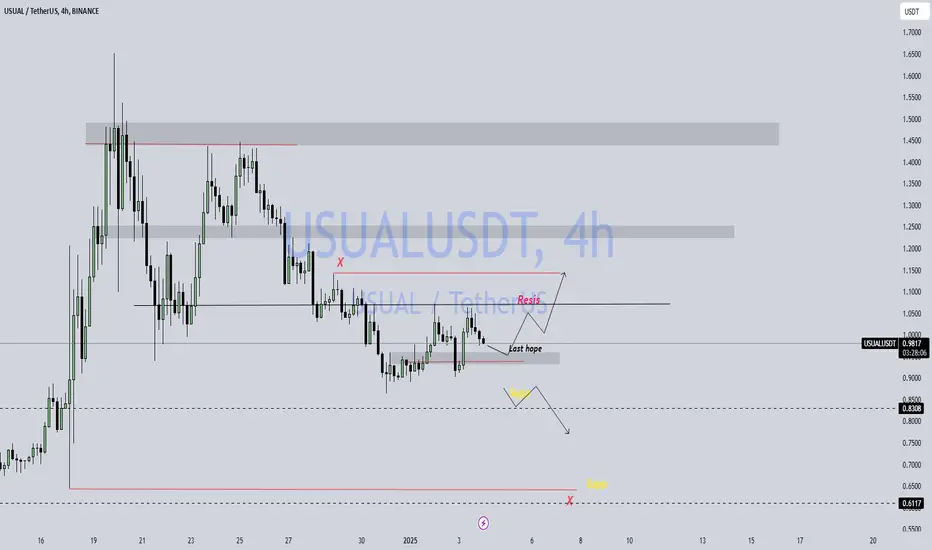
Usual/UsdtBINANCE:USUALUSDT
Right now, the price of the asset is at **0.9789** 📊. This is a crucial level because if the price starts to fall and can’t maintain its position above **0.900** 🚨, this would signal a potential downturn. **0.900** is considered the "last hope" support level for this price action—if the price drops below that, things could get tricky.
If the price falls below **0.900**, the next level of support to watch for is **0.8308** 📉. Support is where the price tends to find buying interest, so if it reaches this point, there might be a chance for it to bounce back up. However, if it breaks through this, further downward movement could be expected.
On the flip side, if the price holds and continues to rise, it will face resistance levels that could prevent it from moving higher. These resistance levels are key price points where sellers might step in to take profits, or where the price could struggle to break through. In this case, the resistance levels are:
- **1.00** 🔴: This is a round number, which tends to be a psychological resistance point.
- **1.1544** 🔴: A higher level, possibly linked to previous market highs.
- **1.253** 🔴: Another key resistance, which could be a tough barrier for the price to pass.
- **1.432** 🔴: The highest resistance level to watch; if it breaks through here, it could signal a strong bullish movement.
To recap, **0.900** is your “last hope” support, and **0.8308** is your next major support level if the price falls. On the upside, watch the resistance levels at **1.00**, **1.1544**, **1.253**, and **1.432**.
And remember, all of this is purely based on technical analysis, and **this is not financial advice** ⚠️💸. Always make sure to do your own research before making any financial decisions! 🧠💡
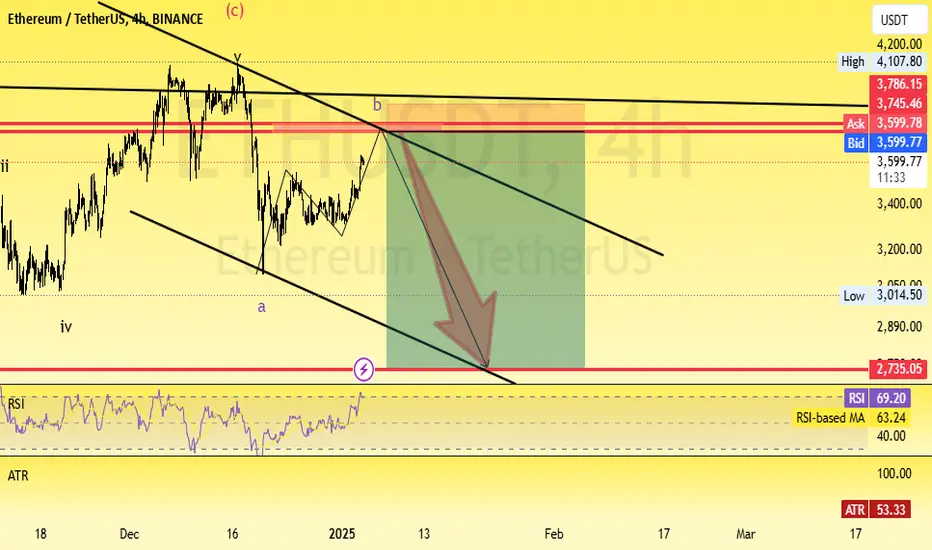
ETHUSDT: 4hr Timeframe Elliot Wave analysisHello friends. According to Elliot Wave from ETHUSDT I expected the leg C for this currency and start downtrend at 3700$ shows on chart and touch the target at 2700$ . be profitable .
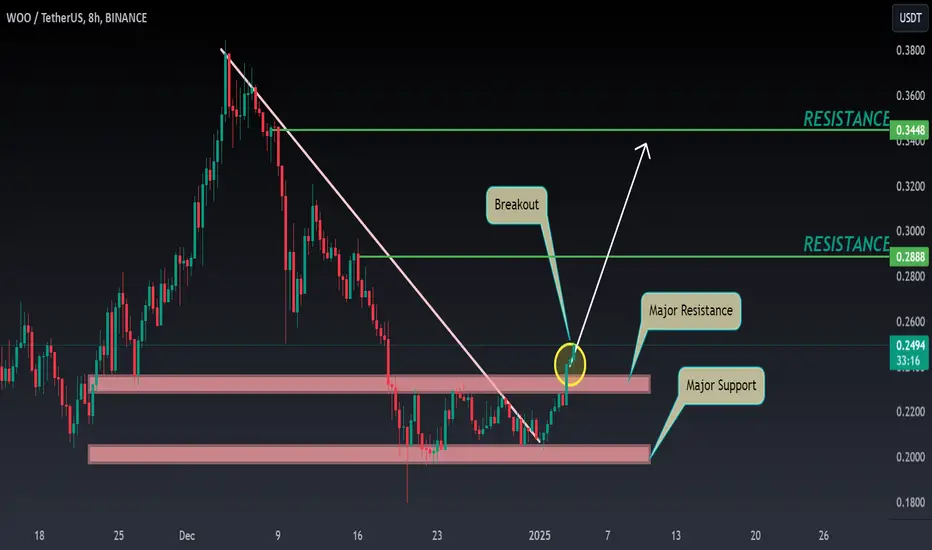
WOO ANALYSIS📊 #WOO Analysis
✅As we can see that #WOO was consolidating in a small range but right now there is a breakout or major resistance level. We would see a good bullish movement in #WOO
👀Current Price: $0.2490
🚀 Target Price: $0.2880
⚡️What to do ?
👀Keep an eye on #WOO price action and volume. We can trade according to the chart and make some profits⚡️⚡️
#WOO #Cryptocurrency #TechnicalAnalysis #DYOR
SEI/USDT Wave 3 Breakout – Targeting $2.154!SEI has likely bottomed out after consolidating near its key support zone and is now displaying strong bullish momentum, signaling the start of Wave 3.
🔑 Key Insights:
📊 Daily Bullish Divergence: Momentum indicators reveal a bullish divergence on the daily timeframe, supporting a potential trend reversal and breakout to the upside.
📈 Daily MA200 at $0.40: The $0.40 level, aligning with the daily MA200, has acted as a strong confluence zone and a critical support level for SEI.
🔄 Accumulation Phase: SEI has been consolidating near this area, and the recent breakout signals the end of this phase.
🎯 Wave 3 Target:
Minimum Target: 🎯 2.14
Wave 3, typically the most extended and impulsive move in Elliott Wave Theory, aligns with the 2.618 Fibonacci extension, reinforcing the bullish outlook.
🛠 Support Levels:
📌 Key Support Zone: $0.40
In case of a pullback, this level will be critical for a potential retest and further accumulation.
📊 Conclusion:
SEI’s bullish divergence, strong confluence at $0.40, and breakout suggest a promising upward trend. With Wave 3 targeting $2.154, traders should monitor for sustained volume and positive market sentiment to confirm this momentum.
Disclaimer:
⚠️ This analysis is for educational purposes only and not financial advice. Always conduct your own research and trade responsibly.

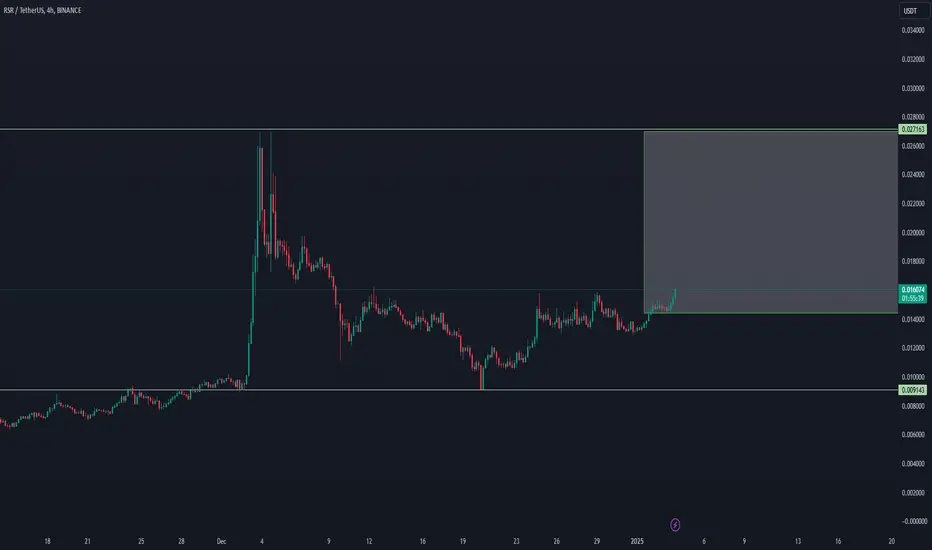
ZEN/USDT VOLUME INCREASEZEN/USDT VOLUME INCREASE
This coin shows a new volume start which can be confirmed.
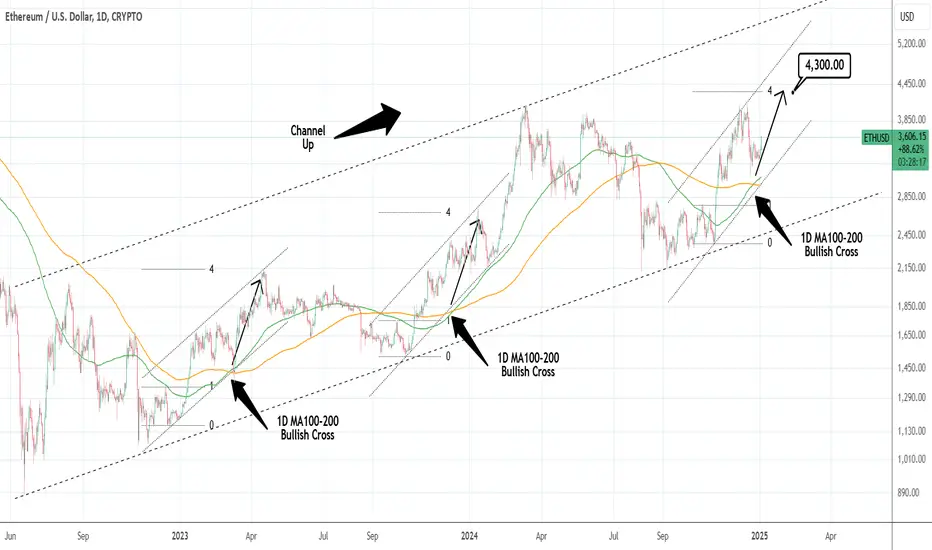
ETHUSD: MA Bullish Cross triggering rally to 4,300Ethereum is marginally neutral on its 1D technical outlook (RSI = 55.733, MACD = -18.850, ADX = 38.044), which along with today's rise, indicates the high upside potential of this move. The 1D MA100 has crossed over the MA200, forming a rare Bullish Cross that we last saw on December 12th 2023 and March 3rd 2023. That was a technical buy signal that targeted on a minimum the 4.0 Fibonacci extension. That is our target (TP = 4,300).
## If you like our free content follow our profile to get more daily ideas. ##
## Comments and likes are greatly appreciated. ##
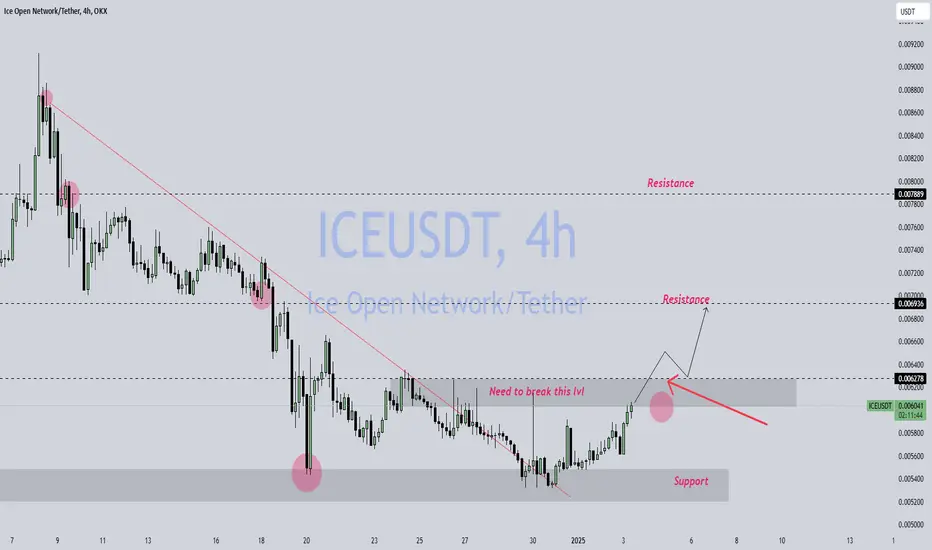
Ice/UsdtOKX:ICEUSDT
**Ice Coin Overview**
- **Market Cap**: $39.5M 📊
This represents the total market value of all Ice Coin in circulation. It’s a key indicator of the asset's size in the crypto market.
- **24h Volume**: $10M 💵
This is the total trading volume in the last 24 hours. A higher volume usually indicates increased interest and activity in the coin, which could lead to price changes.
- **Fully Diluted Valuation (FDV)**: $126.32M 💎
FDV represents the total value of the coin if all tokens were in circulation. It gives a sense of the potential market value based on the total supply.
- **Total Supply**: 2.115B (2.115 billion coins)
This is the maximum number of Ice Coin that will ever exist. The current circulating supply may be smaller, but this is the cap for the coin's supply.
- **Current Price**: $0.005967 💰
This is the current trading price of the Ice Coin in the market. At this price, the coin is relatively low, and small price changes could have a larger percentage impact.
---
### **Resistance and Support Levels Explained**
- **Resistance**: $0.00600 📈
Resistance levels are price points where selling pressure is strong enough to halt the price from going higher. For Ice Coin, **$0.00600** is the immediate resistance level. If the price breaks and holds above this point, it could indicate continued bullish momentum (price moving up).
- **Next Resistance Levels**:
- **$0.0069534** 🚀
- **$0.00700** 🚀
These are the next levels where price could face resistance after breaking the $0.00600 mark. If the price successfully reaches and holds these levels, it indicates strong upward momentum. Traders will likely be watching these points to see if Ice Coin can break through and continue growing.
---
- **Support**: $0.05643 ⚖️ & $0.05500 ⚖️
Support levels are price points where buying pressure is expected to be strong enough to prevent the price from falling lower. If Ice Coin doesn't manage to break through the $0.00600 resistance, it could fall back to these support levels. If the price holds at these points, it may bounce back upward.
- **Next Support Levels**:
- **$0.00500** ⚖️
- **$0.00400** ⚖️
These are critical support levels where the price could find a strong buying interest if it falls below $0.05643. If the price drops below these support levels, it may indicate a bearish trend, and the price could continue to fall.
---
### **What This Means for Traders**
- **Increased Volume**: If trading volume increases, it could signal that more people are interested in buying or selling Ice Coin, which could push the price either upward (bullish) or downward (bearish), depending on how the buying and selling balance out. The volume is a key indicator to watch.
- **Breaking Resistance**: If the price breaks the $0.00600 resistance and holds above it, this would be seen as a bullish signal, meaning the price could keep rising. The next target would be $0.0069534 or $0.00700.
- **Falling Below Support**: If the price can’t hold the support levels at $0.05643 or $0.05500, the next downside targets are at $0.00500 and $0.00400. This would be seen as a bearish trend, and traders would be cautious about the price dropping sharply.
---
**⚠️ Important Note**:
This is **not financial advice**. Cryptocurrency is highly volatile, and prices can change quickly. Always do your own research (DYOR) and consider consulting with a financial advisor before making any trading decisions. 🚫
---
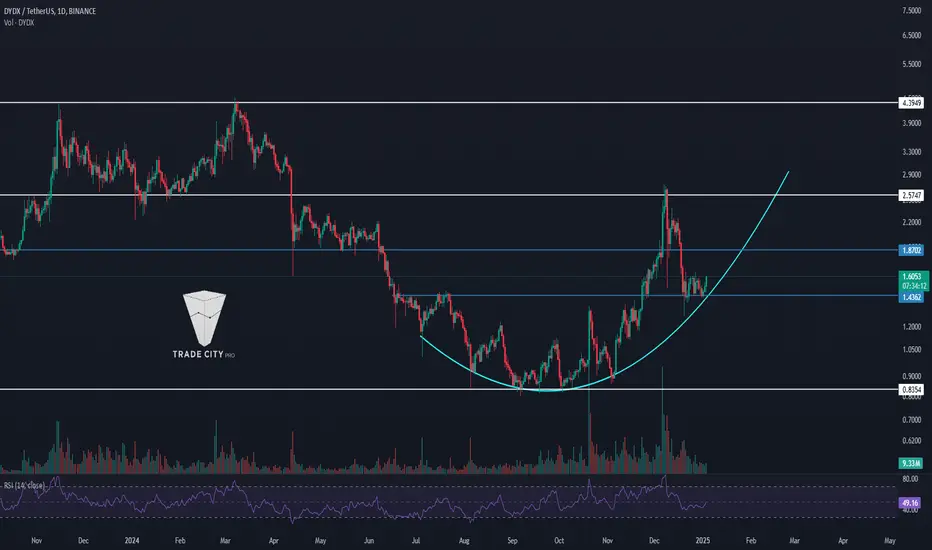
TradeCityPro | DYDX: Daily Trend Line Reaction & Momentum Shift👋 Welcome to TradeCityPro!
In this analysis, I will examine the DYDX coin, which is associated with the DYDX exchange, one of the well-known decentralized exchanges (DEXs) with a focus specifically on futures.
📅 Daily Timeframe: Reaction to the Curved Trend Line In the daily timeframe, after a price drop and recording new lows, we observed a rounding at the bottom of the chart which gradually reduced the bearish momentum and selling volume in the market, followed by an influx of bullish volume and momentum.
✨ After breaking through $1.4362, the price moved upwards more freely, breaking the $1.8702 area and continuing its movement up to $2.5747. However, it could not stabilize in these areas and started correcting, eventually falling back to $1.4362.
📈 The market volume has been decreasing during the bearish phase, gradually diminishing, which indicates the strength of the bullish trend. In my opinion, if we observe a trend change in the shorter timeframes, the next price leg will begin.
🛒 The main price trigger for going long is breaking $2.5747, but an earlier and riskier trigger would be $1.8702. For spot purchases, the trigger at $2.5747 is suitable, but the main trigger will be at $4.3949.
📝 Final Thoughts
This analysis reflects our opinions and is not financial advice.
Share your thoughts in the comments, and don’t forget to share this analysis with your friends! ❤️
ETH ChartHey,
Since December 9th, markets have mostly pulled back, with ETH and RUNE doing what we expected and shared in our community.
My bullish conviction on ETH was a bit too strong with the crazy inflows, but my overall outlook remains positive for 2025.
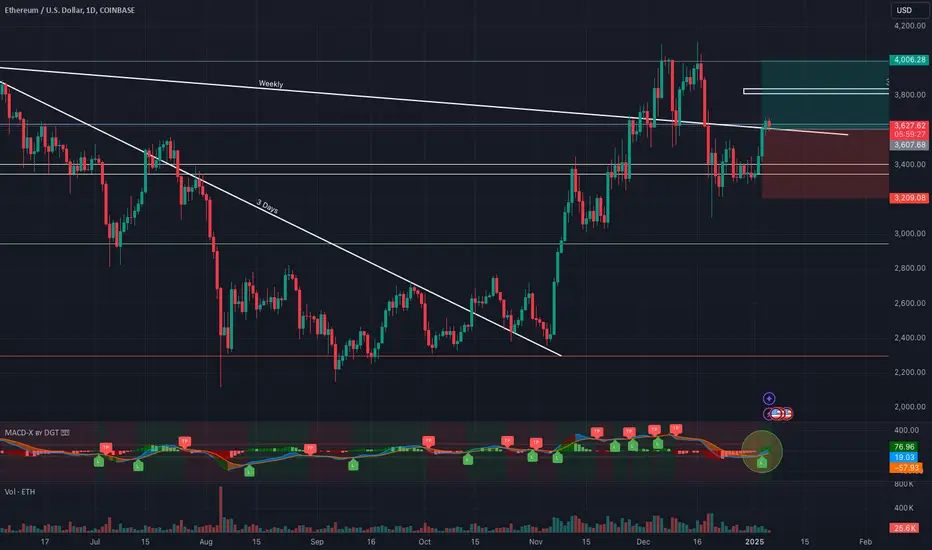
ETH is now stalling on its upper wedge trend line, likely consolidating before new highs.
ETF holdings for ETH have grown by 64%, showing continued bullish sentiment.
Expecting more upside and the ETH target remains the same for me.
Kind regards,
Max Nieveld