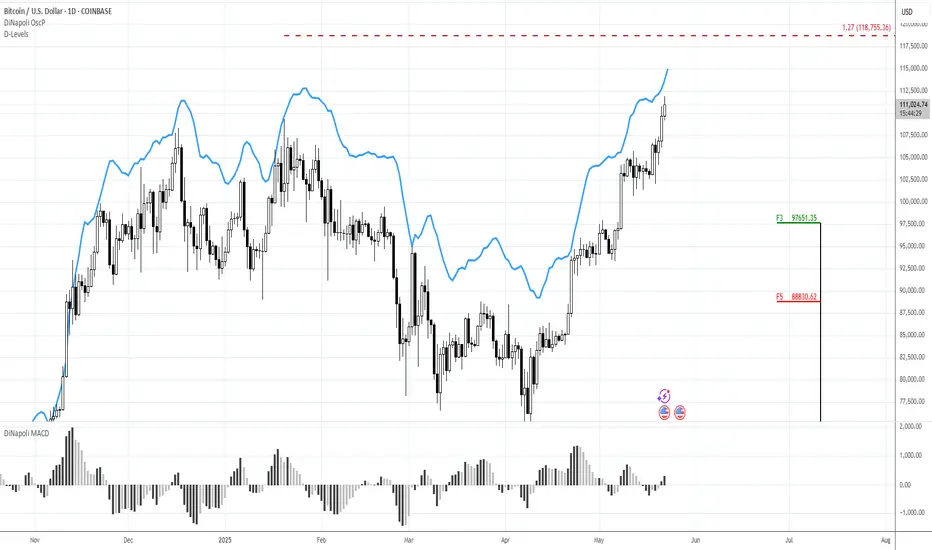
BTCUSD: 1D Golden Cross signals more upside to 155k.Bitcoin dropped below the overbought barrier on its 1D technical outlook (RSI = 69.592, MACD = 4447.700, ADX = 32.855) following today's Trump led pullback. On the long term though, this is nothing but a technical reaction to fundamentals and not enough to invalidate the bullish trend as not only did we make new ATH this week but also just completed a 1D Golden Cross. This is the first such pattern since October 27th 2024, which validated the previous bullish wave that peaked on the 2.0 Fibonacci extension. According to that, Bitcoin should extend the current uptrend with TP = 155,000.
## If you like our free content follow our profile to get more daily ideas. ##
## Comments and likes are greatly appreciated. ##
Cryptocurrency

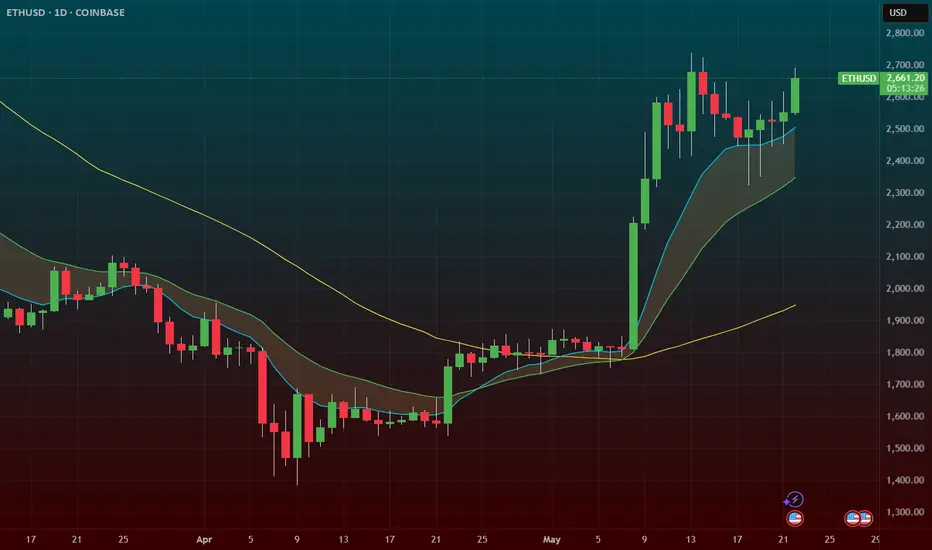
ETH (ethereum) – Massive Flag Pattern After 100% RunCRYPTOCAP:ETH – Bullish Flag After Monster Run
Ethereum ( CRYPTOCAP:ETH ) has nearly doubled since April, and now it’s cooling off — but in the best way possible: a bullish flag consolidation.
🔹 After a nearly 100% move, ETH has been consolidating tightly for two weeks — textbook flag behavior.
🔹 The trend remains strong, and this type of structure often leads to another leg higher.
🔹 Volume has tapered off during the flag — exactly what you want to see before a breakout.
Setup Overview:
Pattern: Large bull flag
Support/Risk: Defined risk to the $2500 zone
Measured Move Target: Breakout could push to $3100–$3500 based on the prior leg
Why I like this setup:
Healthy consolidation after a parabolic run
Risk/reward is favorable with structure and measured target
Potential breakout fuel from the ETH ETF narrative + BTC dominance rotation
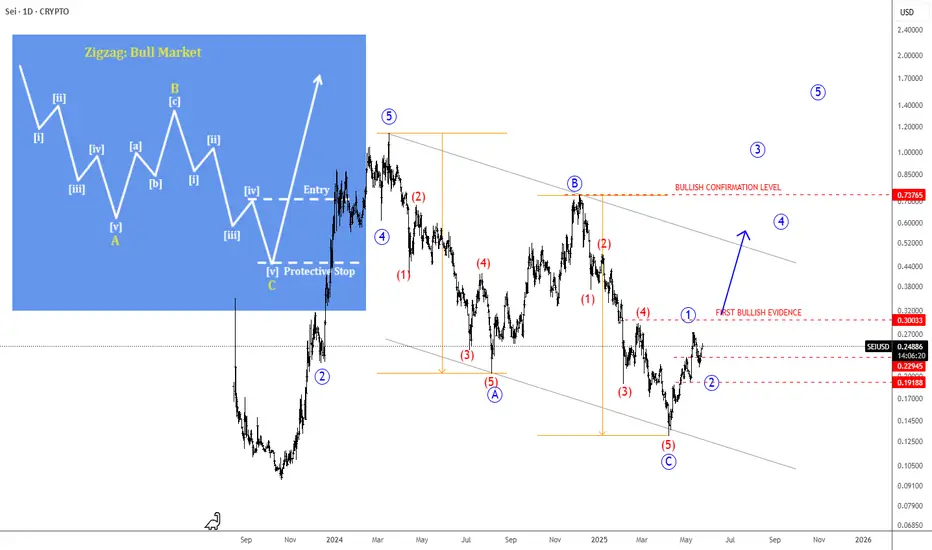
SEI Turns Bullish After A Zig-Zag CorrectionSEI Turns Bullish After A Zig-Zag Correction, as we see it sharply bouncing from projected support that can send the price higher by Elliott wave theory.
SEI with ticker SEIUSD is waking up exactly from the channel support line and equality measurement of waves A=C, which is perfect textbook support for subwave (5) of an impulse into wave C of an ABC zig-zag correction. It's actually nicely and impulsively rising for wave 1, so after current wave 2 pullback, be aware of a bullish continuation within wave 3 of a five-wave bullish cycle, especially if breaks above 0.30 first bullish evidence level.
Sei (SEI) is a high-performance Layer 1 blockchain designed specifically for decentralized finance (DeFi) and decentralized exchanges (DEXs). Launched in August 2023 by Sei Labs, it features innovations like Twin-Turbo Consensus for fast block finality, Optimistic Parallelization for high throughput, and SeiDB for efficient transaction handling. It supports EVM compatibility, enabling seamless deployment of Ethereum-based apps. The SEI token is used for transaction fees, staking, governance, and liquidity.
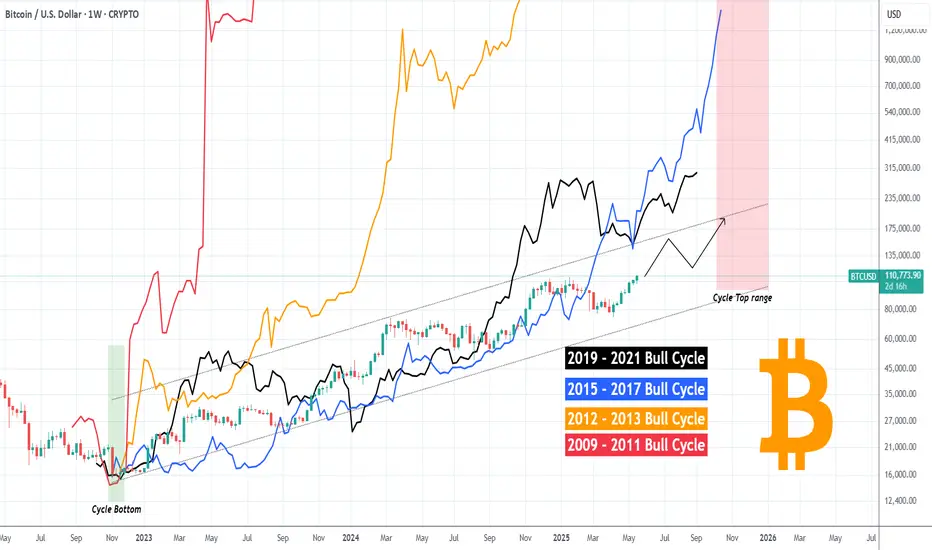
BITCOIN is attempting to converge with past Cycles!Bitcoin (BTCUSD) is experiencing the weakest Bull Cycle in its history, a natural product of the Theory of Diminishing Returns (TDM).
This chart couldn't have put it better as we show all Cycles since BTC's first day, one on top of the other. Naturally the first Cycles were the most aggressive, witnessing extraordinary gains as the upside potential of a fresh market was enormous in its early days.
The 2015 - 2017 (blue trend-line) and 2019 - 2021 (black trend-line) Bull Cycles have been harmonized to a more traditional capital market state and this is obvious on their trend-lines, which exhibit similar parallel price action. Whenever the two diverged, they converged at some point during the Cycle.
The current Cycle (2023 - 2025) following the late February 2025 divergence, is now attempting to converge again with its strong rebound in the past 6 weeks. Being however within a Channel Up throughout the entirety of the Cycle, it appears that it will do so in a structured way and as the TDM suggests, will offer weaker gains.
What we can project, as we've shown on previous studies in great detail, is the timing of the Cycle Top. Based on past Cycles, it should be within October - December 2025. Timing your exit strategy can perhaps be more effective than assigning a certain Target, even though the peak is expected to be anywhere within the $150k - $200k range.
So do you agree that the rise we're witnessing is the Cycle's attempt to converge with past ones and close the gap before it tops? Feel free to let us know in the comments section below!
-------------------------------------------------------------------------------
** Please LIKE 👍, FOLLOW ✅, SHARE 🙌 and COMMENT ✍ if you enjoy this idea! Also share your ideas and charts in the comments section below! This is best way to keep it relevant, support us, keep the content here free and allow the idea to reach as many people as possible. **
-------------------------------------------------------------------------------
💸💸💸💸💸💸
👇 👇 👇 👇 👇 👇
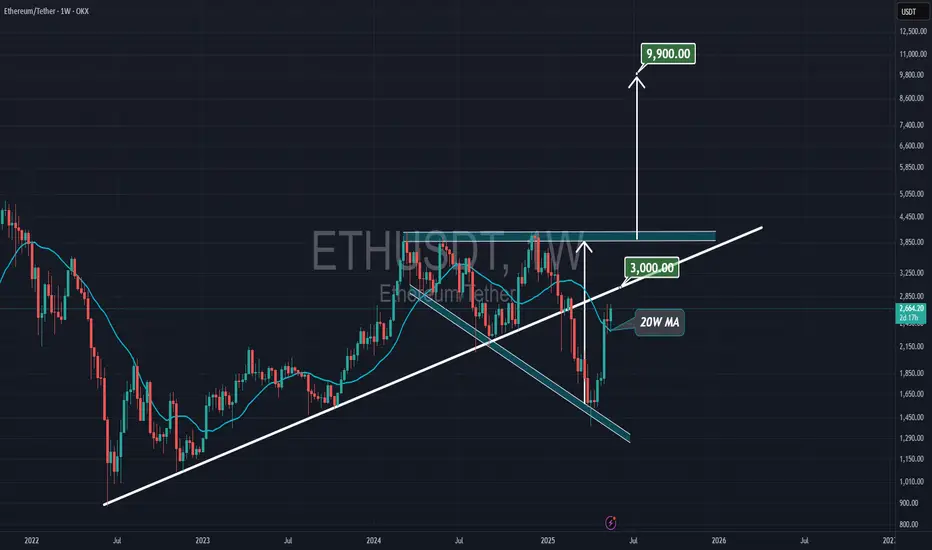
Ethereum can get $9900 (23MAY2025)As Ethereum is playing inside a broadening pattern ( 2 blue zone )
1) Hold above the 20 weekly MA
2) Needs to break the $3000 trendline
3) Breaks above $4000 resistance
The target at $9900 is reachable in the coming months
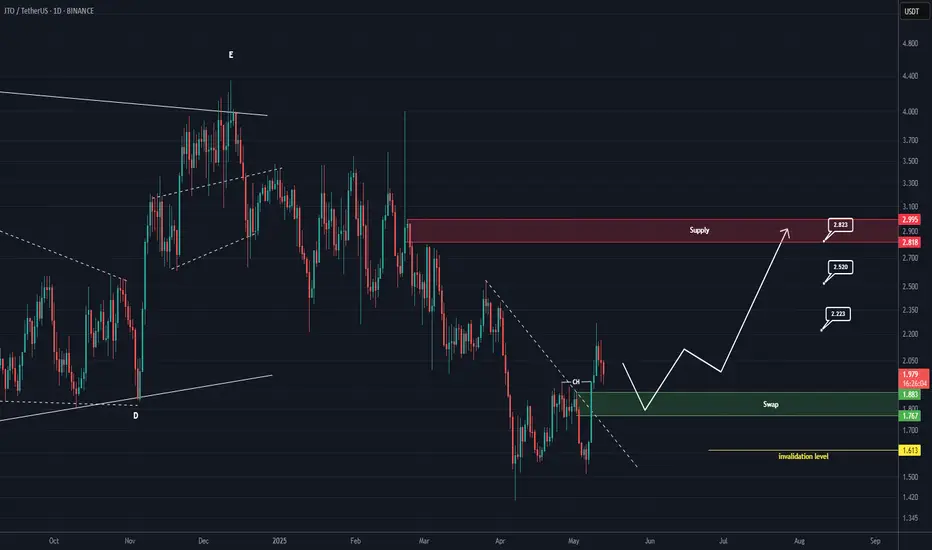
JTO Buy/Long Setup (1D)It appears that JTO is in a bearish pattern on the higher timeframe, but it shows a bullish structure on the lower timeframes and could move to the upside.
The trigger line has been broken, and we have a bullish CH (Change of Character) on the chart.
We are looking for buy/long positions around the SWAP zone.
A daily candle closing below the invalidation level would invalidate this outlook.
For risk management, please don't forget stop loss and capital management
When we reach the first target, save some profit and then change the stop to entry
Comment if you have any questions
Thank You
ARBIUSD This wave has more upside to giveArbitrum / ARBIUSD is trading inside a Channel Down since the September 11th 2023 low.
At the moment it is on its 3rd bullish wave within this structure and the 1day RSI shows that the breakout above its MA confirms further upside.
Buy and target 0.69000 (+185% like the previous bullish wave).
Follow us, like the idea and leave a comment below!!

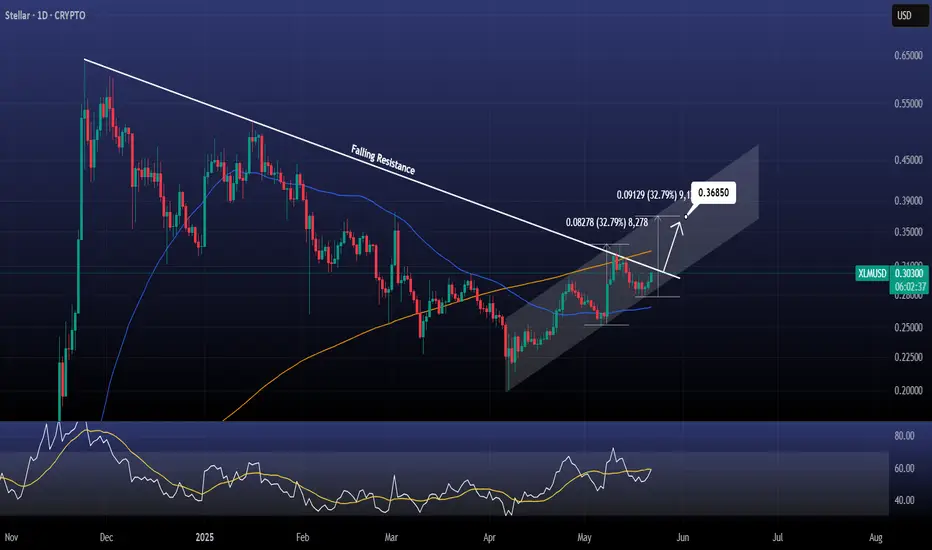
XLMUSD Huge breakout may happen any moment.Stellar / XLMUSD is testing the 6 month Falling Resistance again, while trading inside a Channel Up.
The 1day RSI is in strong support of this move and may force a 1day candle closing above the Resistance finally.
If it happens, go lonh and target 0.3650 (+32.79%).
Previous chart:
Follow us, like the idea and leave a comment below!!
DOGEBTC Strong chance that Dogecoin outperforms Bitcoin soon.DOGEBTC is testing its 1W MA50 (blue trend-line), which keeps it into a buy zone, exhibiting the same kind of price action it had during its previous Cycle in late December 2020.
That was right before the parabolic rally started where Dogecoin outperformed Bitcoin massively on the last strong known Altseason.
Right now the market is forming the same 1W MACD Bullish Cross it did on December 21 2020, straight after which it broke above the 1W MA50. The rebounded that was causes even broke above the Cycle's Falling Wedge in a rally that lasted 4 months.
We are inside a similar Falling Wedge since 2021 so a break-out may have a similar outcome. This chart shows that it may be time to move some capital to Doge.
-------------------------------------------------------------------------------
** Please LIKE 👍, FOLLOW ✅, SHARE 🙌 and COMMENT ✍ if you enjoy this idea! Also share your ideas and charts in the comments section below! This is best way to keep it relevant, support us, keep the content here free and allow the idea to reach as many people as possible. **
-------------------------------------------------------------------------------
💸💸💸💸💸💸
👇 👇 👇 👇 👇 👇

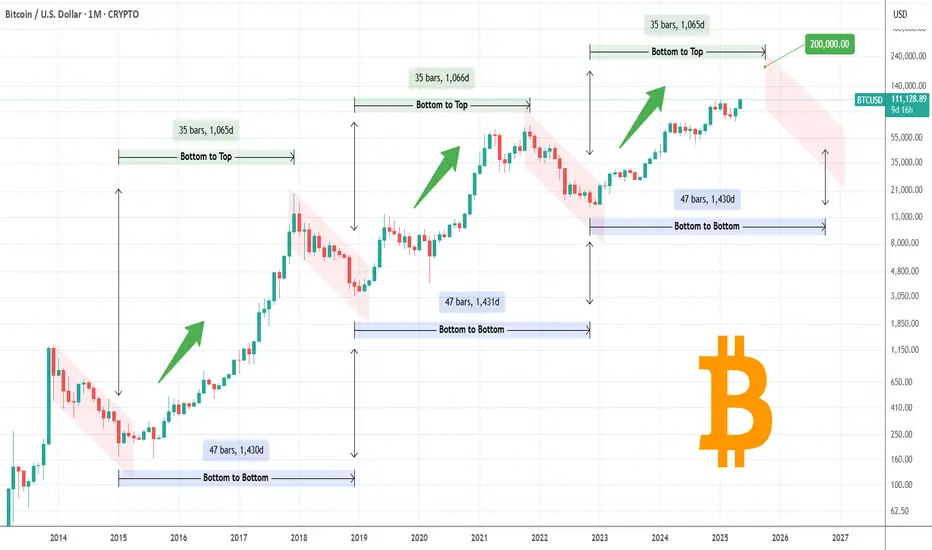
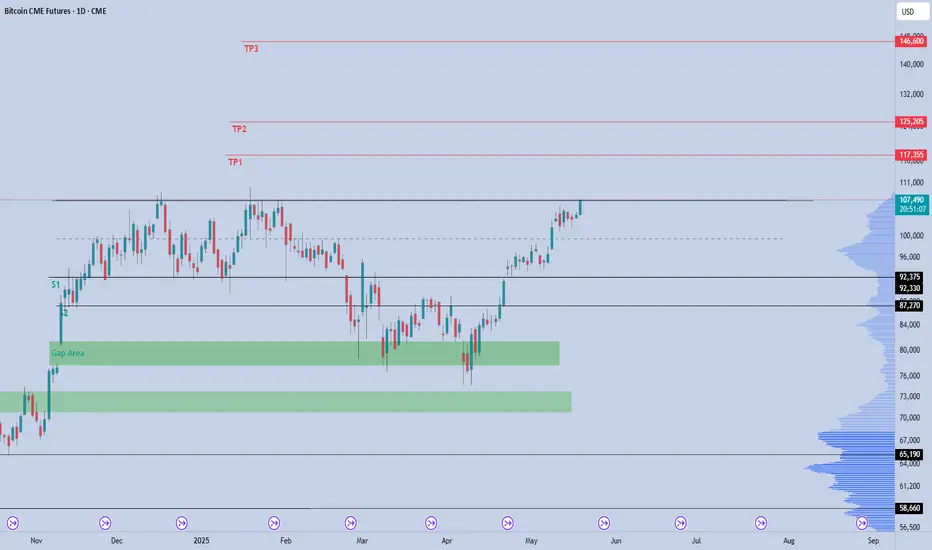
BITCOIN made new ATH but still much time left before a Cycle topBitcoin (BTCUSD) is about to enter the final week of May, with the month mostly likely to close on a strong green candle, the 2nd straight. Though it made yesterday a new All Time High (ATH) above 109k and many are already talking about a bearish reversal, this chart shows that there is still plenty of time left before the current Bull Cycle tops.
If fact a simple measurement of the Bottom to Bottom and Bottom to Top ranges of the last 3 Cycles is enough to present all the evidence that are needed for this case.
As you can see, the previous 2 Bull Cycles lasted for 35 months (1065 days) from Bottom to Top. Similarly, the Bottom to Bottom (Bear Cycle to Bear Cycle) measurement has been 47 months (1430 days).
This amazing symmetry suggest that BTC is more likely than not to repeat this feat on the current Cycle as well. A 35 month range from Top to Top indicates that the Bull Cycle is expected to peak on October 2025, while a 47 month Bottom to Bottom range indicates that the next Bear Cycle should bottom in October 2026! As far as a potential price top is concerned, various of the previous analyses we've conducted show that $200k is a fair maximum, but the current study focuses on the timing of profit taking and not specific price levels.
So are you willing to book your profits by this October? Feel free to let us know in the comments section below!
-------------------------------------------------------------------------------
** Please LIKE 👍, FOLLOW ✅, SHARE 🙌 and COMMENT ✍ if you enjoy this idea! Also share your ideas and charts in the comments section below! This is best way to keep it relevant, support us, keep the content here free and allow the idea to reach as many people as possible. **
-------------------------------------------------------------------------------
💸💸💸💸💸💸
👇 👇 👇 👇 👇 👇
118.75KMorning folks,
So, last time BTC was not able to show retracement that we've suggested. In fact by the end of the session, no reversal day was formed. It was some fake alarm. Our long-term 110K target has been completed, so monthly grabber has reached the minimum target.
But for now we see nothing to do. We consider no shorts. Market stands confidently around the top, without sharp drop back, it is not at overbought or at some strong resistance, so it could keep going higher. Next our upside target is 118.75K. So we could keep existed longs, just don't forget to manage stops.
If downside pullback still starts it might become good chance for long entry again. Market now is driven by rebalancing portfolios of big funds that have to sell US assets as they lost AAA rating. This explains why dollar is falling while yields are raising. This is not fast process and probably will last for some time more.
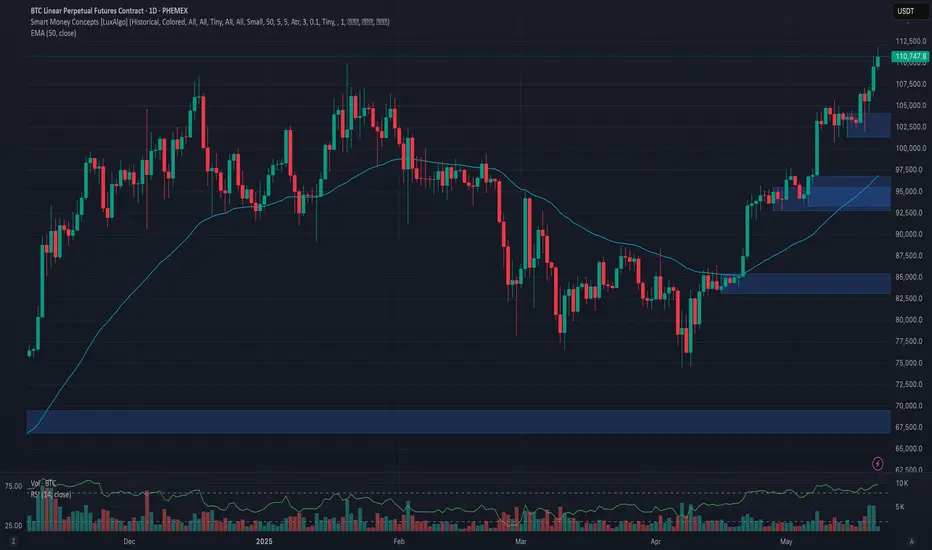
Phemex Analysis #82: BTC Breaking the $110,000 All-Time-High!Bitcoin ( PHEMEX:BTCUSDT.P ) has reached a new all-time high, surpassing $111,000, driven by strong institutional inflows, regulatory clarity, and macroeconomic factors. This surge follows our previous analysis , where we anticipated a potential breakout above the $105,000 mark. The current rally is fueled by increased demand from institutional investors, favorable regulatory developments, and concerns over traditional financial markets.
Possible Scenarios
1. Testing $120,000
With momentum on its side, Bitcoin could aim for the next psychological resistance at $120,000. Institutional interest, as evidenced by significant ETF inflows and corporate investments, supports this bullish outlook. Technical indicators, such as the "golden cross" pattern, also suggest continued upward momentum.
Pro Tips:
Monitor trading volume and market sentiment for signs of sustained bullishness.
Set stop-loss orders to protect against sudden reversals.
2. Rejection and Retest of $100,000 Support
After reaching new highs, Bitcoin may experience a pullback to test the $100,000 support level. This consolidation could be a healthy correction before the next leg up.
Pro Tips:
Watch for buying opportunities near the $100,000 support zone.
Be cautious of false breakouts and wait for confirmation before entering new positions.
3. Bearish Reversal Due to U.S. Treasury Bonds News
Rising U.S. Treasury yields and fiscal concerns have led to increased volatility in traditional markets. A significant shift in investor sentiment could trigger a bearish reversal in Bitcoin's price.
Pro Tips:
Stay informed about macroeconomic developments, particularly U.S. fiscal policies and bond market movements.
Long-Term Accumulation: For investors with a longer-term perspective, significant price dips near lower supports—such as $92750, $83000, or even $66810—could represent attractive opportunities to accumulate BTC at discounted valuations.
Conclusion
Bitcoin's recent surge past $110,000 marks a significant milestone, reflecting growing institutional adoption and favorable market conditions. While the bullish trend may continue, traders should remain vigilant and prepared for potential corrections or reversals influenced by macroeconomic factors. Employing sound trading strategies and staying informed will be key to navigating the evolving landscape of Bitcoin's price movements.
Pro Tips:
Armed Your Trading Arsenal with advanced tools like multiple watchlists, basket orders, and real-time strategy adjustments at Phemex. Our USDT-based scaled orders give you precise control over your risk, while iceberg orders provide stealthy execution.
Disclaimer: This is NOT financial or investment advice. Please conduct your own research (DYOR). Phemex is not responsible, directly or indirectly, for any damage or loss incurred or claimed to be caused by or in association with the use of or reliance on any content, goods, or services mentioned in this article.
BTC HTF ThoughtsChart from end of Dec/early Jan. Idea back then was that the top is in, and we'll revisit at least 51.5 levels. IMO low will be between 41.5-32.5, with potential to reach 23s.
However, it won't happen in one day and it's finally at prices i want to scale in and hold for the next weeks/months incase i'm wrong with the macro idea.
I'm a buyer between 74-62, levels in between are 72, 69, 65 and 62.

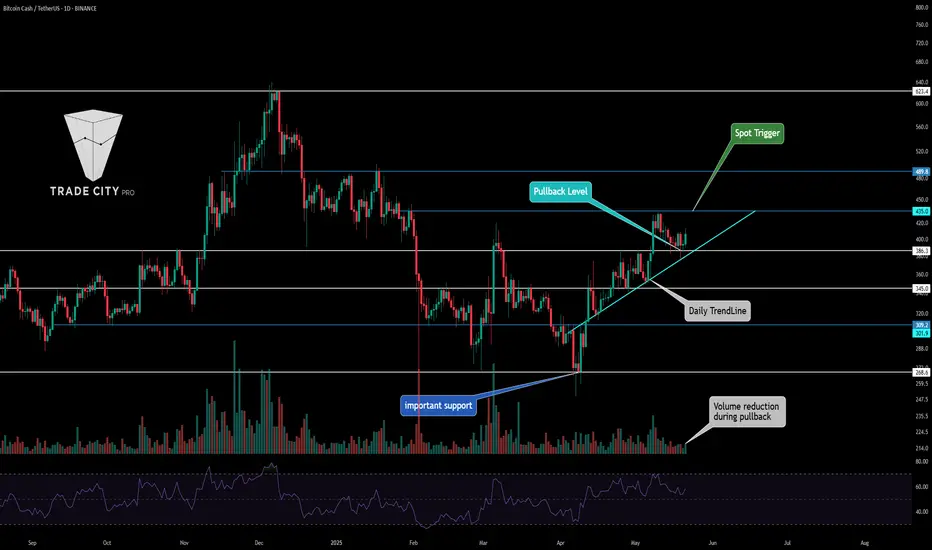
TradeCityPro | BCHUSDT Bitcoin Fork Ready to Hit New Highs?👋 Welcome to TradeCityPro Channel!
Let’s dive in and analyze the Bitcoin fork, BCH, to understand why this altcoin is performing much better than the broader market and is being supported at higher levels.
🌐 Overview Bitcoin
Before starting the analysis, I want to remind you again that we moved the Bitcoin analysis section from the analysis section to a separate analysis at your request, so that we can discuss the status of Bitcoin in more detail every day and analyze its charts and dominances together.
This is the general analysis of Bitcoin dominance, which we promised you in the analysis to analyze separately and analyze it for you in longer time frames.
📊 Weekly Time Frame
In the weekly time frame, we see that BCH is in a much better position compared to other altcoins and continues to form higher highs and higher lows!
After hitting the 707 resistance and getting rejected, we’ve been ranging in a large box. However, it’s fair to say that buyers have the upper hand in this box because, after touching the critical 268 support, we engulfed the previous three weekly candles and experienced a sharp move up to 424.
Currently, we’re at a critical point: we could either form a lower high relative to the previous resistance or undergo a mid-term correction and re-enter after breaking 424!
📉 Daily Time Frame
In the daily time frame, the situation is similarly favorable, and BCH is continuing its trend with good momentum. The formation of higher highs and higher lows provides a sense of calm to the uptrend.
After the heavy decline in February, it was natural for us to enter a ranging period before forming a new structure. This happened, and after retesting the 268 support, we started forming higher highs and lows, with our first entry at the 345 level.
Currently, after a rejection from 435, we’ve corrected to 386, which was a low-volume move, technically considered a pullback. If we see a supportive candle at this level, it’s a trigger for a buy, and breaking 435 will be the next trigger!
✍️ Final Thoughts
Stay level headed, trade with precision, and let’s capitalize on the market’s top opportunities!
This is our analysis, not financial advice always do your own research.
What do you think? Share your ideas below and pass this along to friends! ❤️
IOTAUSD Channel Up eyes +45% bullish leg.IOTAUSD is trading inside a Channel Up, which is the bullish pattern that took it above its 5 month Falling Resistance, essentially the trade war correction.
The 1day MA50 is providing support and the 1day MA200 is already broken, which signals bullish extension.
The Channel's previous bullish leg recorded +45%, so go long and target 0.31000.
Follow us, like the idea and leave a comment below!!

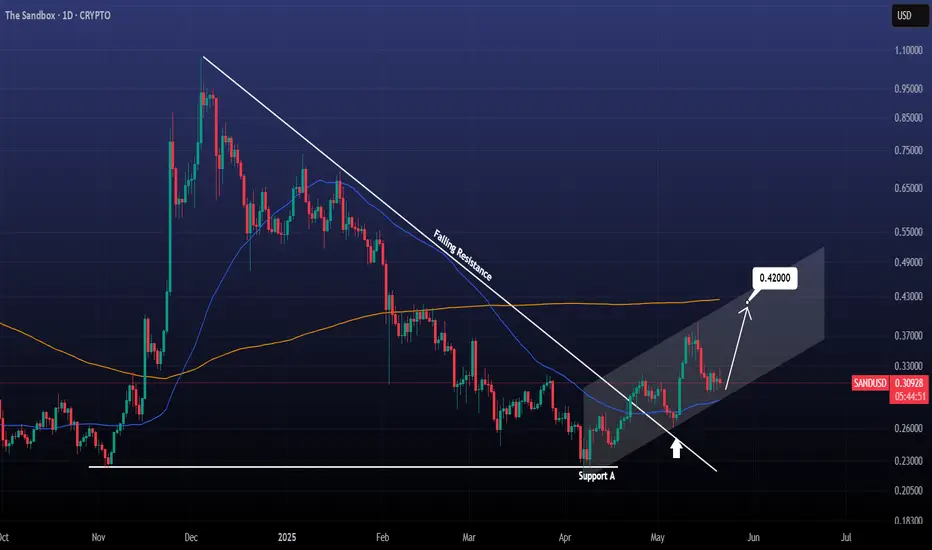
SANDUSD targeting the 1day MA200 at 0.42000Sandbox / SANDUSD has entered a Channel Up structure ever since it double bottomed on Support A and crossed above the Falling Resistance.
Now it's supported by the 1day MA50 and is aiming at a new Higher High on the 1day MA200.
Target 0.42000
Follow us, like the idea and leave a comment below!!
XRPUSD Bull Flag broken. Can it go x10 from here?XRPUSD has broken above its Bull Flag, which has been the corrective pattern of the Trade War since January's High.
At the same time a 1day Golden Cross is being formed and if we get the same rally that was followed after the recent U.S. elections, the price may hit the 2.0 Fibonacci extension.
This represents a bold x10 move from here with a $23 target. Do you think that's plausible for this Cycle?
Follow us, like the idea and leave a comment below!!

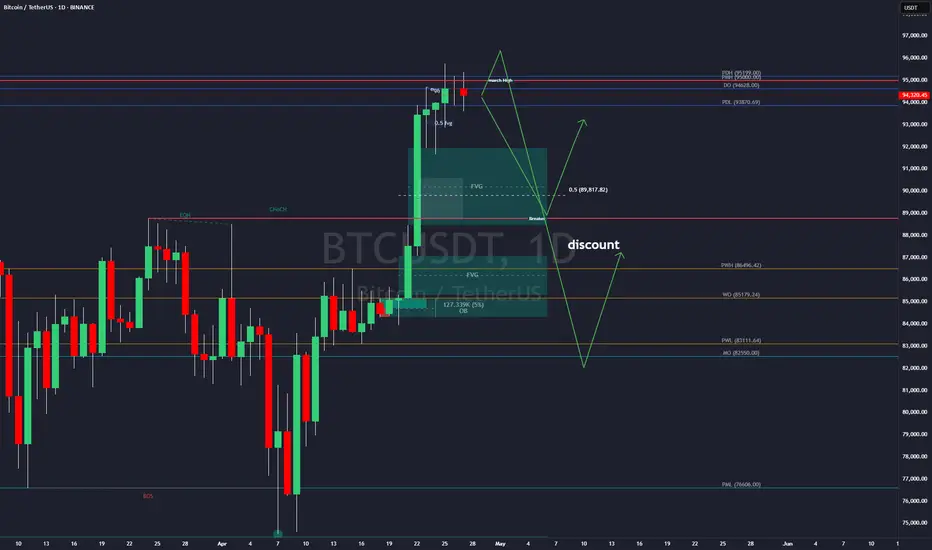
Bitcoin - Do Or DieThis is the spot where things either get spicy or go limp. If we see weakness here — same old chop, same range, nothing to see.
But if Bitcoin punches through this zone with conviction, we’re looking at some serious upside. Targets are mapped, and the path is clear if bulls step up.
No breakout? Don’t expect fireworks.
Breakout? Strap in.
This is a decisive moment
BTC- crash is coming? Most likely no)In its best traditions, bitcoin in one impulse reached the monthly target 95000, which I wrote about
The probability of a correction to set a higher low in the equilibrium area of the range is increasing.
Probably in May the crypto market will have to pass the last stability test, in case of success we will get excellent opportunities for spot and speculative positions before the next cyclical growth spiral.
For now have to wait for weekly open but there are 2 options:
pump till PWH and then move on correction
slow bleeding till 0.5 or mb till 83k in worst case and then pump to ATH
ULTIMA SHOWS SAME PATTERN AS BTC BEFORE EXPLOAD TO THE 100K🔥 Ultima has formed a bullish descending flag pattern on the daily chart. The same pattern led BTC to an explosive rise to $100,000 at the end of the previous year.
This pattern is historically a correction in a bullish trend and breaks to the upside, continuing the rise.
Ultima has been one of the strongest technologically backed tokens this cycle . The token has risen in value by over 1000% from its low in the summer and now, having set a new atx, is consolidating under it, gaining strength for the next momentum.
Last weekend was a strong shakeout for leveraged traders and the price corrected to key support at $15,000. And on top of that, a FVG (Fair Value Gap) formed above, which 99% of the time closes sooner or later.
⚙️ Metrics and indicators:
RSI - hit 16.9, which historically signifies an oversold zone and leads to at least a short-term bounce. The last time the RSI reached these levels, Ultima's price rose 469% in 2 months.
MACD - after a prolonged decline, is now approaching to converge and give a bullish cross section, historically signifying a return to an uptrend.
EMA - price has reached the 200 EMA level on the daily chart and is trying to consolidate above, as we all know, the first test of the 200 EMA in a bull market usually leads to explosive buy impulses.
Volume - the entire correction took place over the weekend on lower volumes, dropping gamblers with shoulders. Major buying followed as early as the weekdays with many times the volume.
🌐 Fundamental:
Ultima is a strong project with a good background in the form of a strong dev and marketing team. The token made it to the top 200 CMC in no time. Holds events all over the world and participates itself, presenting really good products like cryptocard.
And the freshly launched in April, trading bot has increased the trading volume of the token many times, which is perfectly visible on the chart. I think many traders were actively shorting at this time, because despite the huge volumes of buyers, there were no strong upward impulses, so now there is a lot of liquidity at the top. And as we know, the price of an asset moves from liquidity to liquidity, it is its fuel.
📌 Conclusion:
The token is now clearly undervalued by the market by all metrics and technical analysis. So it is expected at least a technical bounce, which it has already started by the way, to close the GAP in the range of $15,357 - $20,240.
I have gained a spot position in the support zone of $13,100 - $14,814, with an average entry price of $13,560 and expect at least a return to the listing peak level, at about $18,959, a consolidation above which would probably mean a new ATH.

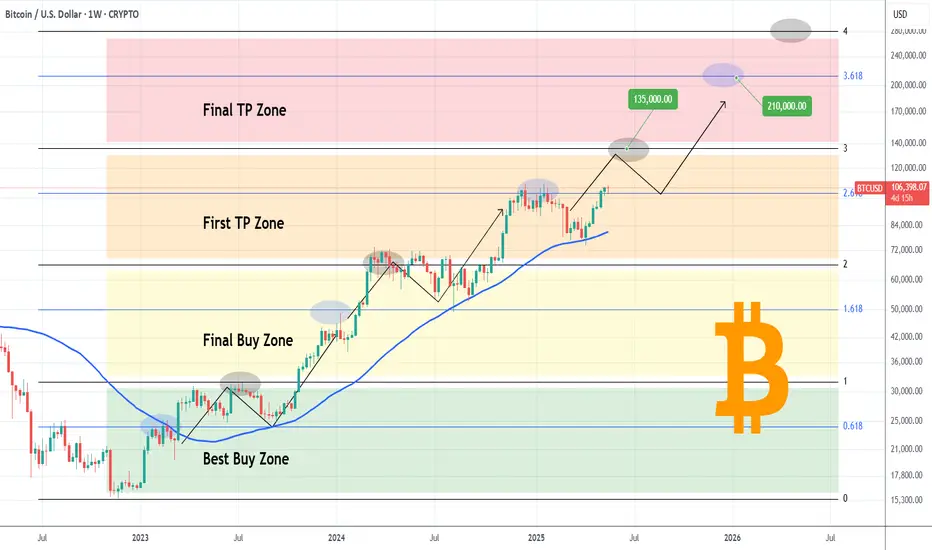
BITCOIN Ultimate Cycle Zones breakdown! See when to sell!Bitcoin (BTCUSD) is extending its amazing rebound on its 1W MA50 (blue trend-line), having recovered all of the losses sustained following the U.S. - Chine Trade War. Based on this Cycle's pattern, this 1W MA50 rebound is technically the new Bullish Leg, essentially its 4th of this Cycle.
Among all this, we managed to identify another cyclical pattern, separating the Cycle in terms of Activity Zones:
Naturally its very bottom is what we call the 'Best Buy Zone' (green), where BTC's earliest and most optimal buy opportunities existed. That ranges within the 0.0 and 1.0 Fibonacci levels.
Above that it's the 'Final Buy Zone' (yellow) where in relative efficieny terms, the last long-term buy opportunities existed. That Zone consists of the 1.0 and 2.0 Fibonacci levels.
Third in line is the 'First TP Zone' (orange) where long-term investors who seek lower risk, can start taking profit on their positions. The range on that is the 2.0 - 3.0 Fibonacci levels.
Lastly it's the 'Fina TP Zone' (red) where obviously it is the last opportunity (and with the greatest return but also elevated risk) to take profits before the Cycle prices its Top. This consists of the 3.0 - 4.0 Fibonacci range.
As you may have noticed, each Zone has a .618 interval (highlighted in blue). Zone 1 has the 0.618 Fib, Zone 2 the 1.618 Fib, Zone 3 the 2.618 Fib and one 4 the 3.618 Fib. This is where (so far) the price has made a first consolidation - correction after the start of the new Bullish Leg and before it gets completed at the top Fib. The last such consolidation was from mid December 2024 to late January 2025 and as you see those tend to be significant marks.
This model shows that the current Bullish Leg should prepare us for the Final TP Zone and its first stop is the 3.0 Fib at $135k. This is the bottom of the Final TP Zone and the first region that long-term investors should consider taking profits. The key 3.618 Fib extension is at $210k and in our opinion is the absolute max level we should look to sell all positions as chronologically Cycle wise the trend falls there towards the end of the year, which is where all Cycles topped. A 4.0 Fib test is highly unlikely to take place within this Cycle, unless macroeconomic fundamentals (extreme adoption and/or monetary intervention) kick in and that sits at $280k.
But what do you think? Do you agree with this Zones break-down and if yes are you considering taking profits at 135000? Feel free to let us know in the comments section below!
-------------------------------------------------------------------------------
** Please LIKE 👍, FOLLOW ✅, SHARE 🙌 and COMMENT ✍ if you enjoy this idea! Also share your ideas and charts in the comments section below! This is best way to keep it relevant, support us, keep the content here free and allow the idea to reach as many people as possible. **
-------------------------------------------------------------------------------
💸💸💸💸💸💸
👇 👇 👇 👇 👇 👇
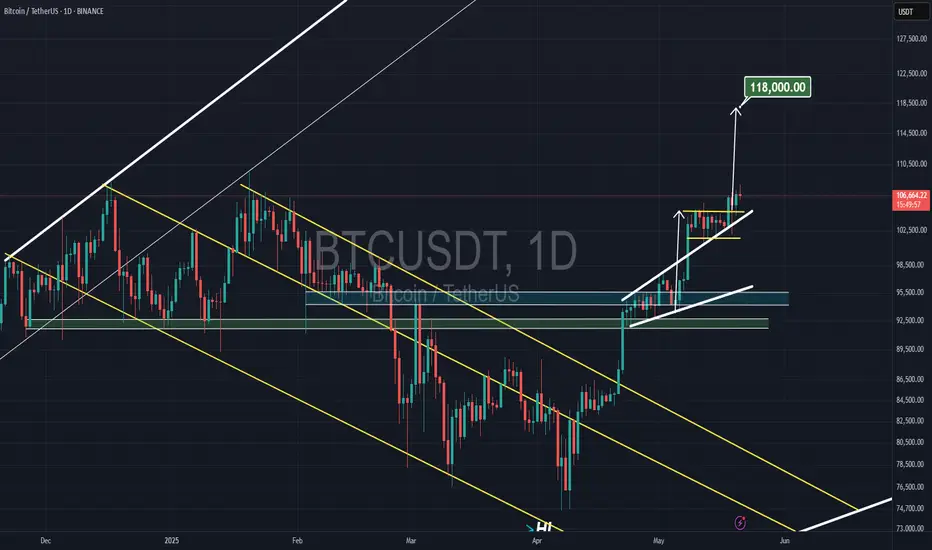
Bitcoin BULLFLAG on daily ( 21MAY2025 )It looks like Bitcoin has bull-flag on daily time frame and the yellow resistance line already has broken.
Now the target of this bull-flag is about $118k so far.
Phemex Analysis #82: Pro Tips for Trading Dogecoin (DOGE)Dogecoin (DOGE), once known primarily as a playful meme token, has proven it can produce substantial market movements, drawing significant attention from traders and investors. Notably, in October 2024, DOGE made headlines with a stunning 500% rally, soaring from $0.11 to a peak of $0.48. Yet, as swiftly as it surged, Dogecoin experienced a sharp reversal, dropping nearly 70% to its current price around $0.15.
Recently, technical indicators have hinted at potential opportunities. On March 11, DOGE's price dipped below the level seen on February 28, yet the Relative Strength Index (RSI) remained steady, creating a bullish divergence—often signaling a potential reversal. But before traders jump in, let’s carefully examine a few possible scenarios using key support and resistance levels as a roadmap.
Possible Scenarios
1. Bullish Reversal
The RSI divergence observed on the daily chart suggests decreasing selling momentum, hinting at a possible bullish reversal. If DOGE manages to break decisively above nearby resistance levels, renewed buying interest could emerge, pushing the price higher.
Pro Tips:
Entry Strategy: Look for a confirmed breakout above the key resistance zones of $0.261 and $0.286, ideally accompanied by increased trading volume.
Risk Management: To mitigate risk, set stop-loss orders below the recent support level of $0.21, ensuring you’re protected if the anticipated reversal fails.
2. Consolidation Phase
Following substantial price moves, DOGE may enter a period of sideways trading as the market consolidates gains or losses. During this phase, the price could oscillate within a defined range, offering opportunities for both traders and long-term investors to accumulate strategically.
Pro Tips:
Identify Key Levels: Closely monitor the key support at $0.21 and resistance around $0.261 to effectively execute range-based trading strategies.
Utilize Grid Bots: Due to lower volatility during consolidation, deploying grid trading bots can help systematically capture profits from minor price fluctuations.
3. Continued Downtrend
Despite recent positive signals, Dogecoin remains susceptible to broader market conditions. If DOGE breaks below the critical support at $0.21, bearish sentiment could intensify, resulting in further price declines toward lower support levels.
Pro Tips:
Short Positions: Advanced traders may consider short-selling DOGE below key support levels, profiting from continued downward pressure while maintaining a clearly defined exit strategy.
Long-Term Accumulation: For investors with a longer-term perspective, significant price dips near lower supports—such as $0.164, $0.15, or even $0.13—could represent attractive opportunities to accumulate DOGE at discounted valuations.
Conclusion
Dogecoin’s volatility continues to present unique trading opportunities alongside considerable risks. Traders must carefully analyze technical indicators like RSI divergences and closely monitor market sentiment and broader crypto trends. By understanding the scenarios outlined above, employing disciplined risk management, and remaining patient during market fluctuations, traders can confidently navigate DOGE’s price movements, positioning themselves strategically for potential rewards.
Pro Tips:
Armed Your Trading Arsenal with advanced tools like multiple watchlists, basket orders, and real-time strategy adjustments at Phemex. Our USDT-based scaled orders give you precise control over your risk, while iceberg orders provide stealthy execution.
Disclaimer: This is NOT financial or investment advice. Please conduct your own research (DYOR). Phemex is not responsible, directly or indirectly, for any damage or loss incurred or claimed to be caused by or in association with the use of or reliance on any content, goods, or services mentioned in this article.
