ETHUSD: Consolidation before the Megaphone targets 4,100Ethereum is on a strong bullish 1D technical outlook (RSI = 63.675, MACD = 190.470, ADX = 31.885) despite the current technical pullback which is happening due to the rejection on the 1D MA200. Once crossed, we expect a test of the Megaphone's top (TP = 4,100).
## If you like our free content follow our profile to get more daily ideas. ##
## Comments and likes are greatly appreciated. ##
Cryptocurrency

BTCUSD: Going for the decisive breakout that opens path to 155,0Bitcoin is almost overbought on its 1D technical outlook (RSI = 69.391, MACD = 3884.400, ADX = 20.801), which during rallies is the starting condition that fuels bullish breakouts and continuations. Such a breakout is about to take place right now as the price is on the LH trendline coming from the ATH. As this chart shows, once Bitcoin breaks over a LH trendline on this Cycle, it has always delivered (much) more upside. Assuming we are currently on the 0.5 Fibonacci level of that breakout, the pattern gives a TP = 155,000.
## If you like our free content follow our profile to get more daily ideas. ##
## Comments and likes are greatly appreciated. ##

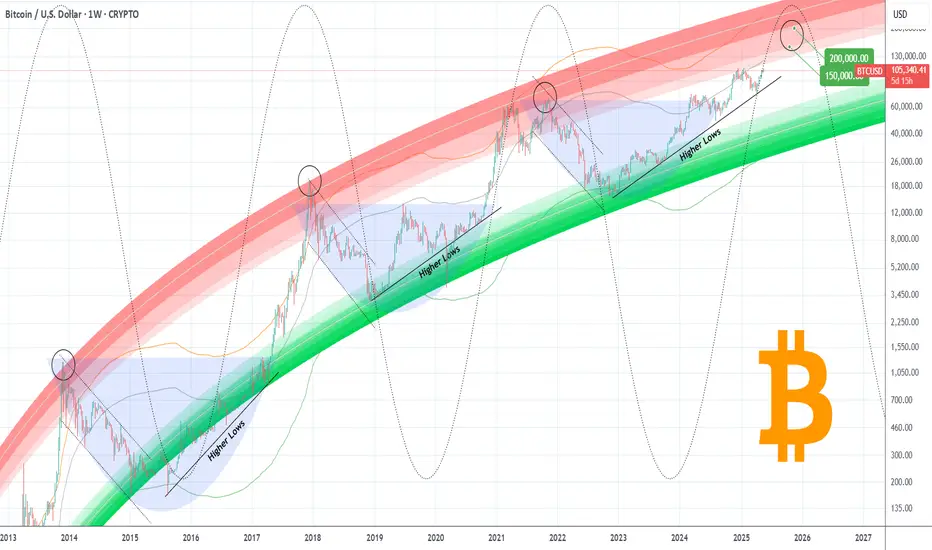
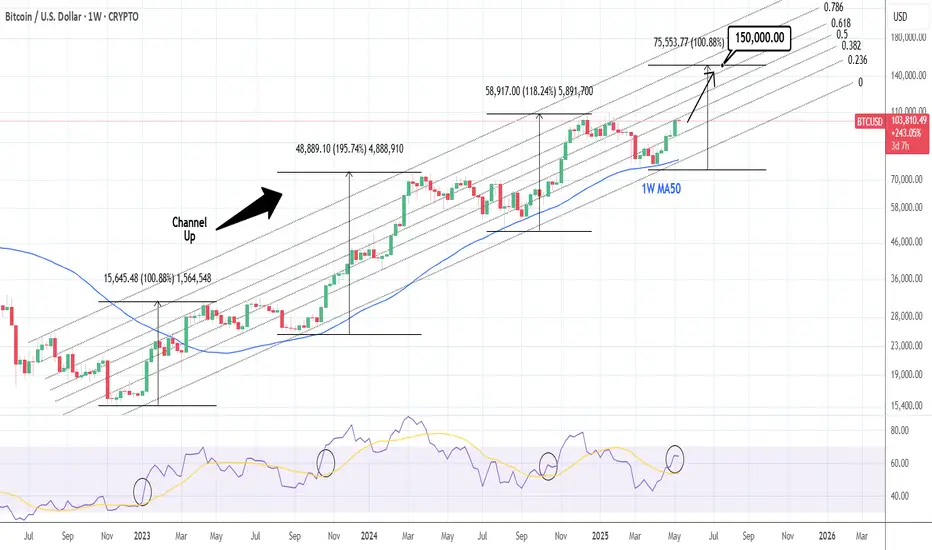
BITCOIN This Cycle's peak zone is $150k - $200k.Bitcoin (BTCUSD) is extending its gains week after week since the April 07 bottom on the 1W MA50, which as we've analyzed extensively its a new Higher Low launchpad for the new (current) Bullish Leg, the way it's been consistently doing on the Higher Lows trend-line since the start of this Bull Cycle.
It's in fact the very same Higher Lows trend-line it had during both previous Cycles, which ended up peaking on the Logarithmic Growth Curve's (LGC) top 2 zones (red), breaking also above the 2 SD above band (orange) of the Mayer Multiple Bands (MMB).
This time the price has 'only' broken above the 1 SD MMB (grey), while having breached into just the lower pink LGC zone. This highlights the theory of Diminishing Returns but at the same time also shows the strong upside potential of the market while subject to these conditions.
So assuming it won't hit by the end of this Cycle the 2 SD MMB nor the top 2 zones of the LGC, the bad case scenario seems to be topping the lower pink LGC zone and the good case scenario topping the upper pink LGC zone. Those two give a profit taking range of 150 - 200k respectively and based on the Sine Waves, we should peak around October 2025.
Is that your profit taking zone as well for this Cycle? Feel free to let us know in the comments section below!
-------------------------------------------------------------------------------
** Please LIKE 👍, FOLLOW ✅, SHARE 🙌 and COMMENT ✍ if you enjoy this idea! Also share your ideas and charts in the comments section below! This is best way to keep it relevant, support us, keep the content here free and allow the idea to reach as many people as possible. **
-------------------------------------------------------------------------------
💸💸💸💸💸💸
👇 👇 👇 👇 👇 👇
THETA Token Is In A Larger Flat CorrectionTheta Token with ticker THETAUSD made a deeper retracement in the last year, but it’s actually still above 2023 lows, so it can still be a larger regular 3-3-5 A-B-C flat correction in play. After recent projected five-wave impulse into wave (C) of a three-wave (A)(B)(C) decline in blue wave B, it can be now on the way back to March 2024 highs for blue wave C, which could be a five-wave impulsive cycle. Currently, it can be still unfolding a lower-degree five-wave impulse into wave (1), so more upside is expected for wave (3), especially if breaks above 1.74 bullish level, just be aware of wave (2) pullback.
Theta Token (THETA) is the native cryptocurrency of the Theta Network, a blockchain-powered platform designed for decentralized video streaming and content delivery. It aims to improve the efficiency and cost of streaming by allowing users to share bandwidth and computing resources on a peer-to-peer basis.

TradeCityPro | INJUSDT Best Position Among Altcoins! 👋 Welcome to TradeCityPro Channel!
Let’s dive in and analyze one of my favorite coins in the cryptocurrency space, INJ, which is showing strong potential. We’ll check the new entry triggers together.
🌐 Overview Bitcoin
Before starting the analysis, I want to remind you again that we moved the Bitcoin analysis section from the analysis section to a separate analysis at your request, so that we can discuss the status of Bitcoin in more detail every day and analyze its charts and dominances together.
This is the general analysis of Bitcoin dominance, which we promised you in the analysis to analyze separately and analyze it for you in longer time frames.
📊 Weekly Time Frame
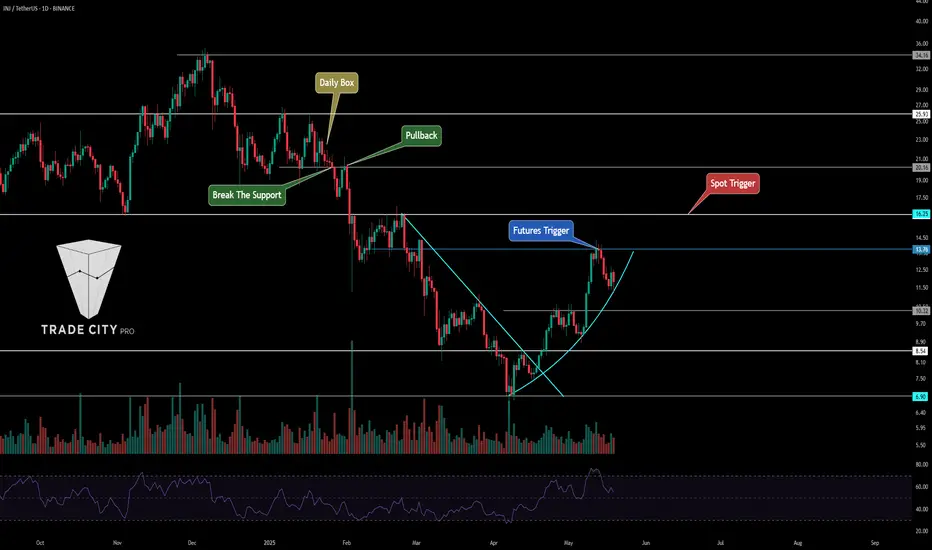
On the weekly time frame, I see that the seventh period is stable, INJ, and compared to the majority of altcoins that have their own low price levels, it is in a better space and is engaged in its own supports!
After breaking the primary trend ceiling, namely 9.28, we experienced a sharp upward movement and formed a historical ceiling at $53, and after forming a distribution box and breaking the important floor of 16.20 and pulling back to it, we experienced a continued decline.
Currently, we’ve bounced from the key support at 6.54 and experienced a 90% move, which highlights the importance of this resistance. If we form a higher low above 6.54, the 13.54 trigger will be excellent for a spot buy, and I’ll personally add another buy position at that level.
📉 Daily Time Frame
On the daily time frame, our trend is completely bearish as you can see, and the events are completely accompanied by the formation of a downward bottom and top, but we are likely to suffer for a while.
After getting rejected from 34.16 and forming a box between 20.16 and 25.93 and losing the bottom, it made a move and then while pulling back with low volume and the next conversion to red, it became an inverted Sharpe, we experienced a decline!
After breaking the daily trendline and activating its trigger at 8.54, we saw a move and got stuck at the 10.32 resistance. After forming a higher low, we moved up to 13.76. Currently, the 13.76 trigger, and even better, 16.25, can serve as our futures long and spot long triggers, respectively. We’re still holding the position opened at 10.32.
✍️ Final Thoughts
Stay level headed, trade with precision, and let’s capitalize on the market’s top opportunities!
This is our analysis, not financial advice always do your own research.
What do you think? Share your ideas below and pass this along to friends! ❤️
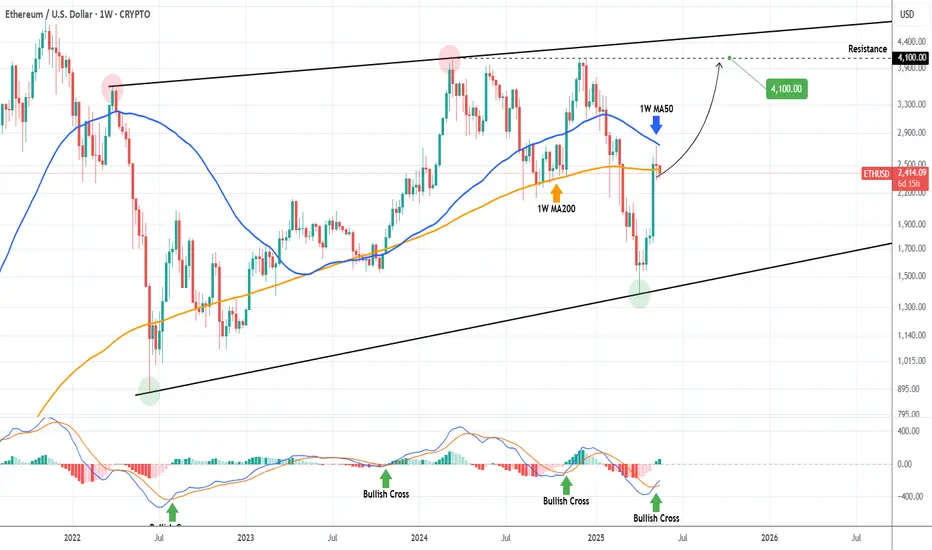
ETHEREUM Massive rejection on the 1W MA50. Will it break?Ethereum (ETHUSD) has seen its strongest 1-month rise in recent times since the April 07 rebound and last week that stopped and got rejected exactly on the 1W MA50 (blue trend-line). This rebound is technically the new Bullish Leg of the multi-year Rising Wedge.
The 1W MA50 turned into a Resistance when it last broke on the week of January 27 2025, so almost 4 months ago. Once it breaks and closes a 1W candle above it, we can continue to expect the bullish trend to continue by at least as much as the rise below it (that happened in late 2024).
Technically for now, if it breaks, the upside is limited by the 4100 Resistance, so that will be our Target in that event.
-------------------------------------------------------------------------------
** Please LIKE 👍, FOLLOW ✅, SHARE 🙌 and COMMENT ✍ if you enjoy this idea! Also share your ideas and charts in the comments section below! This is best way to keep it relevant, support us, keep the content here free and allow the idea to reach as many people as possible. **
-------------------------------------------------------------------------------
💸💸💸💸💸💸
👇 👇 👇 👇 👇 👇
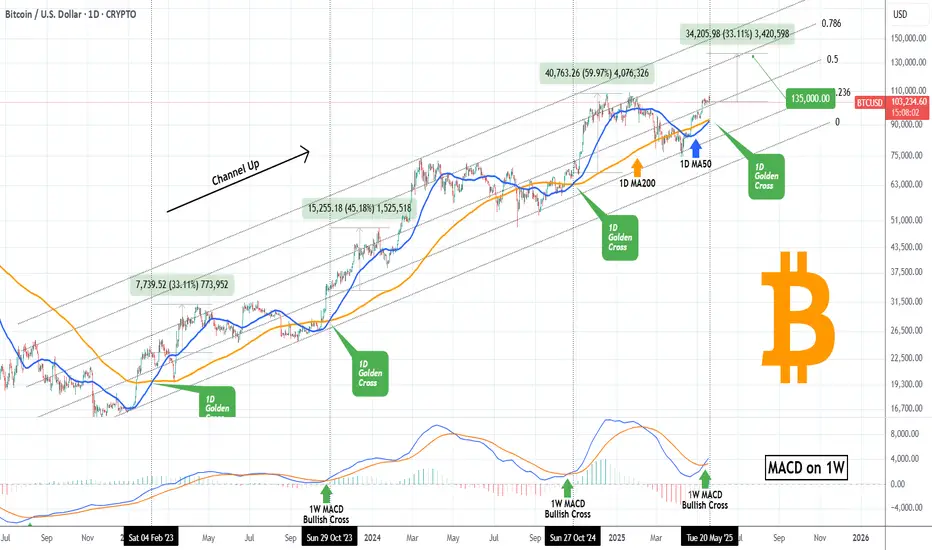
BITCOIN forming 1st 1D Golden Cross in 7 months! New ATH ahead??Bitcoin (BTCUSD) is about to form its first Golden Cross on the 1D time-frame in 7 months (since October 27 2024). This comes with the price very close to its $109k All Time High (ATH), following a relentless rebound and recovery from the Trade War correction.
Within the Bull Cycle's 2.5-year Channel Up, all 1D Golden Crosses have delivered higher prices instantly and the minimum % rise one has given before a new 1D MA50 (blue trend-line) pull-back, has been +33.11%.
This gives us an immediate Target of $135000 and is very much in line with a number of previous projections that the date show within this Target Region. Notice also how on all 3 last 1D Golden Crosses, a 1W MACD Bullish Cross precedes it. Basically that is the double confirmation of the medium-term bullish extension.
So do you think this 1D Golden Cross is such a strong buy signal and if yes, is $135k the bare minimum Target short-term? Feel free to let us know in the comments section below!
-------------------------------------------------------------------------------
** Please LIKE 👍, FOLLOW ✅, SHARE 🙌 and COMMENT ✍ if you enjoy this idea! Also share your ideas and charts in the comments section below! This is best way to keep it relevant, support us, keep the content here free and allow the idea to reach as many people as possible. **
-------------------------------------------------------------------------------
💸💸💸💸💸💸
👇 👇 👇 👇 👇 👇
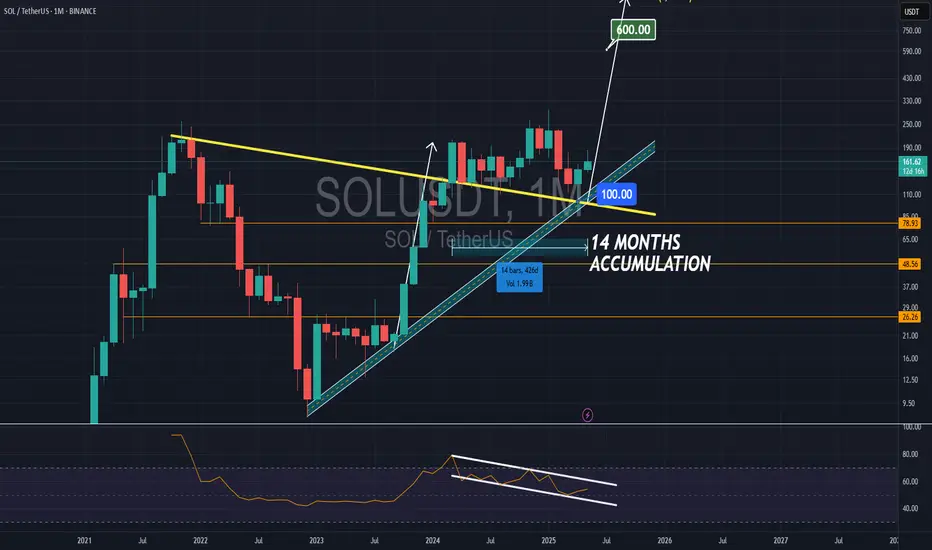
SOLANA 14Months AccumulationSOLANA had a rally from $20 to $190 , and now for 14 Months is accumulating above the strong support at $100.
As the RSI ON Monthly is playing inside a falling channel, upside movement for SOL in the coming months to about $600 is very likely IMO.
Deeper retracement is possible. 104-105.2 for short entryMorning folks,
So, last setup worked just partially - action started from 101K as suggested but BTC completed only 1.27 butterfly target, showing sharp reversal.
Current reversal is important because market is neither on some target, resistance or overbought. It means that reversal is driven by external factors. Although our long-term bullish view is still valid, with "at least" 110K target, the road to the target might be bumpy, with moderate pullback first.
It means that right now weekly/daily traders should sit on the hands and wait when retracement will be over. While daily/intraday traders could consider short entry from 104-105.2K resistance area by our view.

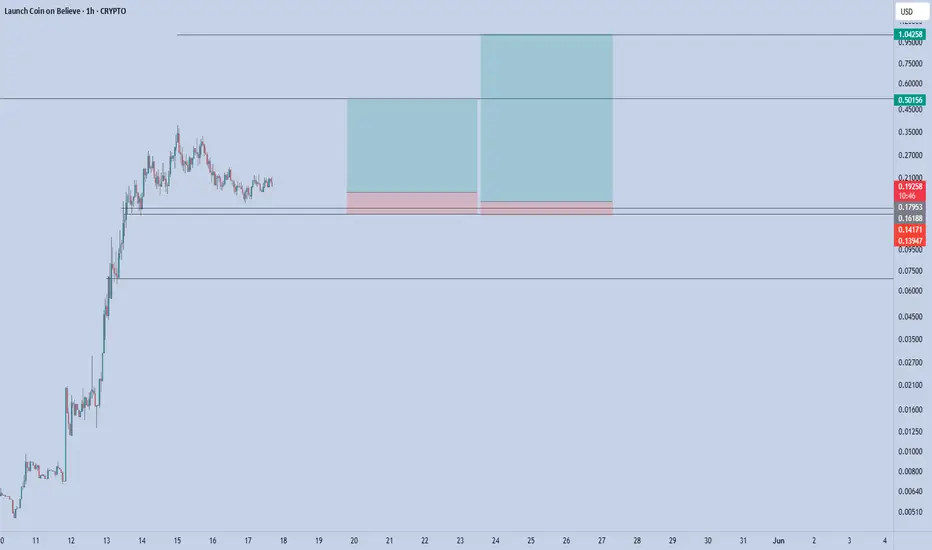
LAUNCHCOIN - New TrendKeep an eye on Launch Coin. it could be the next trend in the making.
LAUNCHCOIN
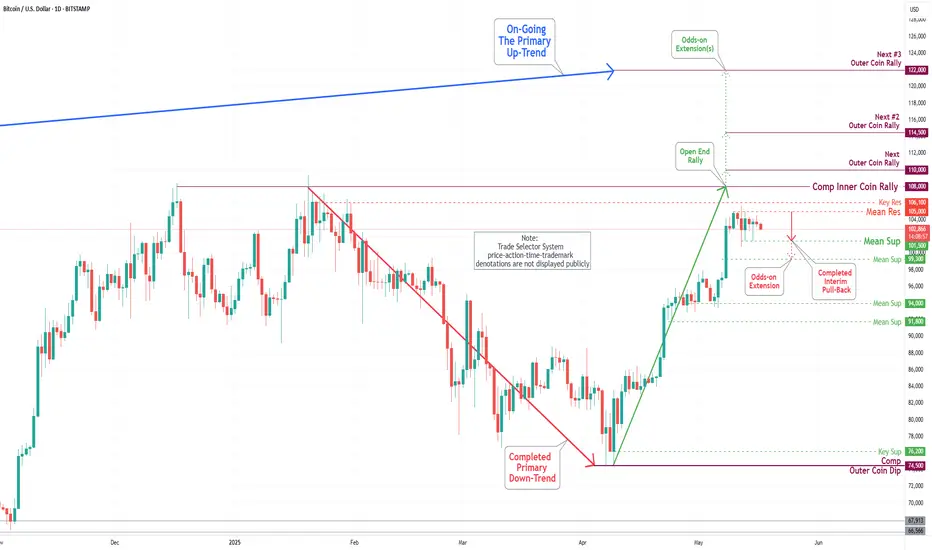
Bitcoin(BTC/USD) Daily Chart Analysis For Week of May 16, 2025Technical Analysis and Outlook:
During this week's trading session, Bitcoin has remained tightly bound within our Mean Resistance level of 104000 and is positioned to retest the lower target identified as Mean Support at 99300. There exists a possibility of a further decline toward an additional Mean Support target at 94000. Nonetheless, it is crucial to recognize the potential for upward momentum from the current level, which may lead to a challenge of the Key Resistance at 106100. This could culminate in a retest of the previously established Inner Coin Rally at $108,000.
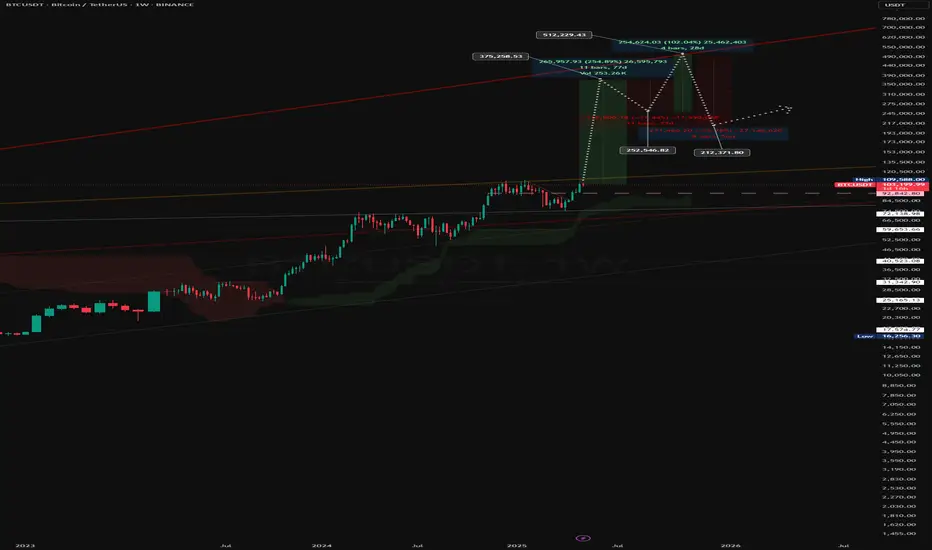
BTCUSDT: The ‘Parabolic Channel’ Play – $250 K to $500 K … then?⚙️ Chart Specs
Ticker / Pair: BTCUSDT
Time-Frame: 1W (log scale)
Indicators: Ichimoku Cloud (default), 7-year logarithmic channel, long-term trend-lines & Fib extensions
Date of publish: 17 May 2025
1️⃣ Macro Context
Bitcoin just printed a decisive weekly close above the mid-line of its 2017-2025 log channel while the Ichimoku Cloud has flipped full-bull (span A > span B). Post-2024 halving supply shock + macro liquidity rotation = strong tail-wind.
2️⃣ Projected Path
Phase Target zone % from breakout Key confluence
Break & sprint $255-270 K ~+140 % Vacuum above former ATH; minimal supply
Euphoria stretch $375 K ~+250 % Channel ceiling + 2.0 Fib
Blow-off wick $500-520 K ~+380 % 2.618 Fib extension + typical overshoot
Dashed white arrows on the chart sketch the base-case impulse and an optional “melt-up” extension.
3️⃣ Post-parabola Retrace
Historical cycles point to a -50 ~ -60 % draw-down once the upper red rail is tagged. I’m watching:
$255-250 K → first liquidity pocket / mid-channel
$215-210 K → 0.5 Fib retrace of the entire move
Either zone could reset weekly momentum while preserving the uptrend.
4️⃣ Invalidation Levels
Weekly close < $92 K → breakout failure → bias flips neutral, potential slide to red mid-line ~$75 K.
Close below channel base $60 K → macro thesis void, shift to bear bias.
5️⃣ Illustrative Trade Plan (not financial advice)
Leg Entry TP(s) Stop
Impulse swing Weekly close > $120 K $255 K / $375 K Weekly close < $92 K
Blow-off punt Break > $375 K on volume Trail toward $500 K 2-week trailing low
Retrace reload Bullish SFP at $255-210 K Ride next cycle Close < $200 K
📝 Take-aways
Base target sits in the $250 K region; exuberant extension eyes $500 K.
Expect aggressive mean reversion once the upper rail is hit.
Clear invalidations help keep emotions in check amid extreme volatility.
⚠️ This is an educational study,
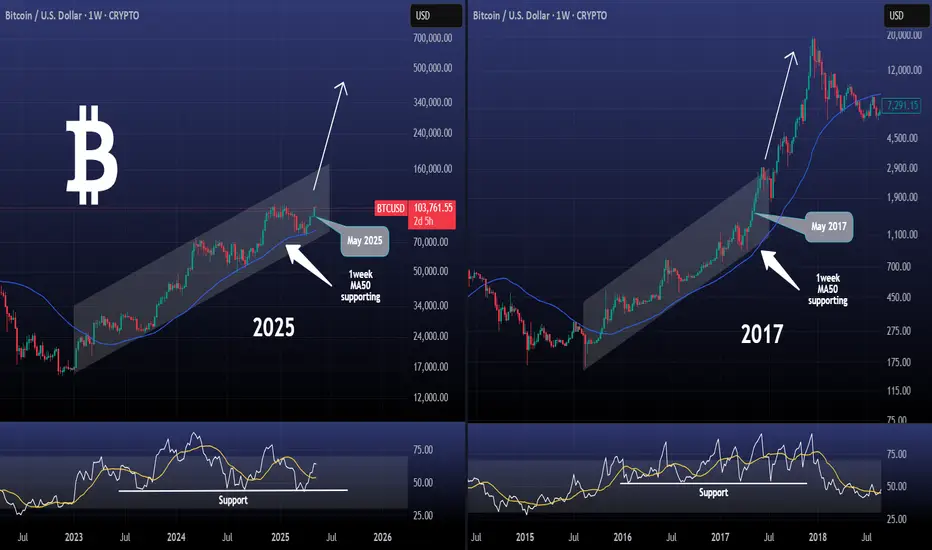
BTCUSD Can it do this one more time?Bitcoin / BTCUSD is on a strong 1week MA50 rebound, while staying inside the Channel Up from the Cycle bottom and holding the 1week RSI Support.
Last time it did that was during the 2015-2017 Bull Cycle.
In fact it was May 2017 when the price started rising aggressively and eventually broke above the Channel Up into a relentless parabolic rally until the end of the year.
With the Cycle seemingly identical, do you think Bitcoin can do this one more time?
Follow us, like the idea and leave a comment below!!
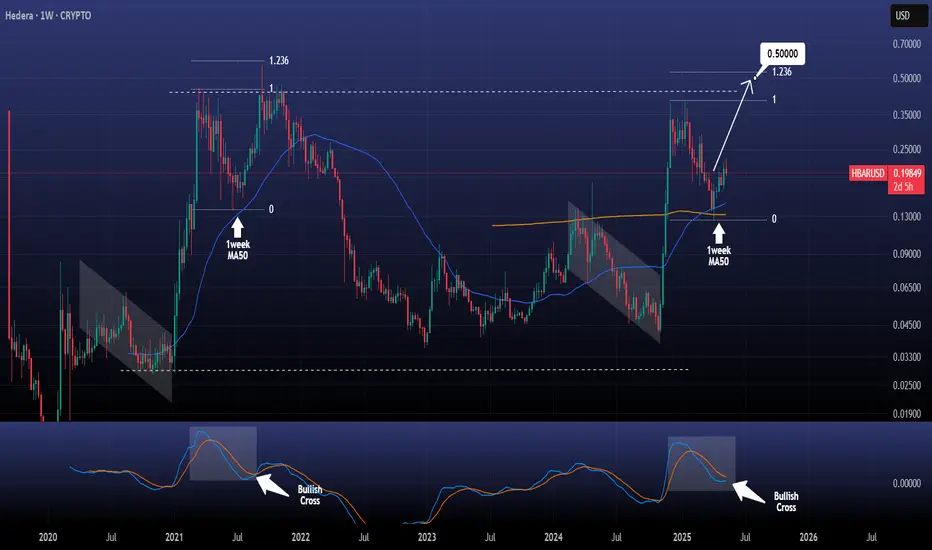
HEDERA Not high hopes. Upside is limited.Hedera / HBARUSD is on a 1week MA50 rebound with the 1week MACD close to a Bullish Cross formation.
This is the very same pattern it followed near the end of the previous Cycle on the June 21st 2021 rebound.
See the identical 1week MACD patterns, even the similar price structure on the 2020 and 2024 Bull Flags that initiated parabolic rallies.
Actually HBAR topped 2 weeks after the 1week MACD formed the Bullish Cross. The Bearish Divergence there was evident.
As a result, since the previous Cycle topped on the 1.236 Fibonacci extension, we expect HBAR to rise to 0.5000 max. Nothing like the parabolic rally it had after the recent U.S. elections.
Follow us, like the idea and leave a comment below!!
PEPEUSD broke and closed last week above its 1week MA50.Inside its historic Channel Up, this is the earliest confirmed buy signal and last time it priced the bottom of the pattern, confirming the start of the new bullish leg.
Note also that it just formed a Bullish Cross on the 1week MACD.
Last time the whole wave peaked at a massive +2756%. Repeating that gives 0.0001400 and that can be achieved by the end of the year.
Follow us, like the idea and leave a comment below!!

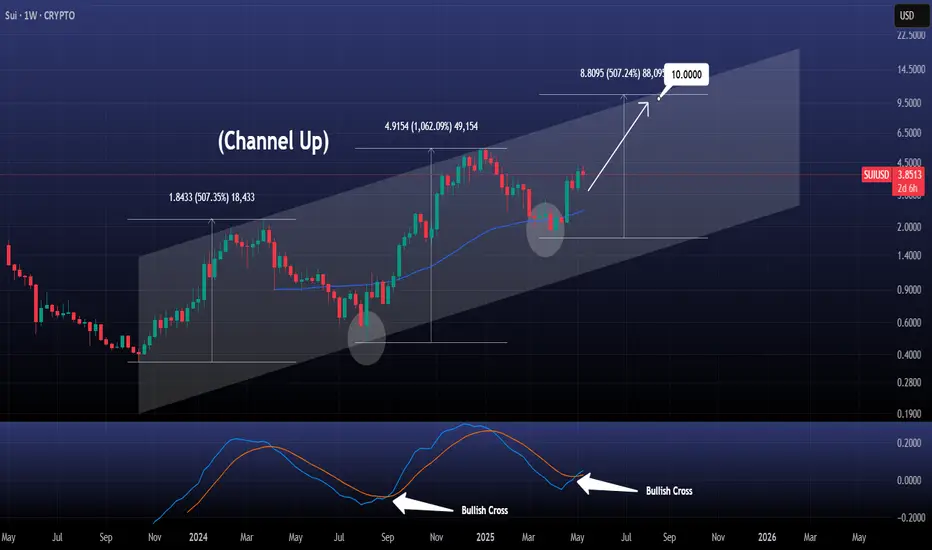
SUIUSD Massive Bullish Cross was just completed!SUI just made a Bullish Cross on the 1W timeframe, its 2nd ever.
The first one was on September 2nd 2024, 4 weeks after the price bottomed on the long term Channel Up and rebounded.
The latest Cross was also formed 4 weeks after the April 7th 2025 bottom and even though we don't expect a similar +1062% rise, we do expect the growth that the first Bullish Leg had (+507.35%).
Target $10.000 right at the top of the Channel Up.
Follow us, like the idea and leave a comment below!!
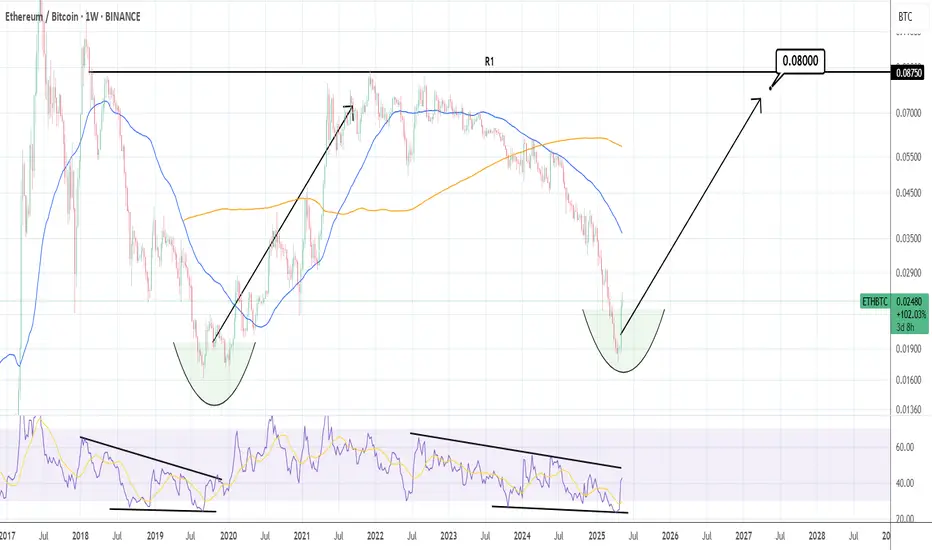
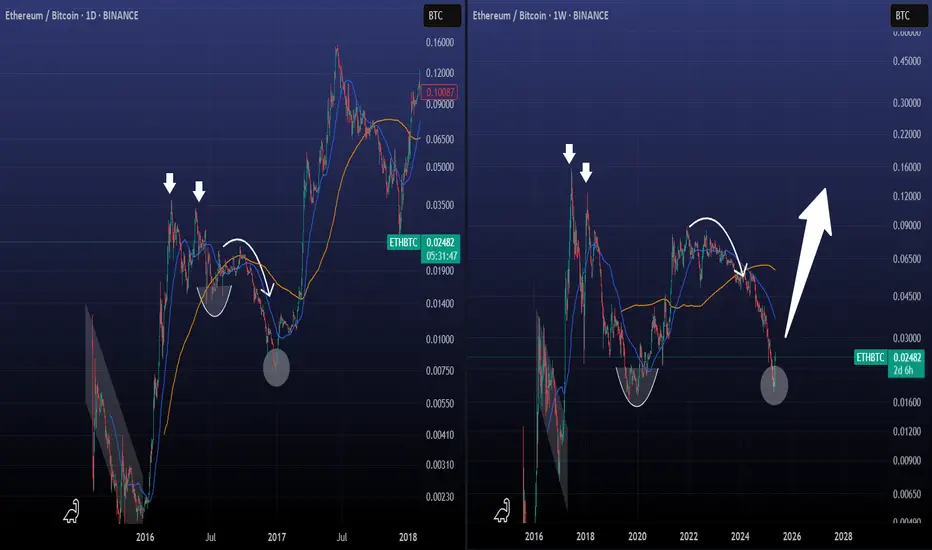
ETHBTC Is it repeating its first Cycle?I know that the timeframes are not the same but don't tell me that the structure between then and now isn't similar.
The biggest difference is that in 2016 ETHBTC made a deeper low than now, but the current rebound is showing signs that we might have a similar parabolic rise.
Now will that be enough to give a new All Time High?
We will see, but don't tell me that this can't target 0.0900 byu the end of the year.
Follow us, like the idea and leave a comment below!!
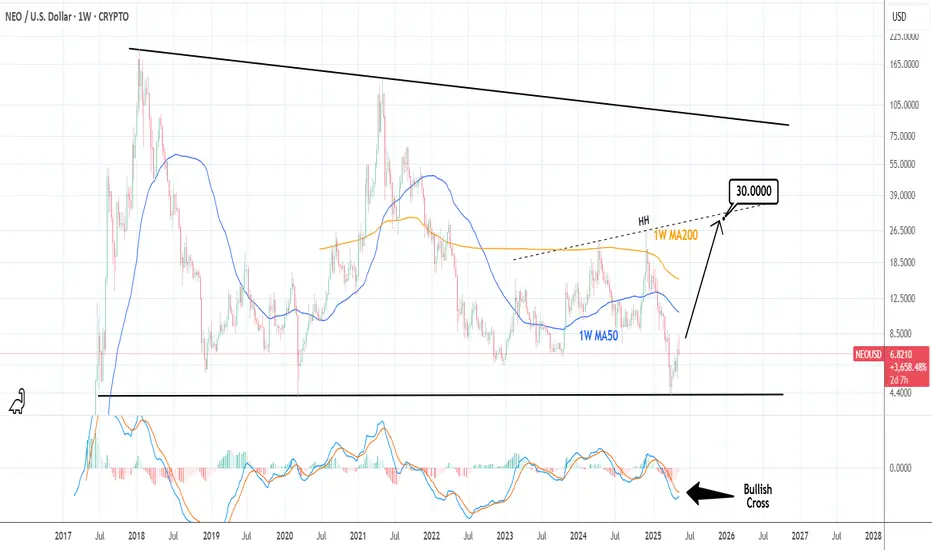
NEOUSD: Minimum target for the end of this Cycle $30.Neo turned marginally bullish on its 1D technical outlook (RSI = 56.743, MACD = 0.356, ADX = 25.407) as it has validated the start of the new bullish wave, rebounding on the same level as it did on March 9th 2020. This is the least aggressive Bull Cycle for new but the presence of a HH trendline implies that a Cycle high can be minimum made on it. With the 1W MACD about to form a Bullish Cross, we expect the HH to get hit by the end of the year (TP = 30.000).
## If you like our free content follow our profile to get more daily ideas. ##
## Comments and likes are greatly appreciated. ##
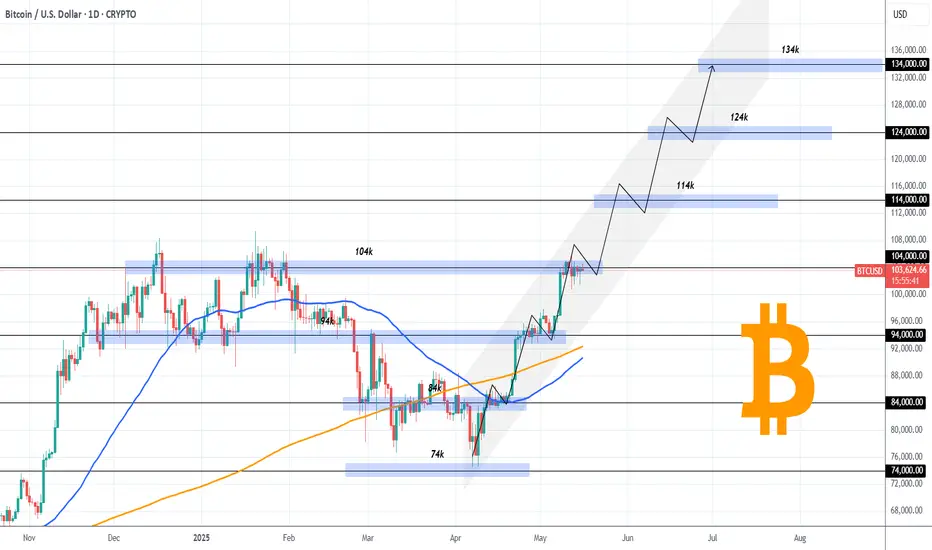
BITCOIN Stairway to 134k.Bitcoin (BTCUSD) is unfolding a very interesting pattern since its April 07 bottom. That was at $74500 and since that level, it has been consistently targeting all 10k intervals above it: From 74k to 84k, 94k and is now on 104k.
Once it hit all those levels, the price consolidated, forming a very structured Channel Up. Now, the Channel Up may not hold forever but this consistency gives us the idea that it can continue targeting all those levels above it: 114k, 124k, 134k. If this pattern continues to hold for as much time as it has since the bottom, then we may see $134k by late June/ early July.
Do you think it is possible to stay this consistent for that long? Feel free to let us know in the comments section below!
-------------------------------------------------------------------------------
** Please LIKE 👍, FOLLOW ✅, SHARE 🙌 and COMMENT ✍ if you enjoy this idea! Also share your ideas and charts in the comments section below! This is best way to keep it relevant, support us, keep the content here free and allow the idea to reach as many people as possible. **
-------------------------------------------------------------------------------
💸💸💸💸💸💸
👇 👇 👇 👇 👇 👇
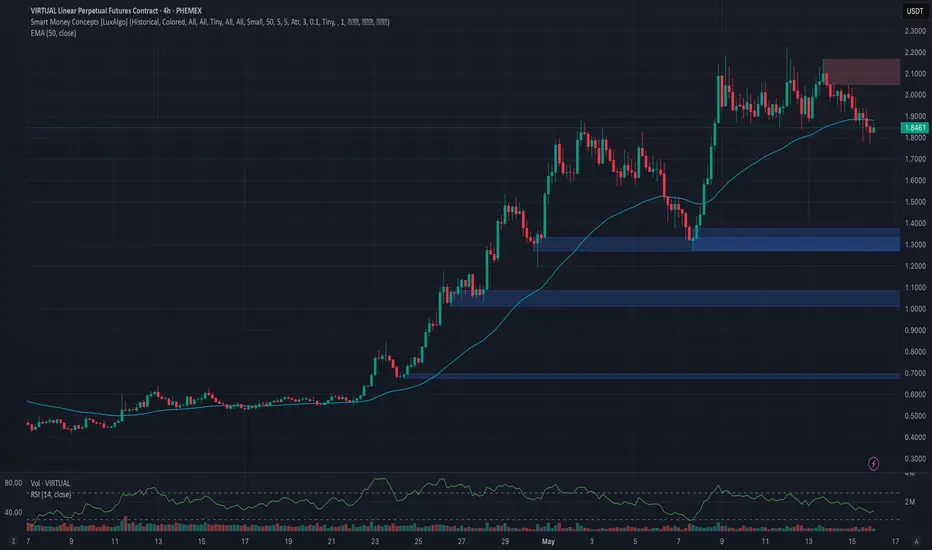
Phemex Analysis #81: Pro Tips for Trading VIRTUAL In the rapidly evolving landscape of cryptocurrency, Virtuals Protocol ( PHEMEX:VIRTUALUSDT.P ) has emerged as a notable player, particularly within the AI and metaverse sectors. As of May 16, 2025, VIRTUAL is trading at approximately $1.85, with a 24-hour trading volume of around $280 million and a market capitalization of $1.21 billion. This positions VIRTUAL as a significant asset within the crypto market, reflecting growing investor interest.
Recent developments have further bolstered VIRTUAL's prominence. The introduction of veVIRTUAL, a vote-escrowed token system launched on May 13, 2025, incentivizes long-term staking and governance participation. Additionally, expansion to the Solana blockchain and partnerships with initiatives such as the AI Hackathon highlight Virtuals Protocol's commitment to cross-chain development and community engagement.
Given these dynamics, traders are keen to understand potential trajectories for VIRTUAL's price movement. Let's explore several possible scenarios to guide your trading strategies.
Possible Scenarios
1. Bullish Continuation
VIRTUAL has demonstrated impressive growth, achieving a 234% increase over the past month. If this momentum continues, reinforced by ongoing developments and increased adoption, VIRTUAL may test critical resistance levels around $2.50 and potentially approach its all-time high of $5.07.
Pro Tips:
Entry Strategy: Consider entering positions on confirmed breakouts above key resistance levels such as $2.16, particularly if accompanied by high trading volume.
Risk Management: Implement stop-loss orders near recent swing lows, such as $1.76, to protect your positions from sudden market reversals.
2. Consolidation Phase
After significant price movements, VIRTUAL may enter a consolidation phase, trading within a defined range as the market absorbs recent gains. Such periods can provide opportunities for range-bound trading strategies or accumulation for long-term growth.
Pro Tips:
Identify Key Levels: Monitor key support and resistance zones, notably $1.27 (support) and $2.16 (resistance), to effectively execute buy and sell orders within the trading range.
Patience: Avoid overtrading during consolidation phases. Wait for clear breakout signals before making significant trading decisions.
3. Bearish Reversal
Despite recent successes, external factors such as broader market downturns or unforeseen negative news could trigger a bearish reversal. If VIRTUAL falls below critical support levels, notably $1.50, further declines could follow.
Pro Tips:
Short Positions: Experienced traders might consider short-selling strategies to profit from potential declines, ensuring they maintain a clear exit plan.
Long-Term Accumulation: For long-term investors, significant price dips could represent buying opportunities. Watch key support levels such as $1.27, $1.00, and $0.67 for potential entry points to accumulate VIRTUAL at lower valuations.
Conclusion
Virtuals Protocol's innovative approach to integrating AI within the blockchain ecosystem positions it as a compelling asset in the crypto market. While recent developments and price movements suggest potential for continued growth, traders must remain vigilant. Employing sound risk management and staying informed about ongoing developments is essential. By considering the scenarios outlined above, traders can navigate VIRTUAL's market dynamics with greater confidence and strategic insight.
Pro Tips:
Armed Your Trading Arsenal with advanced tools like multiple watchlists, basket orders, and real-time strategy adjustments at Phemex. Our USDT-based scaled orders give you precise control over your risk, while iceberg orders provide stealthy execution.
Disclaimer: This is NOT financial or investment advice. Please conduct your own research (DYOR). Phemex is not responsible, directly or indirectly, for any damage or loss incurred or claimed to be caused by or in association with the use of or reliance on any content, goods, or services mentioned in this article.
BTCUSD: This is a one way trip to $150k.Bitcoin is rising towards the overbought barrier on its 1D technical outlook (RSI = 68.126, MACD = 4169.000, ADX = 23.891) and that has rearely been a problem in the past as the market tends to thrive on overbought conditions. The minimum rally it delivered after a 1W MA50 rebound (like the one it is on now) has been +100%. TP = 150,000 by the end of summer.
## If you like our free content follow our profile to get more daily ideas. ##
## Comments and likes are greatly appreciated. ##
ETHBTC: Ethereum to gain massively against Bitcoin.Ethereum is overbought on its 1D technical outlook (RSI = 72.854, MACD = 228.230, ADX = 38.542) due to the rebound it initiated last week. Even though it is still on its very early stages, this rebound and statement of its strength is better viewed on the ETHBTC pair against Bitcoin. As you can see, ETHBTC bottomed on a level that it hasn't seen since January 6th 2020. The massive downtrend since 2023 is comparable to the one that started in 2018. Similar bottoms, similar 1W RSI sequences. We expect this rebound to be the main driver all the way to the 7 year Resistance level (R1). Traders of this pair can target 0.0800 on the long term.
## If you like our free content follow our profile to get more daily ideas. ##
## Comments and likes are greatly appreciated. ##