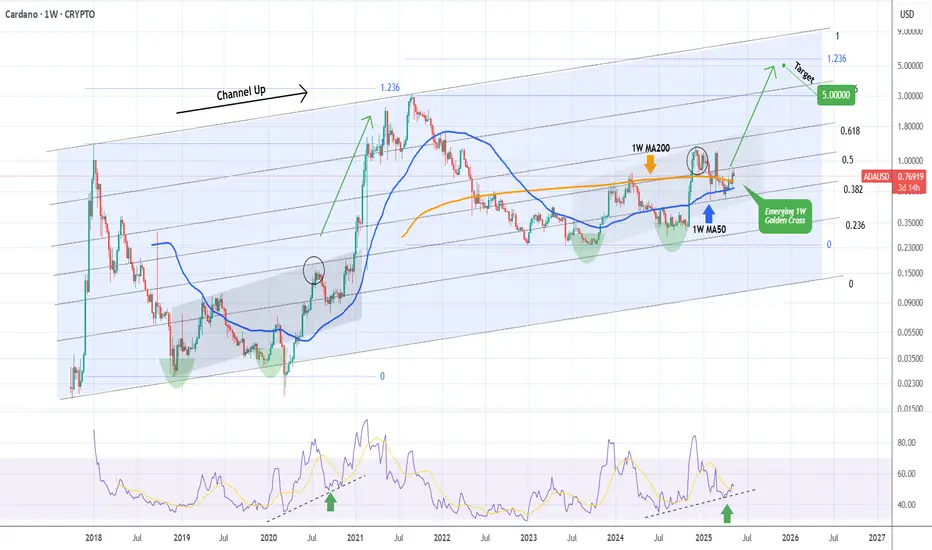
CARDANO about to form its first ever 1W Golden Cross!Cardano (ADAUSD) is far from dead as not only has it staged a rebound on its 1W MA50 (blue trend-line) but is also close to forming its first ever Golden Cross on the 1W time-frame. Technically this is a similar set-up to November 2020 right after ADA held its 1W MA50, made a Higher Low on its 1W RSI (like today) and started to rise.
This rise ended up forming the top of the 7-year Channel Up just below the 1.236 Fibonacci extension from the previous Cycle High. Basically this whole Bull Cycle has been identical to the December 2018 - December 2020 and right now it appears that the market has started the final parabolic rally.
If the pattern approaches the 1.236 Fib extension again, expect the Cycle to peak around $5.000.
-------------------------------------------------------------------------------
** Please LIKE 👍, FOLLOW ✅, SHARE 🙌 and COMMENT ✍ if you enjoy this idea! Also share your ideas and charts in the comments section below! This is best way to keep it relevant, support us, keep the content here free and allow the idea to reach as many people as possible. **
-------------------------------------------------------------------------------
💸💸💸💸💸💸
👇 👇 👇 👇 👇 👇
Cryptocurrency
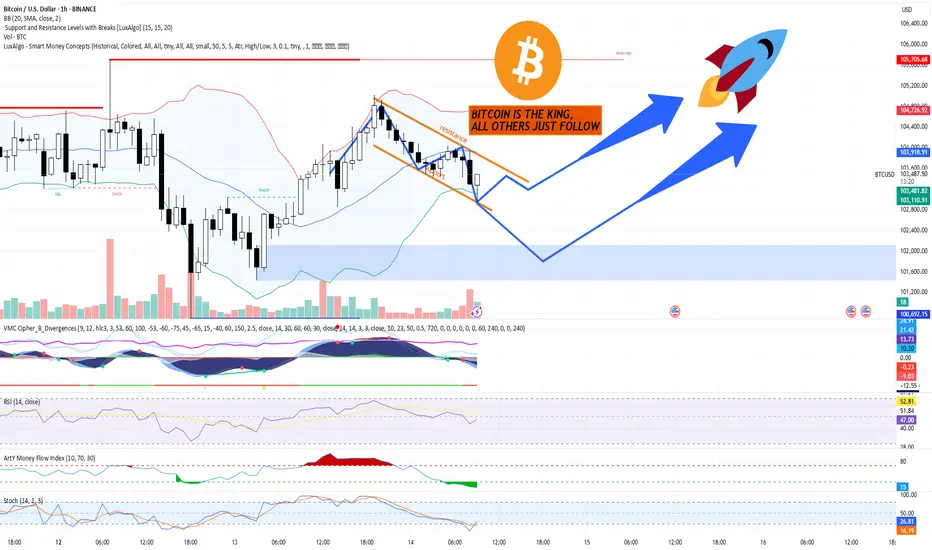
Technical Analysis – Bitcoin (BTC/USD) 1H Chart + TRADE PLANThe chart displays a symmetrical triangle pattern, which is a neutral continuation pattern often leading to a breakout in the direction of the prevailing trend.
The current price action is at the apex of the triangle, suggesting an imminent breakout.
The price is currently testing the lower trendline support, with a visible weakening momentum.
Indicators Analysis:
VMC Cipher B Divergences: Showing bearish momentum with continued red wave dominance and lack of significant bullish divergence.
RSI (14): Bearish territory at 32.51, approaching oversold but no bullish divergence visible.
Money Flow Index (MFI): At 28.90, indicating weak buying pressure, leaning toward bearish continuation.
Stochastic Oscillator (14, 3, 3): In the oversold zone (1.49), which could indicate a short-term bounce is possible, but not confirmed by other indicators.
Volume:
Note that the chart mentions volume data is unavailable. Confirmation on volume spikes during breakout is essential to validate any move.
Scenarios and Targets
Scenario 1 – Bullish Breakout (Less probable based on current conditions)
Break above triangle resistance (approx. 102,300 USD).
Target 1: 107,500 USD (Measured move from triangle height).
Target 2: 115,500 USD (Extended target based on historical breakout levels and Fibonacci projection).
Confirmation needed: Clear breakout with high volume and RSI recovery above 50.
Scenario 2 – Bearish Breakdown (More probable currently)
Break below triangle support (approx. 101,300 USD).
Immediate Target 1: 97,000 USD (Measured move from triangle height).
Target 2: 93,500 USD (Previous major support zone).
Confirmation needed: Hourly candle close below support zone and breakdown with increased volume, RSI falling below 30, Stochastic remaining oversold.
Trading Plan
Bias: Bearish unless invalidated by bullish breakout confirmation.
Entry Strategy:
Aggressive short entry: On hourly candle close below 101,300 USD.
Conservative short entry: On confirmation below 101,000 USD with volume spike.
Stop-Loss:
Above 102,500 USD, invalidating the bearish thesis.
Take-Profit Zones:
TP1: 97,000 USD
TP2: 93,500 USD
Risk Management:
Max risk per trade: 1-2% of portfolio.
Monitor closely for fakeouts at the apex; symmetrical triangles are prone to false moves.
Alternative Strategy:
If bullish breakout occurs above 102,500 USD with RSI reclaiming 50, switch to a long setup with:
Stop Loss: Below 101,000 USD
TP1: 107,500 USD
TP2: 115,500 USD
Current indicators, price behavior, and chart pattern favor a bearish scenario.
Key to execution is waiting for confirmed breakout direction with volume confirmation, especially near the critical apex zone.
Stay adaptive, as symmetrical triangles can break either way, and false breakouts are common.

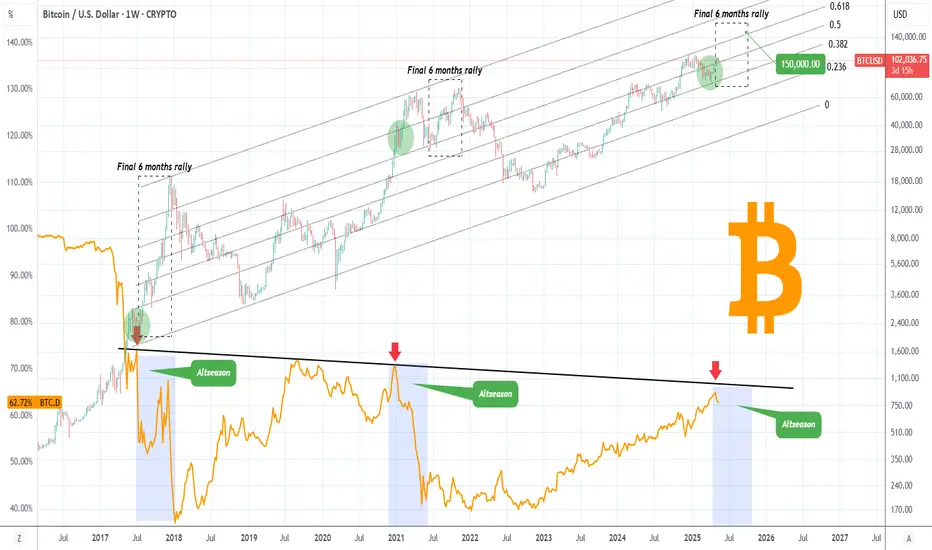
BITCOIN 's 'Final 6 months rally' kickstarts the Altseason!This isn't the first time we show you this chart but it couldn't be more relevant than today. We have established on previous analyses how Bitcoin (BTCUSD) has most likely started the final rally of its Cycle, historically the parabolic rally of the last 6 months of the Bull Cycle that ends with its Top.
The addition of today's analysis is that with Bitcoin Dominance (orange trend-line) approaching its 8-year Lower Highs trend-line, this 'Final 6 months rally' of BTC is what technically also starts the Altseason. This is when lower cap coins see massive gains compared to the high cap ones.
At the same time, we get one more confirmation of why a $150k BTC Target is realistic, as by the end of 2025, this price would still be on the 0.618 Fibonacci level of the 8-year Fib Channel Up, a rather 'bad case' scenario based on this pattern.
So what do you think? Will BTC's Final 6 months rally spark a massive Altseason too? Feel free to let us know in the comments section below!
-------------------------------------------------------------------------------
** Please LIKE 👍, FOLLOW ✅, SHARE 🙌 and COMMENT ✍ if you enjoy this idea! Also share your ideas and charts in the comments section below! This is best way to keep it relevant, support us, keep the content here free and allow the idea to reach as many people as possible. **
-------------------------------------------------------------------------------
💸💸💸💸💸💸
👇 👇 👇 👇 👇 👇
101K to 110KMorning folks,
So, since Monday situation barely has changed. As we said - retracement should be small and we pointed 101K support area. 98K is also nice but it is a kind of vital area for this setup.
Now you could see everything goes great. Market is moving out of 101K.
Here is two shapes might be - immediate upside action by butterfly, or still, a bit deeper retracement in a way of "222" Buy. But anyway market has to stay above 98K to keep this scenario valid.
So let's see. By far everything looks very accurate and predictable.

TradeCityPro | VETUSDT The Best Entry Opportunity Awaits👋 Welcome to TradeCityPro Channel!
Let’s dive in and analyze one of the veteran coins in the cryptocurrency space, VET, which has a high potential for movement. Together, we’ll identify its entry triggers.
🌐 Overview Bitcoin
Before starting the analysis, I want to remind you again that we moved the Bitcoin analysis section from the analysis section to a separate analysis at your request, so that we can discuss the status of Bitcoin in more detail every day and analyze its charts and dominances together.
This is the general analysis of Bitcoin dominance, which we promised you in the analysis to analyze separately and analyze it for you in longer time frames.
📊 Weekly Time Frame
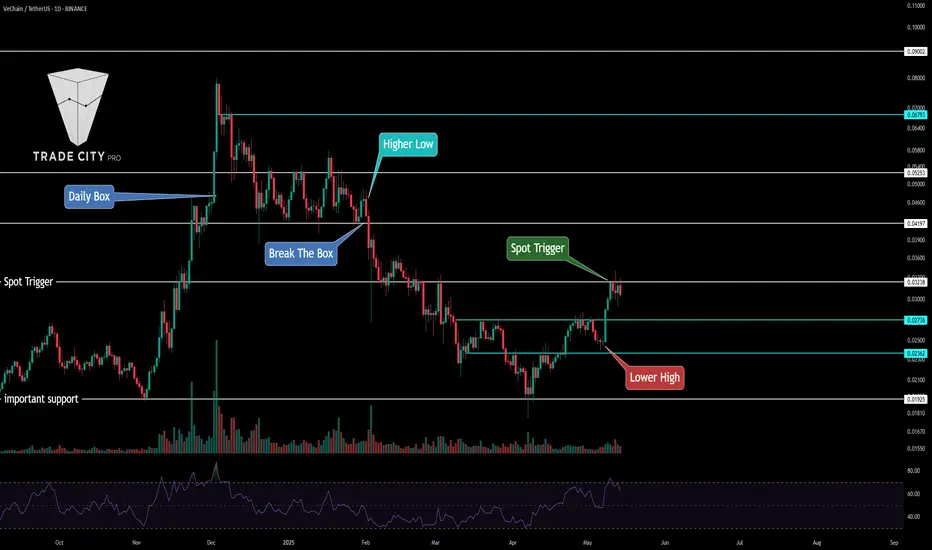
In the weekly time frame, VET is one of the coins that’s in a relatively good position compared to other altcoins. While most altcoins have recorded new lows, VET has never lost the 0.01430 level!
After being supported at 0.01922 and closing a green weekly candle, we experienced an upward move. Currently, we’re stuck at the resistance of 0.03176, and it seems we’re pulling back to this resistance.
📉 Daily Time Frame
In the daily time frame, after an upward wave that didn’t quite reach the 0.09 resistance, a fake candle occurred, and we entered a box between 0.04197 and 0.05253. Seller presence and a rejection from the middle of the box led to losing the 0.04197 support.
After breaking this support, we experienced a sharp decline. When we reached the 0.01925 support, the bearish momentum hit its lowest point, and we saw reactions from buyers, leading to an upward move.
Currently, we’re below the key resistance at **0.03233**. After breaking this level, we can expect a sharp upward move. You can take a position in both **futures and spot**, with the safest stop loss for your buy at 0.01925
✍️ Final Thoughts
Stay level headed, trade with precision, and let’s capitalize on the market’s top opportunities!
This is our analysis, not financial advice always do your own research.
What do you think? Share your ideas below and pass this along to friends! ❤️
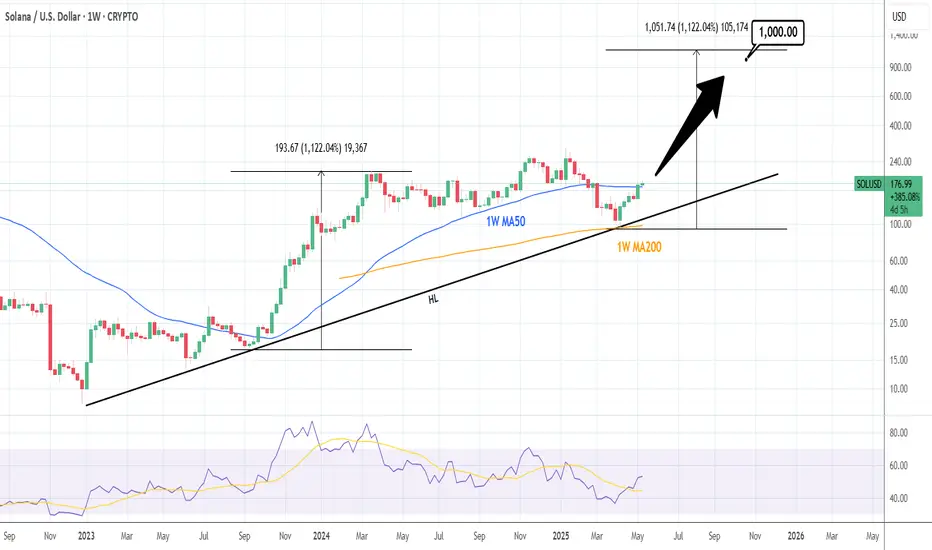
SOLUSD: Can it hit $1000?Solana is heavily bullish on its 1D technical outlook (RSI = 67.130, MACD = 11.423, ADX = 35.600) and just last week only crossed over its 1W MA50 again. This rebound started exactly on the 1W MA200, after holding the HL trendline of the Bull Cycle. Last time SOL crossed above its 1W MA50 after a HL, was on September 25th 2023 and a +1,122% rally unfolded. If macro and fundamentals assist, SOL can repeat this and reach the 1k mark (TP = 1,000).
## If you like our free content follow our profile to get more daily ideas. ##
## Comments and likes are greatly appreciated. ##
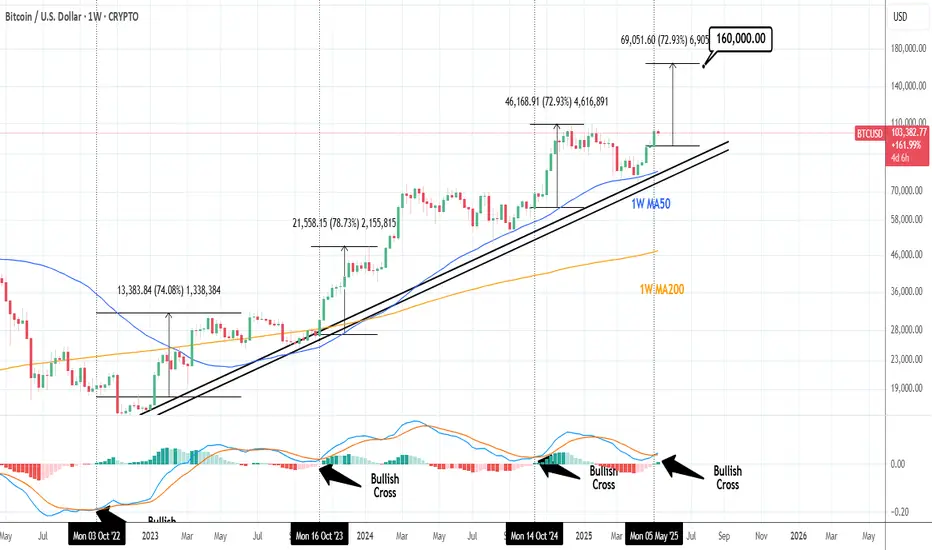
BTCUSD: The 1W MACD Bullish Cross eyes $160k.Bitcoin is on excellent bullish levels on its 1D technical outlook (RSI = 67.904, MACD = 4228.900, ADX = 24.411) and even better on 1W where the MACD just formed a Bullish Cross. All such formations since October 2022 led to at least a + 72.93% rally from the moment of the formation. This suggests that Bitcoin's next high on this Channel Up pattern can be around $160,000.
## If you like our free content follow our profile to get more daily ideas. ##
## Comments and likes are greatly appreciated. ##
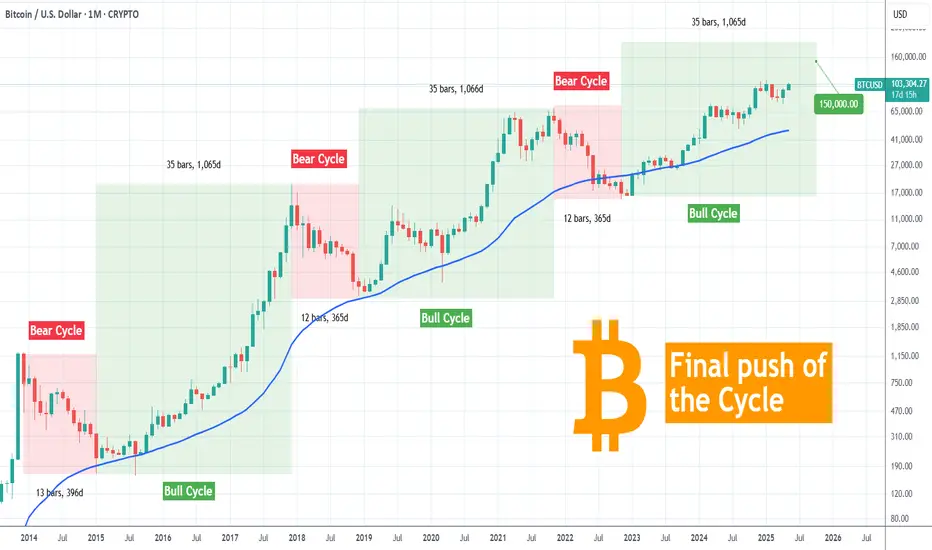
Bitcoin Is Final Stages Of A Bullish CycleBitcoin is still bullish and the rise looks impulsive on the monthly chart, but cyclically, we are in the late stages of a 3-year bull run that can end this year, ideally around October 2025. There’s actually still about 5 months of a bullish trend to complete 35 monthly bars, like in previous bullish cycles, so we may easily see more gains this year from a technical perspective.
Next year we should be aware of a bear market that can last at least 12 monthly bars or one year.
Technical Analysis of Bitcoin (BTC/USD) ON BINANCE + TRADE PLANTechnical Analysis of Bitcoin (BTC/USD)
Market Trend and Chart Structure:
The price of Bitcoin is in a consolidation phase as shown in the descending channel pattern formed by the resistance and support lines.
The market is moving within this range, but there is a strong possibility of a breakout to the upside based on the bullish divergence forming on the indicators and the overall market sentiment.
The chart also shows Bollinger Bands (BB), which are in a squeeze, signaling a potential breakout. Typically, this indicates that volatility is low, and the price could move sharply in either direction once the bands break.
Key Indicators and Signals:
MACD: The MACD indicator is showing a bullish crossover, which indicates the possibility of a trend reversal to the upside.
RSI (Relative Strength Index): Currently at 45.78, indicating that the market is neither overbought nor oversold. This suggests that Bitcoin is in a neutral zone, but with bullish signals from other indicators, an upward move seems likely if momentum continues to build.
ArtY Money Flow Index: The Money Flow Index is showing green bars, suggesting that capital is flowing into Bitcoin, which supports the bullish outlook.
Stochastic RSI: The stochastic is in the oversold region (currently at 14.99), which usually signals a potential reversal to the upside.
Resistance and Support Levels:
Resistance: The primary resistance level is located at $105,705. A break above this level would indicate a strong upward move.
Support: The primary support level is around $101,600. If the price reaches this level and holds, it could act as a potential bounce point for a reversal.
Trading Strategy and Plan:
Entry Strategy:
Buy Entry: Enter a long position if the price breaks above the $104,700-$105,705 range, indicating a breakout above resistance. A confirmation from the MACD and RSI would add strength to this signal.
Stop Loss: Set a stop-loss order at $101,000, below the key support, to manage risk if the market reverses unexpectedly.
Target/Exit Strategy:
Take Profit Target: A good target is at the $110,000 level, where Bitcoin could face another resistance. A more aggressive target could be at $115,000, but this would require a continuation of the bullish momentum.
Trailing Stop: Use a trailing stop as Bitcoin continues to move upward to secure profits if the price continues to climb without retracing.
Risk Management:
Maintain a risk-to-reward ratio of at least 1:3, meaning you should aim for profits that are at least three times the amount of risk you take. This will ensure better risk management in case the market reverses unexpectedly.
Monitor the market sentiment closely. Bitcoin's price movements can be highly volatile, so being ready to adjust stop-loss and take-profit levels is essential for successful trading.
Bitcoin is showing positive signs of breaking to the upside, with support from key technical indicators such as bullish MACD crossovers, oversold stochastic levels, and a neutral RSI. It’s essential to monitor the breakout above the $104,700-$105,705 level, which could signal a strong upward move. However, traders should use proper risk management techniques, such as setting stop-loss orders and managing position sizes carefully.
Always stay updated with market news and adjust your strategy based on any significant news or changes in the overall market sentiment.
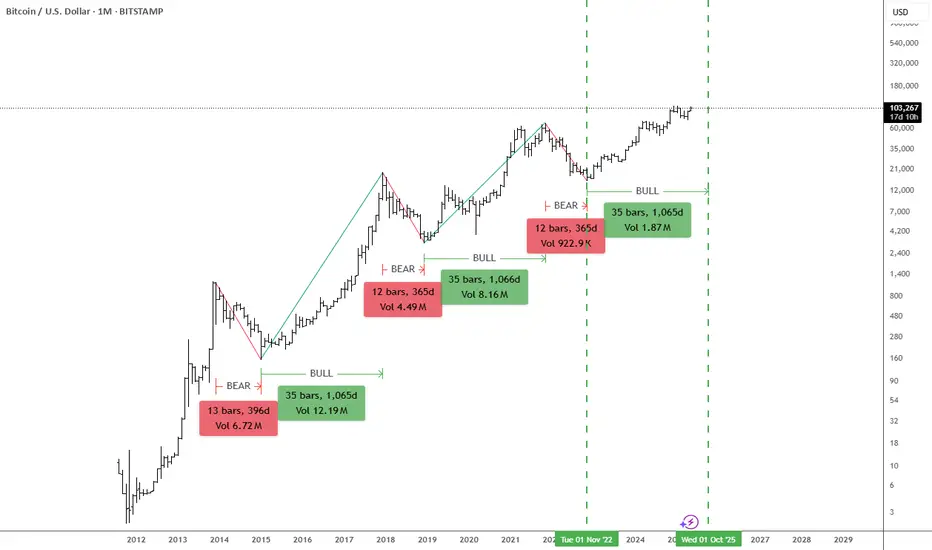
BITCOIN making the FINAL PUSH! Only 6 months of BULL left!Bitcoin (BTCUSD) has had n astonishing symmetry among its Cycles in the past 11 years, as all three of the Bear Cycles have had identical durations (13 and 12 months twice) as well as the two Bull Cycles (both 35 months).
As a result, there is no reason to assume otherwise for the current Bull Cycle as well, which if it also lasts for 35 months, it will peak in October 2025. This means that BTC might 'only' have another 6 months of Bull Cycle ahead of it but that's not bad news as historically this phase tends to be the most aggressive part.
Even if it's not, various studies we've done before point out that a price around $150k would be more than fair and practically a 'pessimistic' scenario for the Cycle High.
Do you think that will be the case? Feel free to let us know in the comments section below!
-------------------------------------------------------------------------------
** Please LIKE 👍, FOLLOW ✅, SHARE 🙌 and COMMENT ✍ if you enjoy this idea! Also share your ideas and charts in the comments section below! This is best way to keep it relevant, support us, keep the content here free and allow the idea to reach as many people as possible. **
-------------------------------------------------------------------------------
💸💸💸💸💸💸
👇 👇 👇 👇 👇 👇
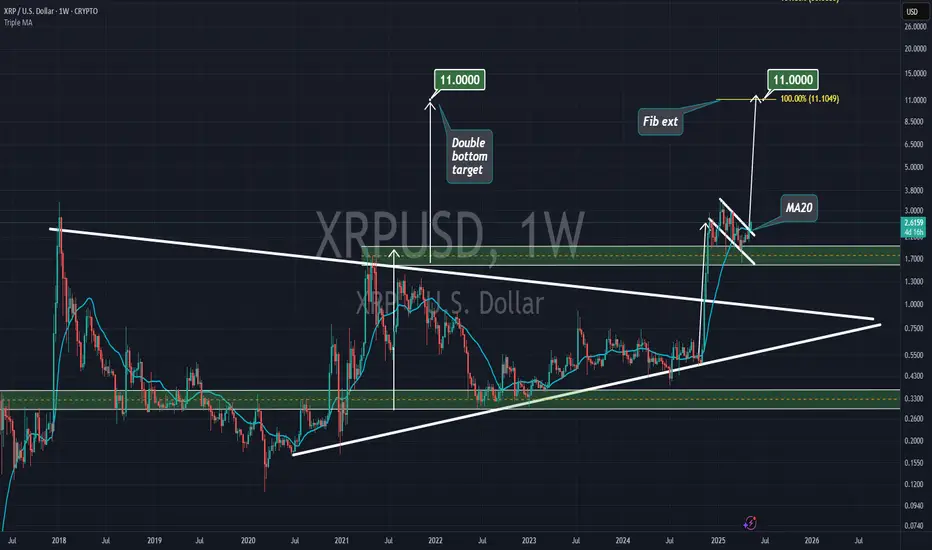
XRP to $11XRP has a lot of patterns and things to show us the price about $11.
The first pattern is the double bottom on weekly from 2018 till now, and the target of that is $11. The second thing is the Fibonacci extension for the 100% movement of the recent movement on XRP from November 2024, and that is $11.
The last pattern is the bull flag that XRP made recently and the target of that is $11.
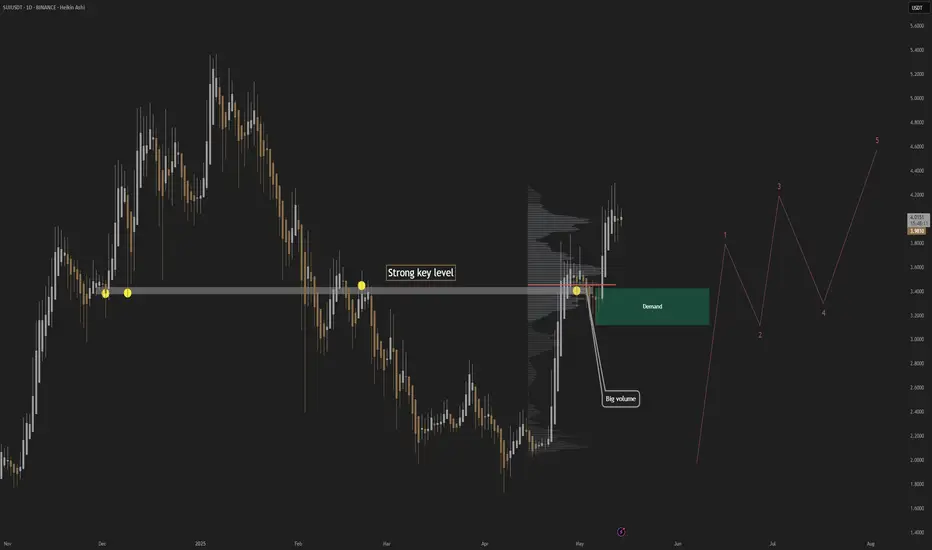
SUIUSDT; Heikin Ashi trade ideaBYBIT:SUIUSDT
Simple explanation on the chart. For any additional info's, you can let me know in the comments.
Thank you
BCH short range high ideaBCH could be forming structural loss lower time frame that could at least give a small pullback into the demand below offering a scalp short opportunity

Neiro: Your Altcoins Choice (S5)I am very curious as to why dogs became so famous within the Cryptocurrency market... It is very interesting. What is the relationship of dogs and this technology? Why dogs and not turtles or dragons? We know the cats went to videos but Crypto gets to enjoy man's best friend.
Neiro is good my dear friend very good just as you. Thanks a lot for your support.
I appreciate the time took out to comment and make this analysis request, I hope you are happy with the results.
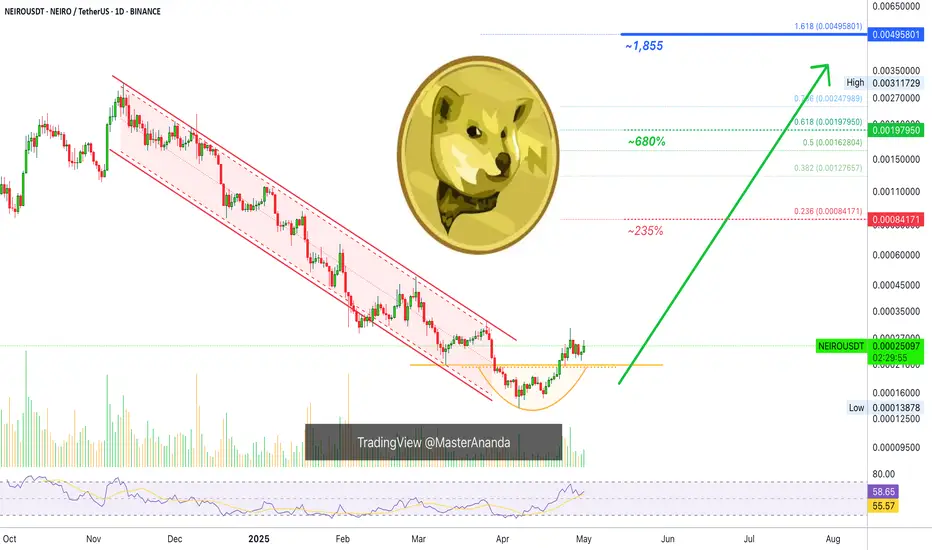
NEIROUSDT is good, this is a solid chart.
This analysis is 100% based on the chart, technical analysis—TA.
The RSI looks pretty good on the bullish zone (above 50).
There is a bottom pattern in the form of a rounded bottom coming after a major downtrend. The action recovered above the 11-March low and the ensuing retrace was minimum which is a signal of strength.
The chart candles, the volume and indicators are telling me that an advance will happen next. The main move will be an up-move. Higher prices for sure. You can find targets mapped on the chart, it will be easy, it is high probability and it will be great.
Strategy? Buy and hold. But make sure to sell when prices are up do not become greedy. Enjoy the profits and move on. Opportunities are endless. You are good because you have good timing. Having good timing means that you are balanced in your life because you are looking at the market just at the right time. To be able to be here at the right time means that you are looking to win. Those that are looking to play will join when it is too late.
Timing is very important when trading because it removes all the complexities that come with joining a move when it is already underway. Buy and hold easy. NEIRO is set to grow in the coming weeks and months.
Thank you for reading.
Namaste.
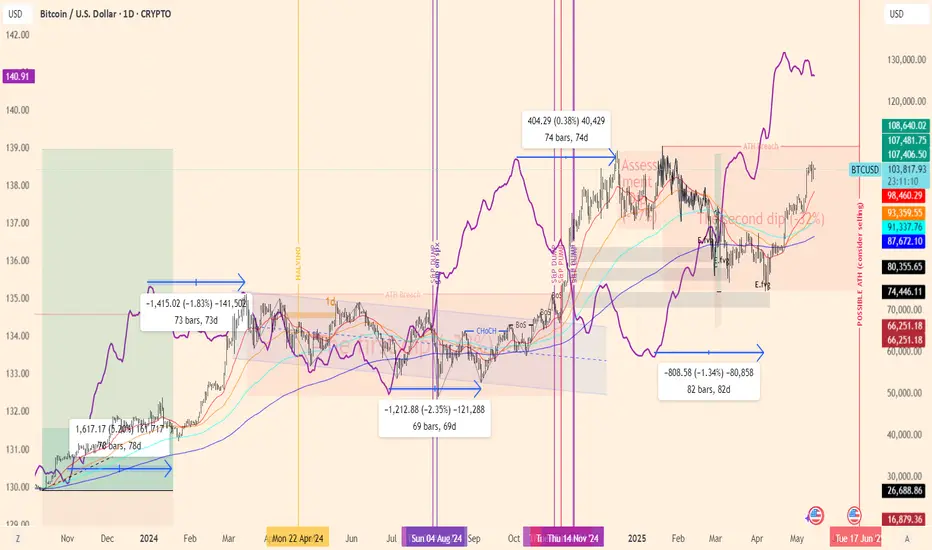
Pairing between BTC & Global Liquidity IndexSup everyone,
if you're active on twitter or have been looking around for crypto trade ideas you might have stumbled upon the Global Liquidity Index chart (at least I have).
I've stumbled upon it a few months back and have been testing it ever since, let me tell you what this chart is about:
The Global Liquidity Index basically measures how much money is flowing through global markets—think of it like the pulse of the financial system... traders and investors use it to get a sense of overall market conditions, liquidity availability, and risk appetite.
Now, here’s the cool thing: when you layer the Global Liquidity Index onto the Bitcoin chart, you notice something interesting— BITSTAMP:BTCUSD tends to react, but with a delay. Typically, there's about a 2-3 month lag. If global liquidity spikes or makes a sharp V-shaped recovery, Bitcoin usually mirrors this movement roughly 80 days later.
Why does this happen? Well, Bitcoin is a highly speculative asset, and institutions—especially banks—often wait to see solid liquidity signals before moving their capital into riskier assets like crypto. They prefer confirmation over speculation, which explains the delay.
So, in simple terms, by tracking global liquidity, you get a pretty useful heads-up about where Bitcoin might be headed a couple of months down the road.
The Global Liquidity Index is essentially a snapshot showing how much money central banks and financial institutions are injecting or pulling out of the global economy. Think of it like a big gauge tracking how "easy" or "tight" money conditions are worldwide.
It usually takes into account factors like:
Central Bank Policies: How much money central banks are printing or how they're changing interest rates.
Bank Reserves and Credit Availability: The amount banks can lend out, influencing how easily money flows through markets.
Government Spending and Stimulus: Fiscal policies injecting liquidity directly into the economy.
International Capital Flows: Money moving across borders, affecting global market liquidity.
When liquidity is abundant, there's more money sloshing around looking for places to invest. That typically pushes up asset prices—including speculative ones like Bitcoin—as investors seek higher returns. Conversely, when liquidity tightens (like when central banks raise interest rates or pull back stimulus), money becomes scarcer, risk appetite shrinks, and assets tend to dip.
So, when you're watching the Global Liquidity Index, you're basically monitoring how central banks and institutions are influencing market sentiment and investment behaviors, which eventually impacts speculative assets like Bitcoin—but with that notable delay we talked about earlier.
Practically speaking, here's how you apply the Global Liquidity Index to Bitcoin:
You watch for major turning points—peaks, bottoms, or sharp reversals—in global liquidity. Once you spot one, mark your calendar about 2–3 months forward (around 80 days). That’s usually when Bitcoin mirrors that move.
So, for instance, if the Global Liquidity Index sharply rebounds upward (a V-shaped recovery), you'd expect BTC to follow with a rally roughly two to three months later. On the flip side, if liquidity peaks and starts declining, it's a heads-up that Bitcoin could face downward pressure within the next few months.
This gives you a practical edge—you're essentially previewing BTC’s possible moves.
All things said, if you look at BTC's chart right now and apply the Global Liquidity Index to it you can see how the second has broken its previous high a few months back, but BTC yet has to break its, you can arrive to the conclusions here....
With no reversal in sight (for now) in the Global Liquidity Index, there don't seem to be signs of "spoofing", no case in which the index starts declining and so makes traders who know about this delay start to sell earlier than the delay.
End of the story - things look promising for BTC and you should definitely keep the Global Liquidity Index in your list of indicators.
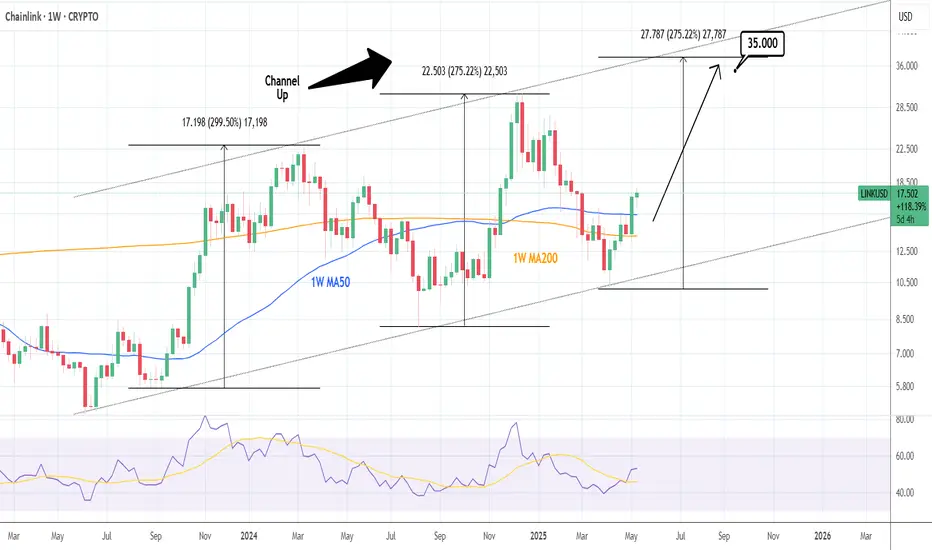
LINKUSD: Expected to give +100% return.Chainlink has turned overbought on its 1D technical outlook (RSI = 70.291, MACD = 0.870, ADX = 19.937) and has validated the start of the new bullish wave of the Channel Up as it crossed above both the 1W MA200 and MA50. Both prior bullish waves rose by nearly +300%, the most recent by +275%. Technically it can repeat at least that and double in price (TP = 35.00) before the wave peaks at the top of the Channel Up.
## If you like our free content follow our profile to get more daily ideas. ##
## Comments and likes are greatly appreciated. ##
BTCUSD; Heikin Ashi BITSTAMP:BTCUSD
Weekly time frame and divergences.
Maybe big correction after sweep of previous ATH...
It is very interesting how different methods, approaches we traders use, either to actively look for daily or weekly opportunity or longer term investment.
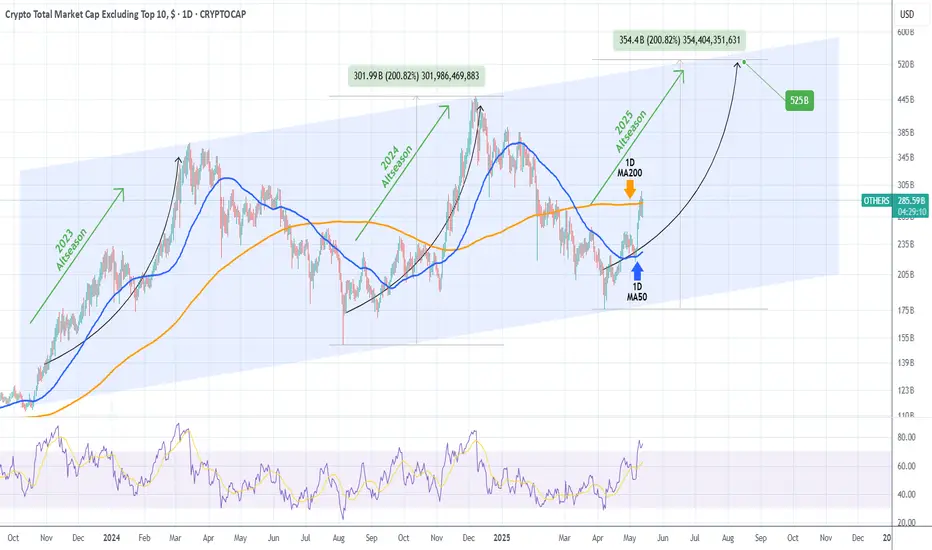
ALTSEASON is here!The Crypto Total Market Cap (excluding the Top 10 coins) broke above the 1D MA200 (orange trend-line) and is consolidating on an overbought 1D RSI (>70.00).
Since October 2023 when this set of conditions emerge, the long-term Channel Up starts a rally (technically its Bullish Leg). This is what in the crypto world is known as 'Altseason',which is when the lower cap coins see enormous gains relative to the top 10.
The last Bullish Leg (2024) rose by +200%. The previous one, even more. If it 'just' repeats the +200% Leg, we are looking at a market cap of $525 Billion.
The time to invest in alts is now!
-------------------------------------------------------------------------------
** Please LIKE 👍, FOLLOW ✅, SHARE 🙌 and COMMENT ✍ if you enjoy this idea! Also share your ideas and charts in the comments section below! This is best way to keep it relevant, support us, keep the content here free and allow the idea to reach as many people as possible. **
-------------------------------------------------------------------------------
💸💸💸💸💸💸
👇 👇 👇 👇 👇 👇
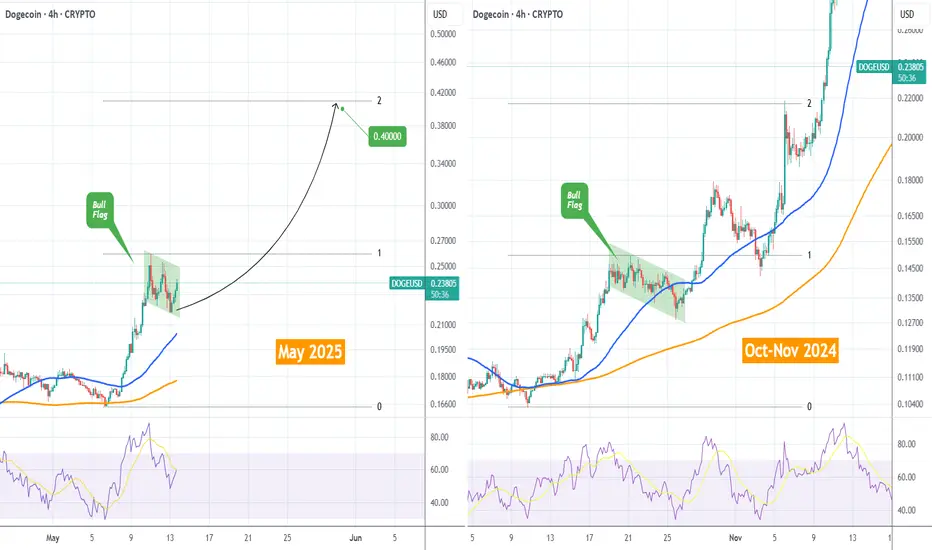
DOGEUSD Massive Bull Flag targets $0.40 like late 2024!Dogecoin (DOGEUSD) is posting a Bull Flag pattern on the 4H time-frame, being supported by the 4H MA50 (blue trend-line).
A similar Bull Flag was formed at the start of its previous major rally in October 2024, which made the price jump to the 2.0 Fibonacci extension, in as much time as it took for the price to reach the Bull Flag's start from the bottom.
As a result, we expect DOGE's next short-term Target to be $0.40.
-------------------------------------------------------------------------------
** Please LIKE 👍, FOLLOW ✅, SHARE 🙌 and COMMENT ✍ if you enjoy this idea! Also share your ideas and charts in the comments section below! This is best way to keep it relevant, support us, keep the content here free and allow the idea to reach as many people as possible. **
-------------------------------------------------------------------------------
💸💸💸💸💸💸
👇 👇 👇 👇 👇 👇
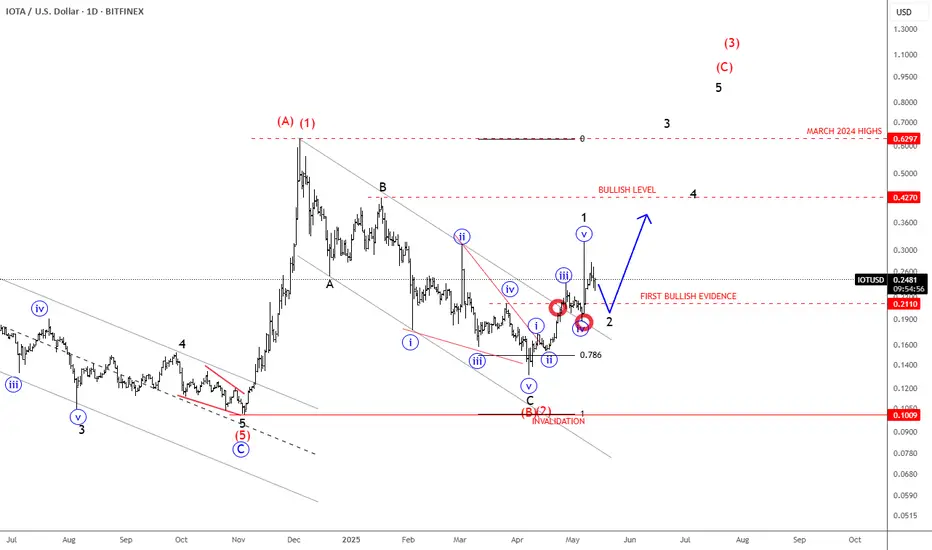
IOTA Could Be On The Way Back To December 2024 HighsIOTA with ticker IOTUSD made sharp and impulsive rally at the end of 2024, which we see it as a first leg (A)(1) of a bigger recovery in minimum three waves (A)(1)-(B)(2)-(C)(3). Since the beginning of 2025, Crypto market slowed down and IOTA made a deep retracement, but in three legs ABC with an ending diagonal/wedge pattern into wave C, which indicates for a correction in wave (B)(2).
Well, it nicely bounced recently, making a clean five-wave impulse away from projected 78,6% Fibonacci support and back above channel resistance line, so it can be wave 1 of a new five-wave bullish cycle within higher degree wave (C) or (3). That said, after current pullback in wave 2, be aware of more gains for wave 3 of a five-wave bullish cycle that can send the price back to December 2024 highs this year.
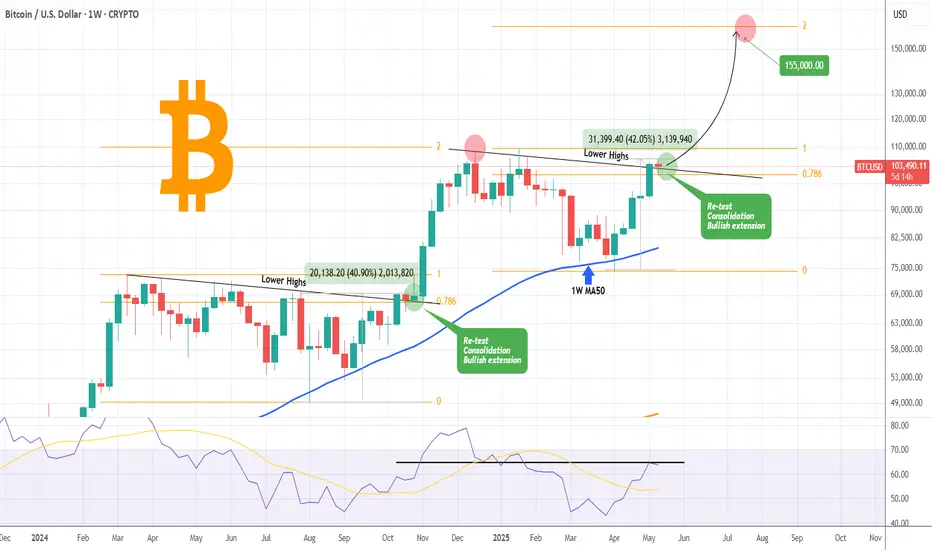
BITCOIN on similar spot as before the U.S. elections! 155k next?Bitcoin (BTCUSD) broke last week above the Lower Highs trend-line of its December 2024 High and so far on the current 1W candle, it's consolidating on it.
This is the exact same price action we saw on the October 21 2024 1W candle, which after breaking above that Lower Highs trend-line at the time, it spend 2 weeks consolidating on it before the November 05 U.S. election result started a relentless 7 week rally just below the 2.0 Fibonacci extension.
Note that on both fractals, the Lower Highs break-out and then re-test, took place on the 0.786 Fibonacci retracement level. If BTC manages to close above it at all times, we will have a strong case to expect again a Bullish extension as last December. The symmetrical level just below the 2.0 Fib ext in today's terms is $155000.
Do you think that will be next after a short-term consolidation? Feel free to let us know in the comments section below!
-------------------------------------------------------------------------------
** Please LIKE 👍, FOLLOW ✅, SHARE 🙌 and COMMENT ✍ if you enjoy this idea! Also share your ideas and charts in the comments section below! This is best way to keep it relevant, support us, keep the content here free and allow the idea to reach as many people as possible. **
-------------------------------------------------------------------------------
💸💸💸💸💸💸
👇 👇 👇 👇 👇 👇
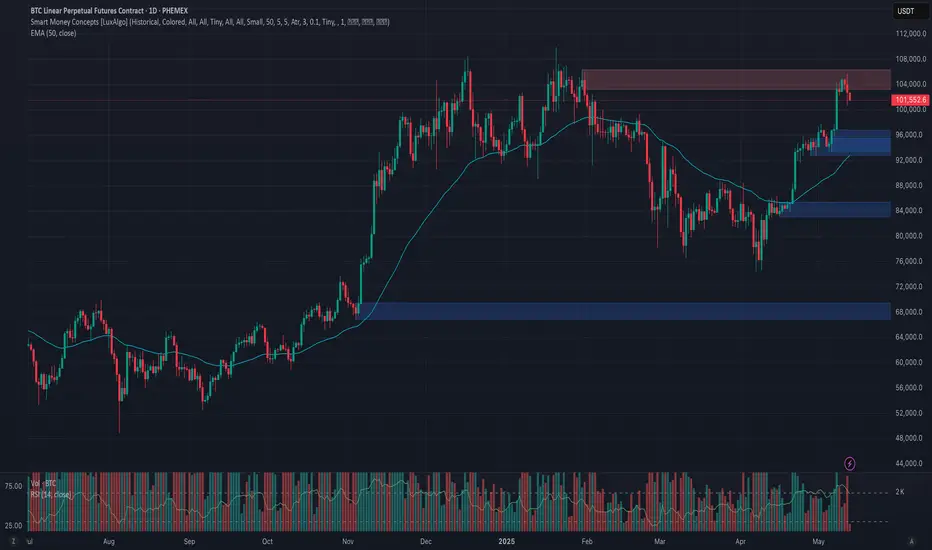
Phemex Analysis #80: Can Bitcoin Hold $100k?Bitcoin’s breakout above the $100,000 mark on May 8, 2025—its highest level since early January—reflects renewed risk-on sentiment across global markets, supported by easing U.S.-China tension and expectations of favorable crypto regulation. Spot ETF flows have also played a pivotal role: U.S. Bitcoin ETFs have accumulated over $1 billion in net inflows this month, with BlackRock’s IBIT leading demand, underpinning liquidity in the $100k zone. Despite the enthusiasm, trading volumes on leading exchanges have shown signs of plateauing, hinting at cautious engagement from larger players.
Possible Scenario
Support Analysis
1. $100,000 Psychological Support
After initially spiking to $105,784, BTC retreated to hover just above $100k, which has transitioned into a crucial support level. A decisive hold here would confirm buyer conviction at round-number thresholds.
$97,000 Major Technical Floor: Beneath six figures, the $97,000 region—previously a resistance zone in April—now offers strong demand, reinforced by the convergence of the 50- and 100-day moving averages.
$92,000 Secondary Support: Should broader market risk aversion emerge, traders could see a retracement back to $ 92K, where on-chain data indicates accumulation by long-term holders. This level aligns with the 200-day moving average, often cited as a bear-market safeguard.
2. ETF-Driven Cushion
Spot ETF inflows continue to absorb sell-side pressure, potentially dampening volatility around support levels. Historical data shows ETFs acted as a buffer during the March sell-off, suggesting they may again prevent sharp dives if BTC dips towards $90k–$100k.
Resistance Analysis
1. $105,000 Near-Term Cap
BTC peaked at approximately $105,784 on May 12, encountering supply from short-term profit-takers. A close above this region would target the early-2025 all-time high near $109,917.
2. $109,917 All-Time High
Surpassing the January ATH at $109k remains a key objective for bulls. However, historical patterns reveal increasingly subdued momentum on successive tests of this level, indicating potential exhaustion if attempted too quickly.
3.Upside Target $120,000
Most Analysts highlight a possible extension to $120k should institutional demand persist and macro conditions remain supportive.
Conclusion
Bitcoin’s ability to hold the $100,000 mark hinges on its capacity to stave off profit-taking around headline-grabbing price points and sustain ETF-driven support. Key technical floors at $100k and $ 97K—reinforced by moving-average convergence—provide a strong base, while resistance levels at $105k and the all-time high near $109.6k represent the next hurdles. If these zones are negotiated successfully, a new leg toward $120k could unfold; if not, traders should watch for a pullback to the mid-$90,000 range for renewed entries.
Overall, barring sudden negative macro shocks, the outlook favors BTC maintaining its foothold at six figures, underpinning continued upside momentum.
Pro Tips:
Armed Your Trading Arsenal with advanced tools like multiple watchlists, basket orders, and real-time strategy adjustments at Phemex. Our USDT-based scaled orders give you precise control over your risk, while iceberg orders provide stealthy execution.
Disclaimer: This is NOT financial or investment advice. Please conduct your own research (DYOR). Phemex is not responsible, directly or indirectly, for any damage or loss incurred or claimed to be caused by or in association with the use of or reliance on any content, goods, or services mentioned in this article.
BITCOIN TO $140KAccording to this weekly chart I have, bitcoin has a very important trendline that no one pay attention to, which gives us a very strong resistance about $134k to $140k , depends when bitcoin touch that, and I expect a big rejection from that area.
