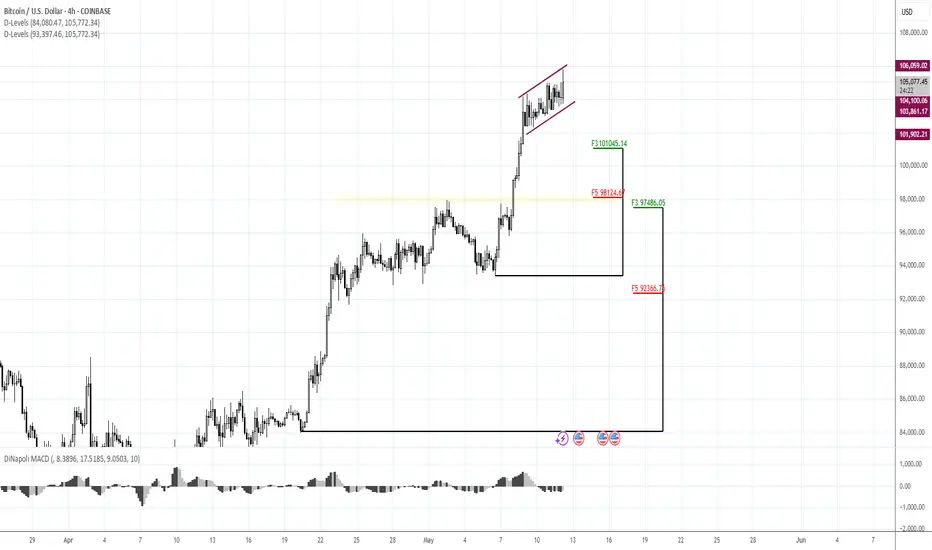
110-111KMorning folks,
So, everything goes with the plan and we still consider 110-111K area as the nearest target.
At the same time this area agrees with weekly and daily overbought, so direct upside breakout hardly possible.
Naturally, when the market is already near the target it doesn't show deep retracement. Thus, we suggest that either upward action continues right from flag shape or 101K support. 98K support area looks cool, but it is more for stop placement and invalidation level rather than for expecting of real retracement there.
Cryptocurrency
Ethereum (ETH) XABCD Pattern – $3,000 Target Ahead?ETHUSDT is at $1,759 and we’ve got an XABCD harmonic pattern in play!
▸ From $1,516 (X) to $4,147 (A), then slow retracement to $2,120 (B), then a big spike to $4,120 (C), and crash to $1,385 (D).
▸ Now, the chart is eyeing $3,000 as the next big target!
▸ Watch $2,100 and $2,500 as resistance on the way up. $1,500 is key support – let’s see if it holds!
✉️ What’s your take?
Will ETH hit $3,000, or are we dipping first? Drop your thoughts! ⬇️

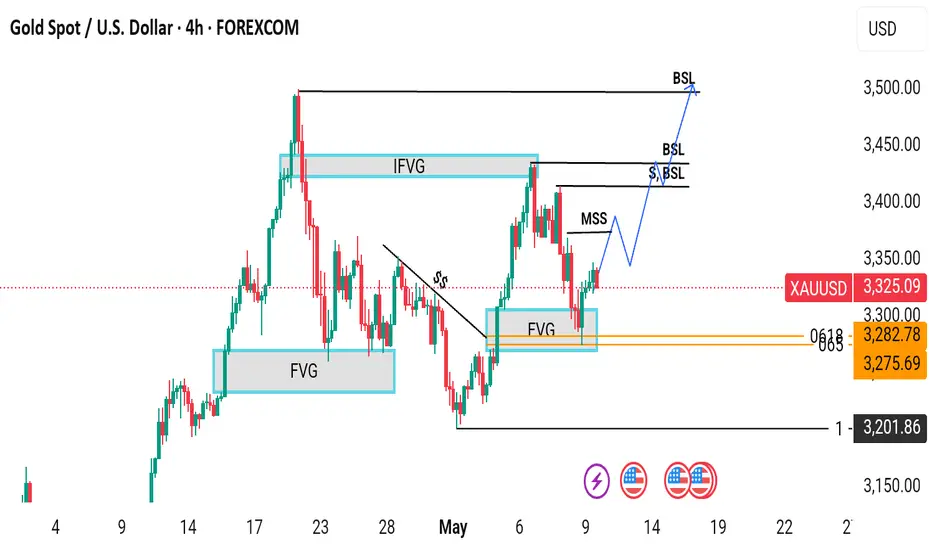
Will gold reach an all-time high?Gold (XAU/USD) Market Analysis
Trend Environment
The 4-hour chart of Gold (XAU/USD) from OANDA illustrates a strong impulsive structure within a broader bullish trend. Following a sharp upward movement that broke through previous structure, gold formed a swing high before entering a corrective phase. The market has since pulled back and appears to be stabilizing near a zone of high confluence, suggesting potential for a renewed move to the upside.
Key Levels
Support Zone 3,280-3,300 region, characterized by a fair value gap and Fibonacci golden pocket zone (0.618-0.65 retracement levels).
Potential Targets Higher lows and break of structure above recent swing highs, with buy-side liquidity levels (BSL) marking areas where buy stops are likely to be clustered.
Technical Confluence
The alignment of the fair value gap and Fibonacci retracement levels in the 3,280-3,300 region increases the likelihood of price reacting positively. Fair value gaps represent inefficiencies in the market caused by strong institutional participation, while the golden pocket is historically known for acting as a magnet for reversals within trending markets.
Bullish Scenario
The chart projects a potential bullish continuation move, with a series of higher lows anticipated to form en route to a break of structure above recent swing highs. A methodical stair-step advance is expected, respecting interim levels before ultimately attempting to reach the prior high near 3,530.
Strategic Framework
This analysis offers a methodical roadmap for bullish continuation, rooted in the smart money framework of liquidity, inefficiency, and institutional order flow. The confluence between the fair value gap and Fibonacci retracement serves as a key validation area for bullish traders. By understanding the technical and institutional drivers of the market, traders can better navigate the complexities of the gold market and identify potential opportunities for growth.
BTCUSDTHello Traders! 👋
What are your thoughts on Bitcoin?
Bitcoin has successfully broken above the $100,000 resistance zone and is now holding above this key level.
The price is expected to challenge the previous high, which represents a major resistance area.
A short-term pullback may occur after testing this heavy resistance.
Once the correction is complete, Bitcoin could resume its upward move toward higher targets.
Will Bitcoin continue its rally after a healthy pullback? Share your thoughts below!
Don’t forget to like and share your thoughts in the comments! ❤️

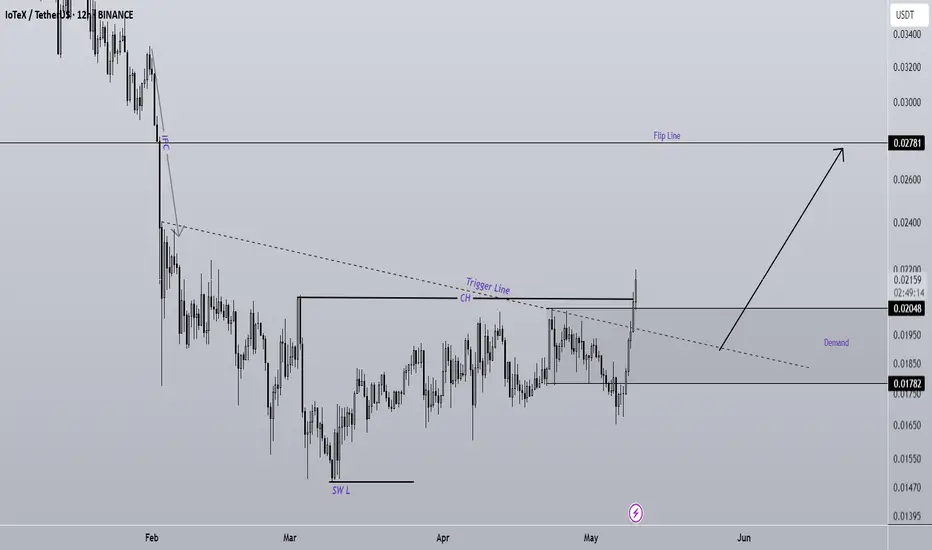
IOTX Is Still Bullish (12H)The important trigger line has been broken, and the price has recently formed the main bullish CH (Change of Character).
If the demand zone holds, the price may move toward the flip line.
A daily candle closing below the invalidation level would invalidate this analysis.
Do not enter the position without capital management and stop setting
Comment if you have any questions
thank you
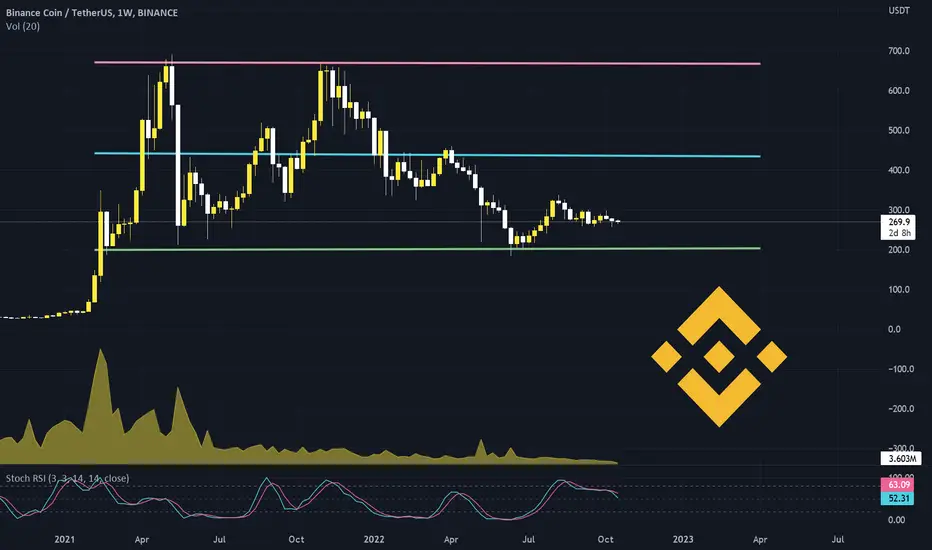
Binance Coin (BNB)The world's largest crypto exchange by volume, Binance continues its push into the embattled crypto mining industry with a plan to begin offering a crypto cloud mining product next month. crypto miners have had a tough year, with the price of bitcoin having hung around $20,000 for months, a far cry from its peak above $68,000 in November 2021. Other cryptos have faced similar or even worse declines. One of the largest mining-related firms in the U.S. filed for Chapter 11 bankruptcy in late September. Other companies, however, are seeing opportunity from this crisis, with CleanSpark going on a buying spree of mining rigs and data centers, and DeFi platform Maple Finance starting a $300 million lending pool
Binance Pool announced its own $500 million lending fund for bitcoin miners last week and said it would enter cloud mining, a service that allows investors – who otherwise might not be able to buy and operate their own equipment – to rent crypto mining machines. The official launch of the cloud mining service will come in November.
BNB can back to 300 in a short time but 195 is a good price for entry and long term investment
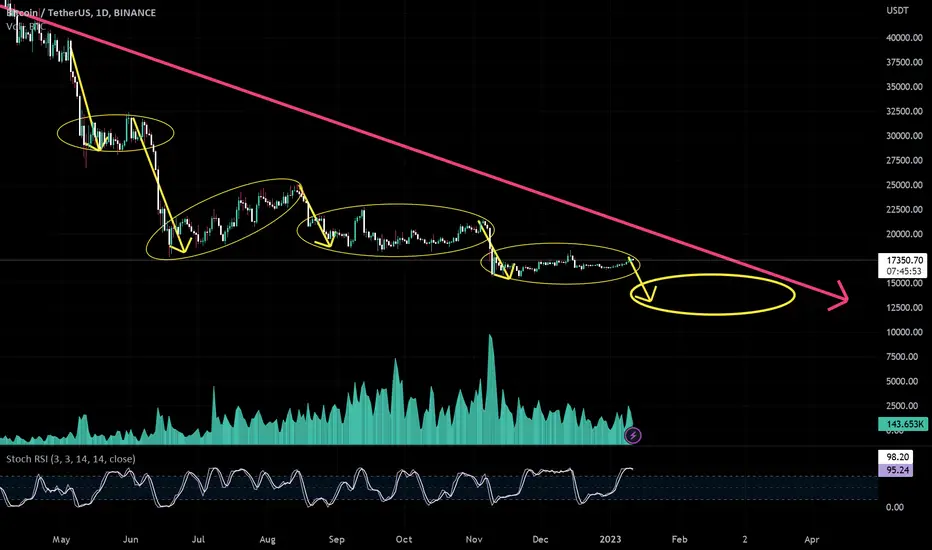
BITCOIN ( Is this the final DIP ? )I bought the dip but it just keeps dipping!
it's time to put on my bear glasses and check this ponzi chart !! oh yeah
As you can see in these patterns the moments everyone ready for breakout, bitcoin dumps to another lower level and kills all hopium that moonboyz, frog army and GM gurus got
if you think that you are person who manage to buy the exact number at dip you are wrong too, like people who bought at 60k and had plan to sell at 90k
RSI looks bearish like the pattern , I start shorting at 17490 and not going to close it till 16950$
If you got crypto on Huobi and Gemini exchange watch out too
funds are NOT safu
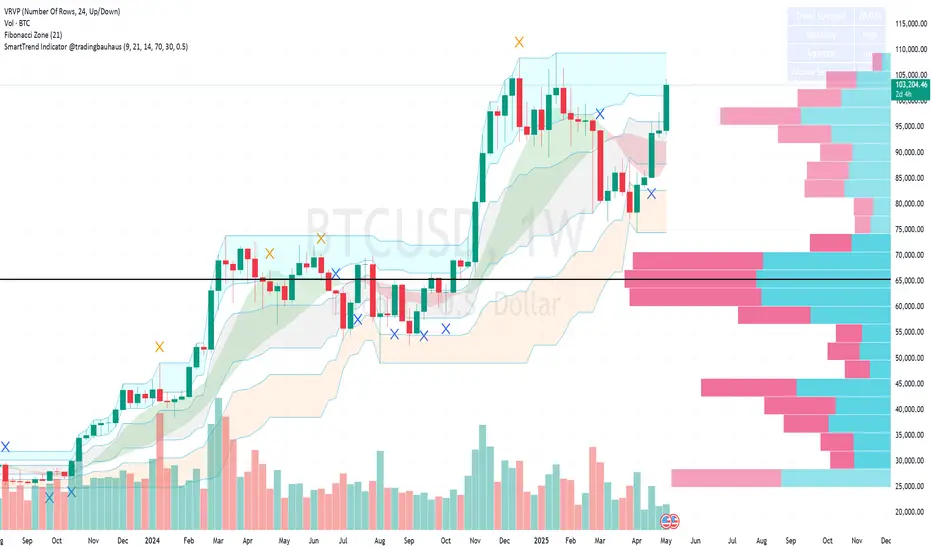
BTCUSD Analysis (1W)Current Price: $103,252.95
Trend: Strong (28.05%)
Volatility: High (115,000)
Volume: 106.35K (weekly)
Supports: $100,000, $90,000
Resistances: $110,000, $120,000
Ichimoku: Bullish cloud, price above
Smart Trend: Buy signal (9.21)
📅 Since 2023, Bitcoin has maintained a clear uptrend. At this price, there could be a push towards $110,000 in the short term.
⚠️ Disclaimer: This is not financial advice. Trade at your own risk.
#BTC #Crypto #Trading
SmartTrend Indicator @tradingbauhaus
ALTSEASON: Market to skyrocket to a 1.6 Trillion cap.The Cycle's Channel Up on the Crypto Total Market Cap (exc BTC and ETH) technically started its new bullish wave, which is translated to what is known as an altseason. Based on this chart, it is expected to rise by at least +139%, bringing the market to a $1.6 Trillion cap. Time to invest heavily in altcoins.
## If you like our free content follow our profile to get more daily ideas. ##
## Comments and likes are greatly appreciated. ##

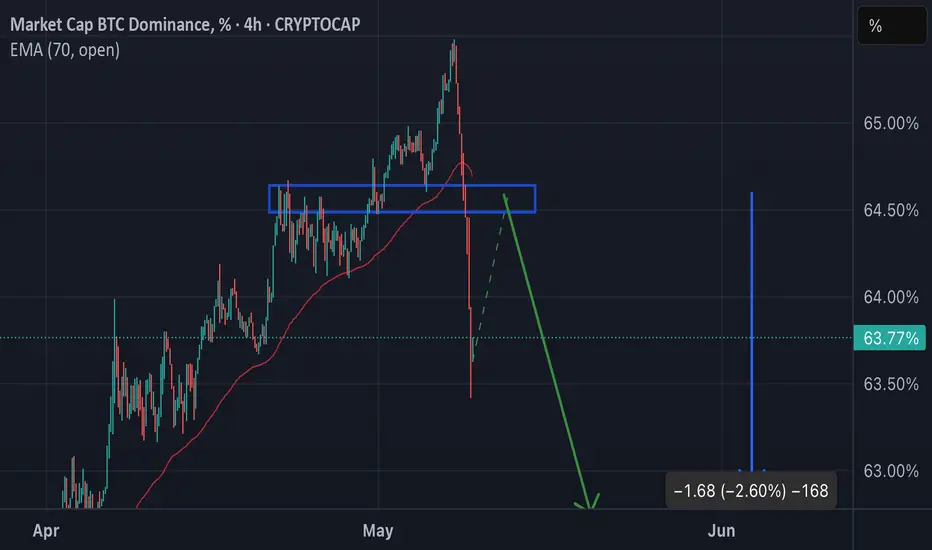
Dominance BTCHere’s something interesting on the 4H chart.
We can clearly see that BTC dominance has broken its bullish structure. A retest around 64.50% is likely, followed by a potential 2.60% drop toward 62.50%.
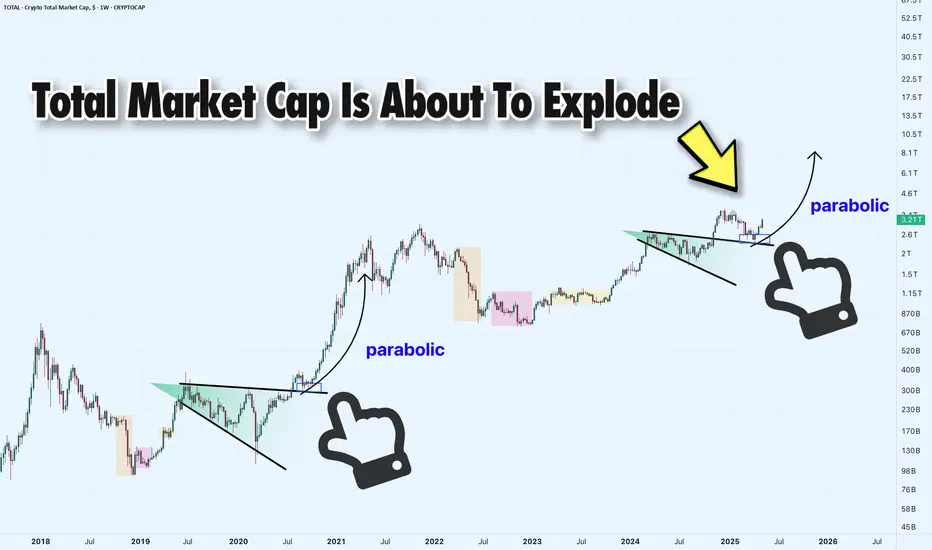
Total Market Cap Weekly Chart: Ready to Explode?Hey traders! Let’s dive into this weekly TOTAL Crypto Market Cap chart. The headline says it all— Total Market Cap Is About to Explode , and we’re here to break it down!
We’re seeing a massive expanding triangle formation, with the market cap currently at 3.21T , right at retest of triangle resistance. Historically, these patterns have led to parabolic moves — check out the 2019 - 2020 breakout! If history repeats, a breakout could send the market cap soaring toward 8.0T or even higher!
However, if the breakout fails, we might see a pullback to the previous level of support around 2T .
Key Levels to Watch:
Resistance: 3.66T (ATH)
Support: 2T
Breakout Target: 8.1T+
Breakdown Risk: 1.20T (latest strong resistance below 2.6T)
Is the market cap about to go parabolic, or are we in for a fakeout? Let’s hear your thoughts below!
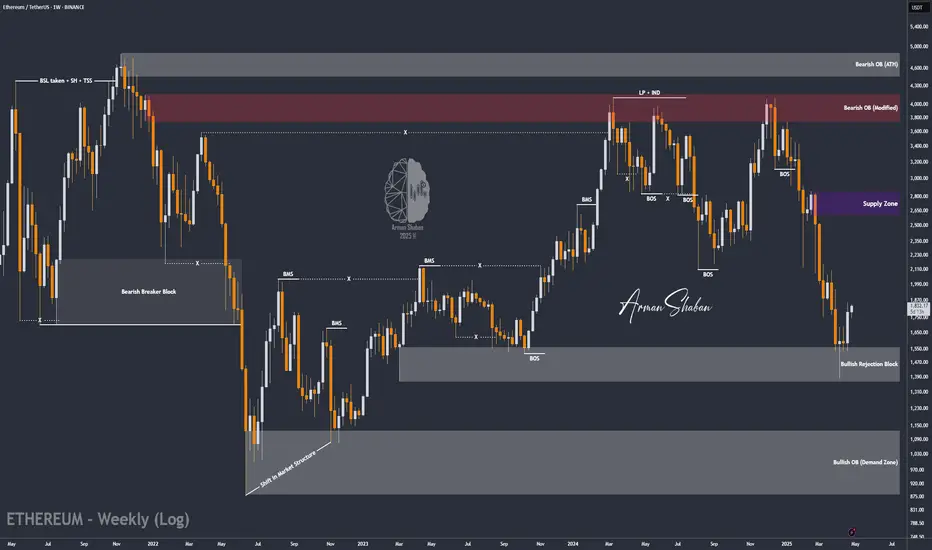
ETH/USDT : Bulls are coming back? (READ THE CAPTION)By analyzing the #Ethereum chart on the weekly (logarithmic) timeframe, we can see that after reaching the demand zone between $1400 and $1550, buying pressure increased significantly. Currently, Ethereum is trading around $1800, and I expect to see the next bullish wave soon. The potential upside targets are $1990, $2500, and $2600. This analysis will be updated accordingly!
Please support me with your likes and comments to motivate me to share more analysis with you and share your opinion about the possible trend of this chart with me !
Best Regards , Arman Shaban
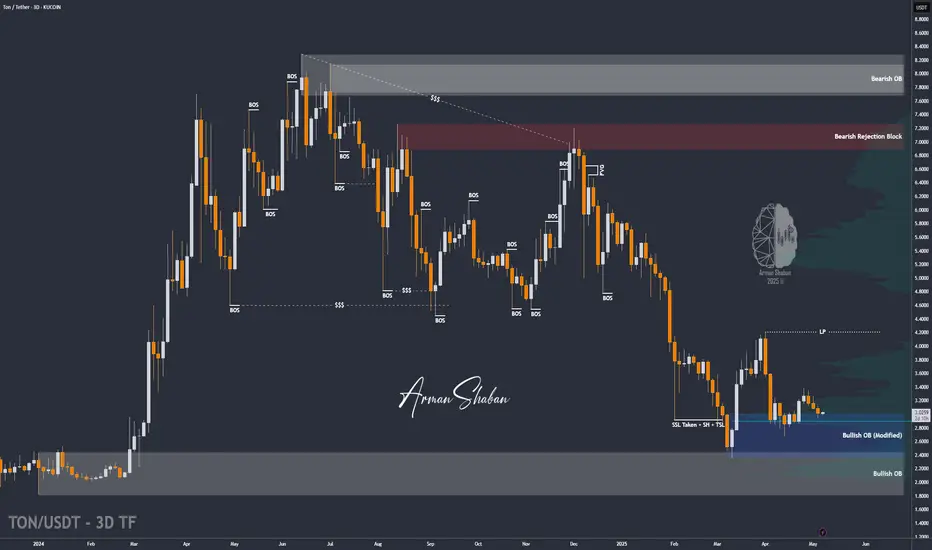
TON/USDT : The Next Bullish Rally Ahead? (READ THE CAPTION)By analyzing the #Toncoin chart on the 3-day timeframe, we can see that the price is currently trading around $3.00, which is approximately 60% below its all-time high of $8.20. If Toncoin can hold above the $2.80 level, we may expect further bullish momentum in the mid-term.
The next potential upside targets are $3.39, $3.64, $4.20, and $4.66.
Please support me with your likes and comments to motivate me to share more analysis with you and share your opinion about the possible trend of this chart with me !
Best Regards , Arman Shaban
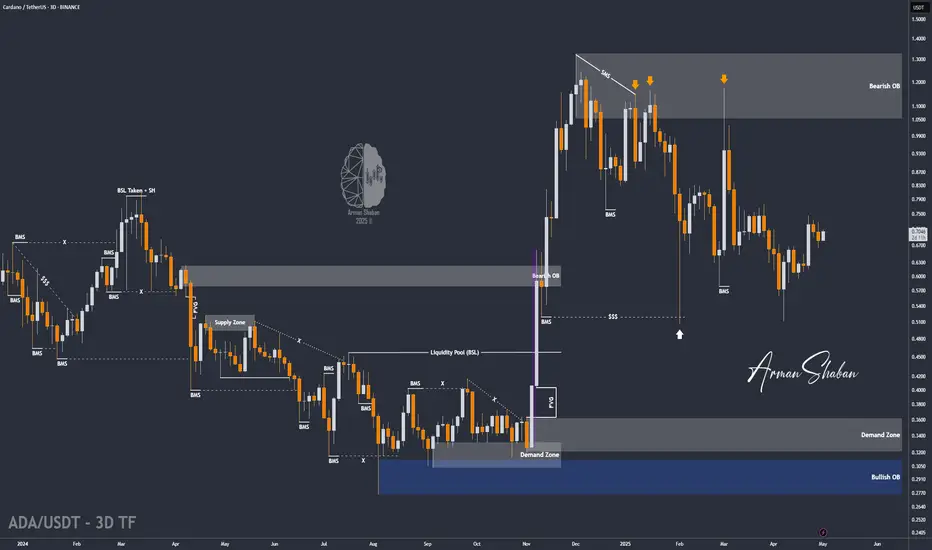
ADA/USDT: Is ADA Preparing for Its Next Rally?(READ THE CAPTION)By analyzing the #Cardano (ADA) chart on the 3-day timeframe, we can see that over the past few months, the price surged from $0.33 to $1.32, delivering a gain of over 300%. After reaching its highest level in 3 years, it faced selling pressure and corrected down to $0.50.
Currently, Cardano is trading around $0.70, and if the price can hold and close above the $0.65 level, we may expect further upside in the medium term.
The next potential targets are $0.75, $0.81, $0.93, and $1.05, respectively.
Please support me with your likes and comments to motivate me to share more analysis with you and share your opinion about the possible trend of this chart with me !
Best Regards , Arman Shaban
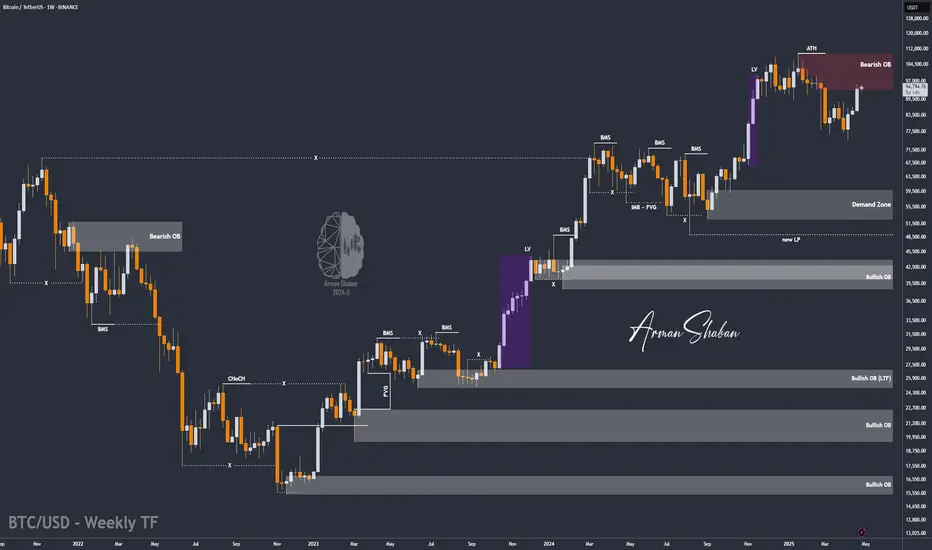
BTC/USD: The Bull Run Isn’t Over yet! (READ THE CAPTION)By analyzing the #Bitcoin chart on the weekly timeframe, we can see that price has finally started rising as expected and has hit all our targets, breaking above $100,000. Bitcoin is currently trading around $103,000, and now we must wait to see if it gets rejected from this level. If there's no rejection and price breaks and holds above $110,000, we could expect higher targets around $130,000 and even $163,000 in the coming weeks. So far, this analysis has delivered over 39% return!
The Previous Analysis :
Please support me with your likes and comments to motivate me to share more analysis with you and share your opinion about the possible trend of this chart with me !
Best Regards , Arman Shaban

BTC/USD: Get Ready for another Bullrun ! (READ THE CAPTION)By analyzing the #Bitcoin chart on the weekly timeframe, we can see that the price is currently trading around $95,000. Soon, we should expect Bitcoin to enter the key supply zone between $99,500 and $109,500, where we’ll closely watch for the market's reaction.
Bitcoin continues to show strong demand, and we may witness another bullish spike in the short term. All previous assumptions from the last analysis remain valid.
Please support me with your likes and comments to motivate me to share more analysis with you and share your opinion about the possible trend of this chart with me !
Best Regards , Arman Shaban
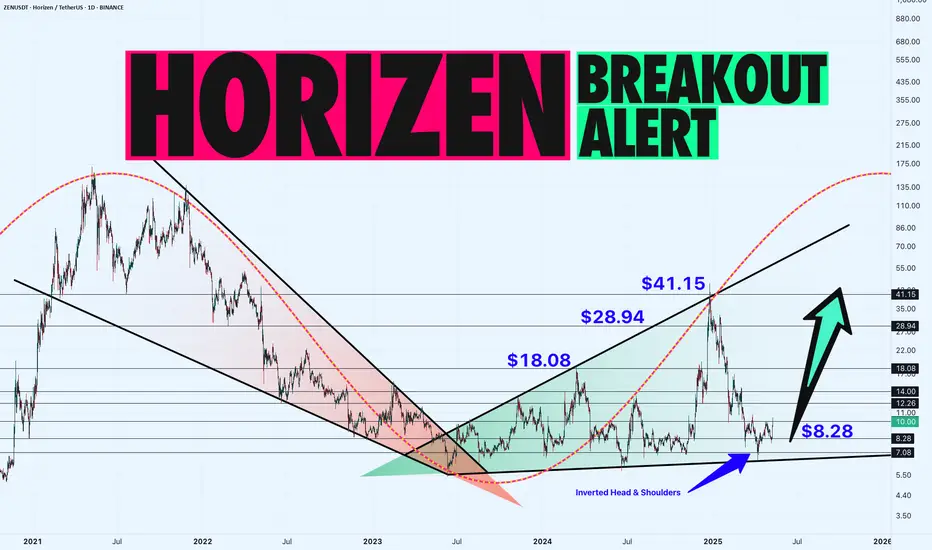
ZEN/USDT Daily Chart: Accumulation Before the Big Move? Hey traders! Let’s dive into this daily ZENUSDT chart. Horizon is in a sideways accumulation phase, forming an Expanding Wedge right after a massive bullish Falling Wedge breakout.
We’re also seeing a small inverted head and shoulders at the bottom support range of $7.08-$10.08 , with the neckline at $10.08 . ZEN recently revisited this level, and a confirmed breakout could propel it toward $18.08-$28.94 , with a major target at $41.15 .
If the breakout fails, we might see a pullback to the neckline at $10.08 or the shoulder support at $8.28 .
Key Levels to Watch:
Resistance: $18.08, $28.94, $41.15
Support: $8.28
Breakout Target: $41.15
Breakdown Risk: $8.28
Is ZEN about to skyrocket, or will this breakout fail? Let’s hear your thoughts below!
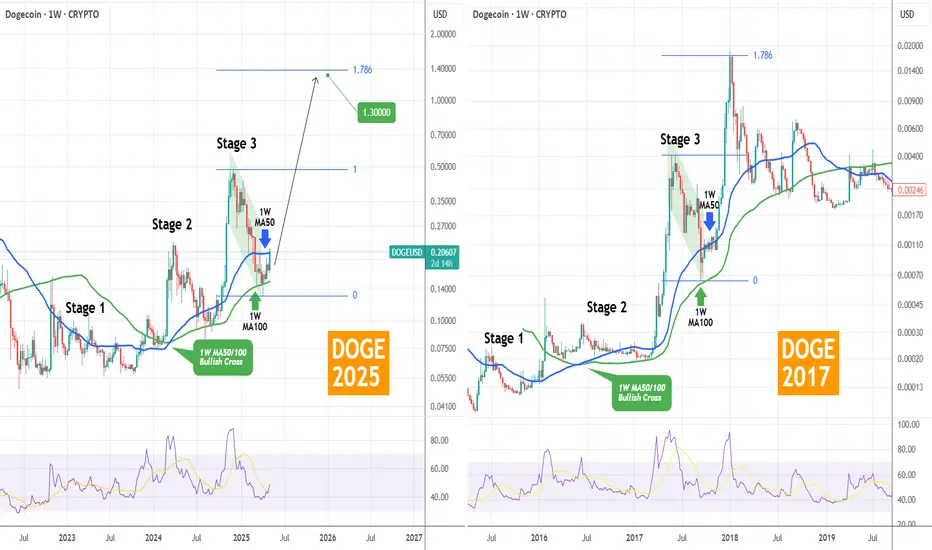
DOGEUSD Started its final rally and can hit $1.300Dogecoin (DOGEUSD) just broke above its 1W MA50 (blue trend-line) again for the first time since March 24 2025 and is doing so after a clear rebound on its 1W MA100 (green trend-line). This is a technical bottom formation, that resembles the one on September 11 2017, right before that Cycle's final rally was initiated.
The 1W RSI has already broken above its MA trend-line (yellow) and every time that took place since October 16 2023, DOGE posted a strong rally. As you can see, the similarities between the two fractals are remarkable, both unfolding a structured bullish pattern on similar stages, with a 1W MA50/100 Bullish Cross leading to the massive Bull Flag (green) that bottomed on the 1W MA100 and initiating the parabolic rally.
In 2017 it topped on the 1.786 Fibonacci extension, so if it continues to replicate that fractal, we expect this run to hit $1.300 by the end of the year and make the Cycle's Top.
-------------------------------------------------------------------------------
** Please LIKE 👍, FOLLOW ✅, SHARE 🙌 and COMMENT ✍ if you enjoy this idea! Also share your ideas and charts in the comments section below! This is best way to keep it relevant, support us, keep the content here free and allow the idea to reach as many people as possible. **
-------------------------------------------------------------------------------
💸💸💸💸💸💸
👇 👇 👇 👇 👇 👇
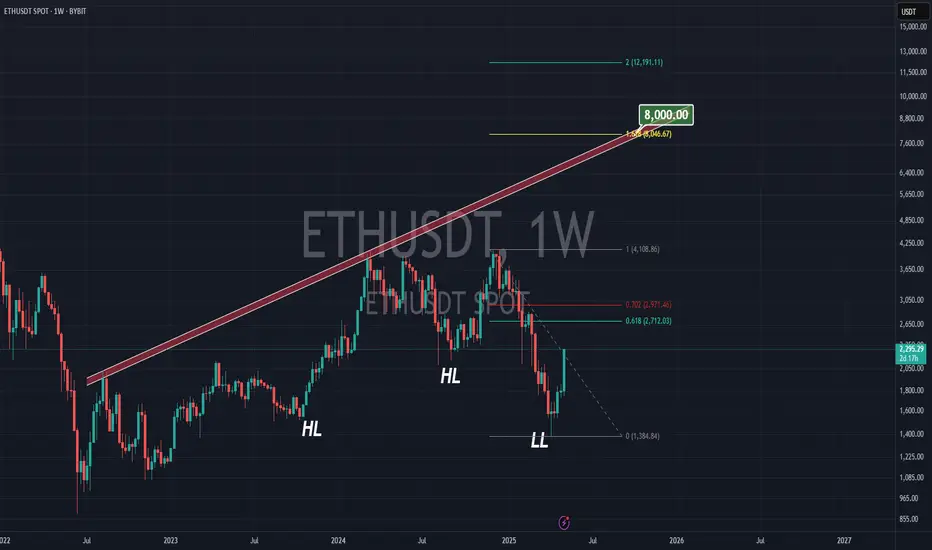
ETHEREUM TO $8000According to the previous tops we have for Ethereum on big time frames, we have a strong & long-term trend-line which gives us $7000 in summer and $8000 in October time.
On the other hand the 161.8% Fibonacci from the previous top the bottom we just saw (about $1500 ) is at $8000 .
Is this a coincident?! I don't think so
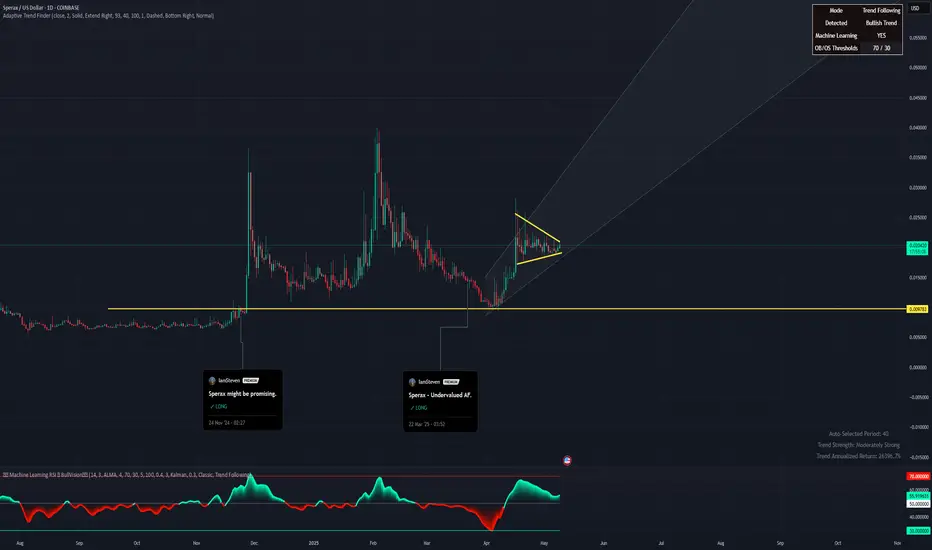
Sperax: Bullish pennant.Sperax is consolidating in a bullish pennant pattern after a strong recovery rally off the March lows. Price action has tightened between ascending support and descending resistance, forming a textbook continuation setup. Volume has decreased during this compression, which is often a precursor to explosive movement.
Fundamental Catalysts (Despite GENIUS Act Stalling):
Retail DeFi Narrative is Still Alive – While the GENIUS Act failed in the Senate, the momentum for regulatory clarity in the DeFi space continues. Future bills or executive actions could unlock capital flows to protocols like Sperax.
Deflationary Pressure —Over 13% of the total SPA supply has been burned, with more tokens locked and lost. The actual circulating supply is meaningfully lower than the total supply shown on aggregators.
SIP-70 has been passed , shifting SPA emissions from an automatic release model to a DAO-controlled emission schedule. This marks a significant milestone towards sustainable tokenomics and the preservation of long-term value.
Long-Term Accumulation – Wallet data and order books suggest that whales and long-term holders quietly accumulate during this sideways range.
Sperax remains a low-cap token with outsized potential in the next altseason if it secures even one meaningful partnership or fiat on-ramp.
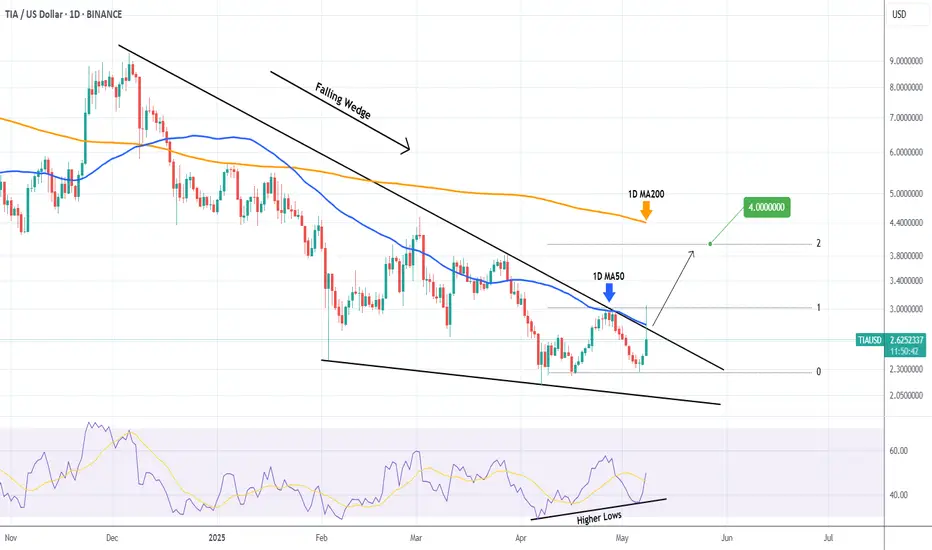
TIAUSD just broke above the 5-month Falling Wedge!Celestia (TIAUSD) made a major bullish break-out today as not only did it break above its 1D MA50 (blue trend-line) but also above the 5-month Lower Highs trend-line (December 06 2024), which is the top of the Falling Wedge pattern!
With the 1D RSI also on Higher Lows, this bullish momentum is targeting the 2.0 Fibonacci extension level at 4.000, which is where contact with the 1D MA200 (orange trend-line) is expected to be made.
-------------------------------------------------------------------------------
** Please LIKE 👍, FOLLOW ✅, SHARE 🙌 and COMMENT ✍ if you enjoy this idea! Also share your ideas and charts in the comments section below! This is best way to keep it relevant, support us, keep the content here free and allow the idea to reach as many people as possible. **
-------------------------------------------------------------------------------
💸💸💸💸💸💸
👇 👇 👇 👇 👇 👇
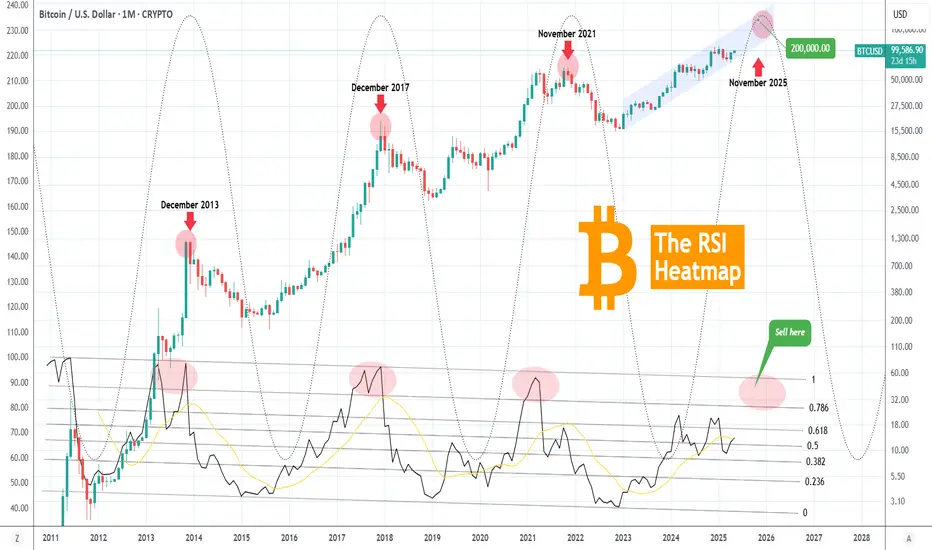
BITCOIN Monthly RSI Heatmap reveals ultimate Cycle Sell Zone!Bitcoin (BTCUSD) has resumed the long-term bullish trend and as of the writing of this analysis, it is about to test the $100k key psychological level. Now that the Bull Cycle is entering its final stage (most likely for the next 6 months at most), it is time to see potential exit levels as close to the expected Top as possible.
There is no better long-term indicator to assist us on this than the 1M RSI, which historically offers a great level to Sell when it enters the 0.786 - 1.0 Fibonacci range of its Channel Down. Currently it is still considerably distanced from that Zone, so the upside potential despite the recent break-out, is huge.
The Sine Waves indicate that in symmetrical terms, the Cycle Top should be priced around November 2025 (previous ones on November 2021, December 2017, December 2013). The closer the 1M RSI is to this date when it enters the 0.786 - 1.0 Fib Zone, the better as the higher the price will most likely be.
Based on this Cycle's Channel Up (blue), a fair Cycle Top range would be $150k - $200k. Would you agree? Feel free to let us know in the comments section below!
-------------------------------------------------------------------------------
** Please LIKE 👍, FOLLOW ✅, SHARE 🙌 and COMMENT ✍ if you enjoy this idea! Also share your ideas and charts in the comments section below! This is best way to keep it relevant, support us, keep the content here free and allow the idea to reach as many people as possible. **
-------------------------------------------------------------------------------
💸💸💸💸💸💸
👇 👇 👇 👇 👇 👇
102.5K nearest upside target. 110K is the next oneMorning folks,
So, the pullback to 88-89K area that we discussed last time has not happened. Market turns to direct upside continuation. Now it has no big barriers ahead, which means that 110K is the major target for now.
On Intraday charts we have another one - 102.5K which is the nearest one. We consider no shorts by far. For long entry you could use any deep that you would like to. We suggest that 97.50-98K area is quite suitable for this. Deeper retracement will look suspicious.
