BITCOIN Can this Inverse Head and Shoulders deliver $168000?We saw yesterday how Bitcoin (BTCUSD) has been trading within a short-term Channel Down pattern, which as mentioned was just a Bull Flag on the long-term scale.
Today we examine this on the longer term time-frame and what stands out on 1D is an Inverse Head and Shoulders (IH&S). Such patterns are incredibly bullish but are more often seen on market bottoms initiating strong long-term bullish reversals.
This time it has been formed on a 1W Bull Cycle uptrend (Channel Up), so it technically serves as a (very) long-term Accumulation Phase between the Cycle's previous All Time High (ATH) and the next one, which most likely will be the final (peak) of the Bull Cycle.
As mentioned numerous times in the past, IH&S patterns target their 2.0 Fibonacci extension level once broken. That is now at $168000 and falls well within the broader 150 - 200k range that most studies have as a potential Cycle Top.
So do you think that is realistic to expect? Feel free to let us know in the comments section below!
-------------------------------------------------------------------------------
** Please LIKE 👍, FOLLOW ✅, SHARE 🙌 and COMMENT ✍ if you enjoy this idea! Also share your ideas and charts in the comments section below! This is best way to keep it relevant, support us, keep the content here free and allow the idea to reach as many people as possible. **
-------------------------------------------------------------------------------
💸💸💸💸💸💸
👇 👇 👇 👇 👇 👇
Cryptocurrencysignals
Bullish bounce?The Bitcoin (BTC/USD) is falling towards the pivot which acts as a pullback support and could bounce to the 1st resistance.
Pivot: 106,009.96
1st Support: 103.943.66
1st Resistance: 108,761.68
Risk Warning:
Trading Forex and CFDs carries a high level of risk to your capital and you should only trade with money you can afford to lose. Trading Forex and CFDs may not be suitable for all investors, so please ensure that you fully understand the risks involved and seek independent advice if necessary.
Disclaimer:
The above opinions given constitute general market commentary, and do not constitute the opinion or advice of IC Markets or any form of personal or investment advice.
Any opinions, news, research, analyses, prices, other information, or links to third-party sites contained on this website are provided on an "as-is" basis, are intended only to be informative, is not an advice nor a recommendation, nor research, or a record of our trading prices, or an offer of, or solicitation for a transaction in any financial instrument and thus should not be treated as such. The information provided does not involve any specific investment objectives, financial situation and needs of any specific person who may receive it. Please be aware, that past performance is not a reliable indicator of future performance and/or results. Past Performance or Forward-looking scenarios based upon the reasonable beliefs of the third-party provider are not a guarantee of future performance. Actual results may differ materially from those anticipated in forward-looking or past performance statements. IC Markets makes no representation or warranty and assumes no liability as to the accuracy or completeness of the information provided, nor any loss arising from any investment based on a recommendation, forecast or any information supplied by any third-party.
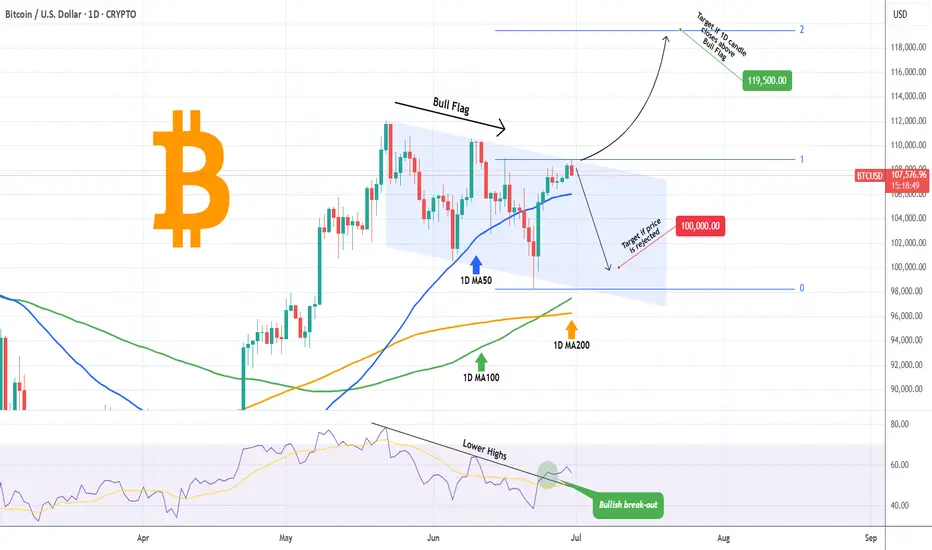
BITCOIN Rejected (so far) where it absolutely SHOULDN'T!!Bitcoin (BTCUSD) hit today the top of the Channel Down pattern, which as we've discussed numerous times, is most likely on the long-term a Bull Flag technically. Still, this early test has so far turned into a rejection.
Early on to tell as the price remains above even the 1D MA50 (blue trend-line) but if it breaks above the closes a 1D candle above the top of the pattern, we expect it to immediately target the 2.0 Fibonacci extension level at 119500. We have analyzed of course why on the long-term the Target is at least $150k, but this is a shorter term analysis. Notice also how the 1D RSI has already broken above its Lower Highs trend-line.
As long as the price remains rejected within the Channel Down, it is possible to look for support on the 100000 level again, where this time it may make contact with the 1D MA100 (green trend-line) in an attempt to 'attract' the last batch of buyers.
Which scenario do you think will prevail? Feel free to let us know in the comments section below!
-------------------------------------------------------------------------------
** Please LIKE 👍, FOLLOW ✅, SHARE 🙌 and COMMENT ✍ if you enjoy this idea! Also share your ideas and charts in the comments section below! This is best way to keep it relevant, support us, keep the content here free and allow the idea to reach as many people as possible. **
-------------------------------------------------------------------------------
💸💸💸💸💸💸
👇 👇 👇 👇 👇 👇
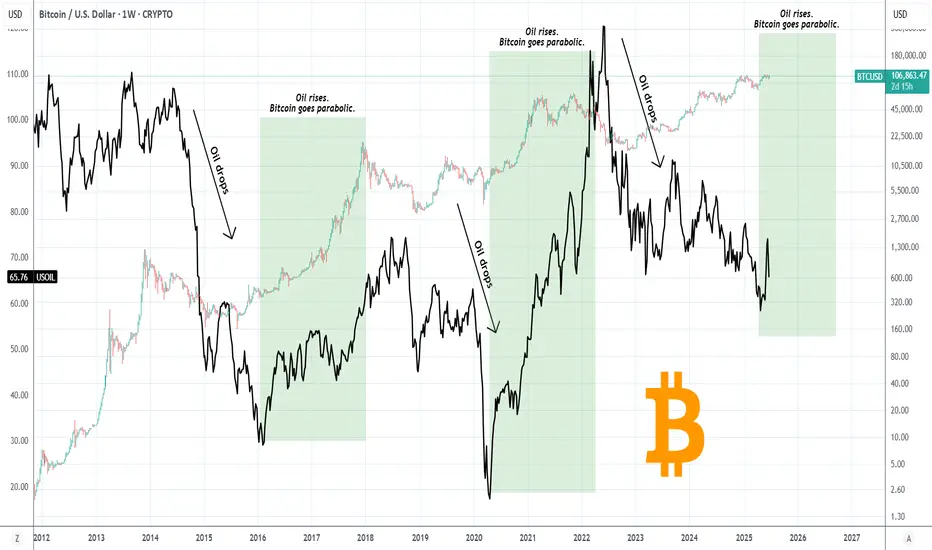
BITCOIN Just wait until OIL turns bullish!Bitcoin (BTCUSD) has a unique long-term relationship/ correlation with WTI Oil (USOIL) and this charts shows why.
In the past 11 years, when Oil started to decline sharply, Bitcoin formed a market bottom before Oil did. When Oil started to rise again, Bitcoin was out of its bottom and has initiated its Parabolic Rally stage (green Rectangle). Then Oil peaked after BTC has already priced its own Cycle Top.
Based on this correlation, we can assume that we haven't yet seen BTC's Parabolic stage as Oil hasn't yet started to rise. If we assume that the late April Low on Oil was its market bottom, then only now it has started its rise, so at best BTC has just started the Cycle's Parabolic Rally. If that turns out o be true, then the upside potential is huge for BTC. Needless to say other key macroeconomic factors have to assist e.g. higher adoption, ETF inflows, FED Rate Cut, but that's what the current chart says!
So do you think that Oil can be the driver behind a new Bitcoin parabolic rally? Feel free to let us know in the comments section below!
-------------------------------------------------------------------------------
** Please LIKE 👍, FOLLOW , SHARE and COMMENT if you enjoy this idea! Also share your ideas and charts in the comments section below! This is best way to keep it relevant, support us, keep the content here free and allow the idea to reach as many people as possible. **
-------------------------------------------------------------------------------
💸💸💸💸💸💸
👇 👇 👇 👇 👇 👇
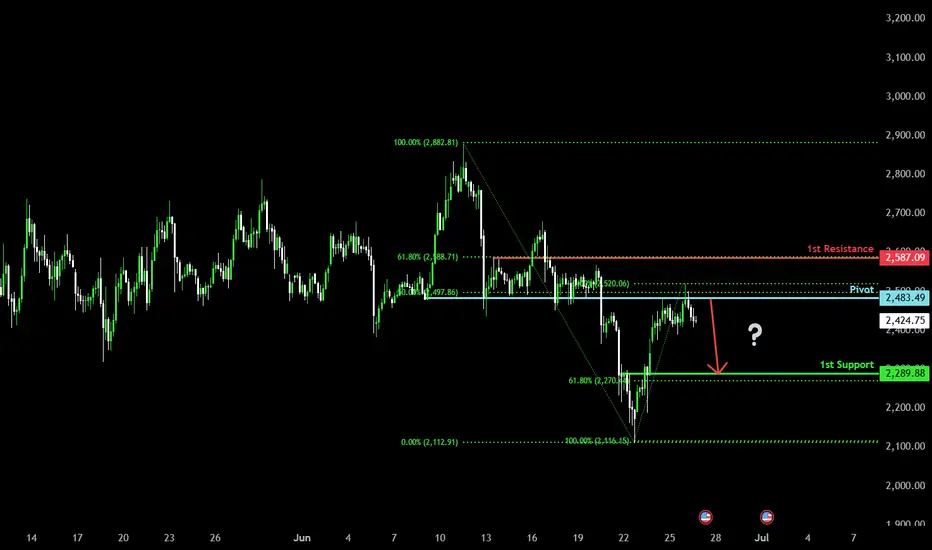
bearish reversal off pullback resistance?The Ethereum (ETH/USD) has rejected off the pivot and could drop to the 1st support that aligns with the 61.8% Fibonacci retracement.
Pivot: 2,483.49
1st Support: 2,289.88
1st Resistance: 2,587.09
Risk Warning:
Trading Forex and CFDs carries a high level of risk to your capital and you should only trade with money you can afford to lose. Trading Forex and CFDs may not be suitable for all investors, so please ensure that you fully understand the risks involved and seek independent advice if necessary.
Disclaimer:
The above opinions given constitute general market commentary, and do not constitute the opinion or advice of IC Markets or any form of personal or investment advice.
Any opinions, news, research, analyses, prices, other information, or links to third-party sites contained on this website are provided on an "as-is" basis, are intended only to be informative, is not an advice nor a recommendation, nor research, or a record of our trading prices, or an offer of, or solicitation for a transaction in any financial instrument and thus should not be treated as such. The information provided does not involve any specific investment objectives, financial situation and needs of any specific person who may receive it. Please be aware, that past performance is not a reliable indicator of future performance and/or results. Past Performance or Forward-looking scenarios based upon the reasonable beliefs of the third-party provider are not a guarantee of future performance. Actual results may differ materially from those anticipated in forward-looking or past performance statements. IC Markets makes no representation or warranty and assumes no liability as to the accuracy or completeness of the information provided, nor any loss arising from any investment based on a recommendation, forecast or any information supplied by any third-party.
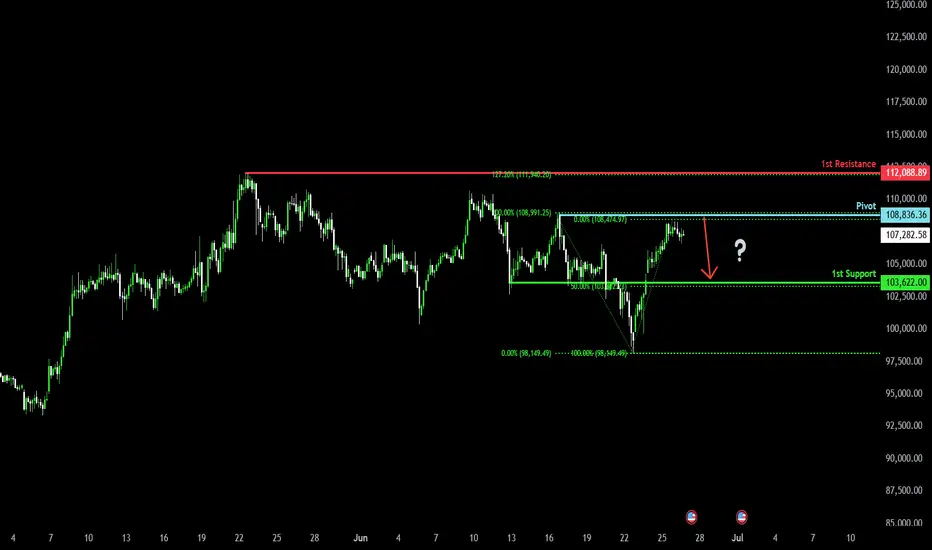
Bearish reversal?The Bitcoin (BTC/USD) is reacting off the pivot and could drop to the 1st support.
Pivot: 108,836.36
1st Support: 103,622.00
1st Resistance: 112,088.89
Risk Warning:
Trading Forex and CFDs carries a high level of risk to your capital and you should only trade with money you can afford to lose. Trading Forex and CFDs may not be suitable for all investors, so please ensure that you fully understand the risks involved and seek independent advice if necessary.
Disclaimer:
The above opinions given constitute general market commentary, and do not constitute the opinion or advice of IC Markets or any form of personal or investment advice.
Any opinions, news, research, analyses, prices, other information, or links to third-party sites contained on this website are provided on an "as-is" basis, are intended only to be informative, is not an advice nor a recommendation, nor research, or a record of our trading prices, or an offer of, or solicitation for a transaction in any financial instrument and thus should not be treated as such. The information provided does not involve any specific investment objectives, financial situation and needs of any specific person who may receive it. Please be aware, that past performance is not a reliable indicator of future performance and/or results. Past Performance or Forward-looking scenarios based upon the reasonable beliefs of the third-party provider are not a guarantee of future performance. Actual results may differ materially from those anticipated in forward-looking or past performance statements. IC Markets makes no representation or warranty and assumes no liability as to the accuracy or completeness of the information provided, nor any loss arising from any investment based on a recommendation, forecast or any information supplied by any third-party.
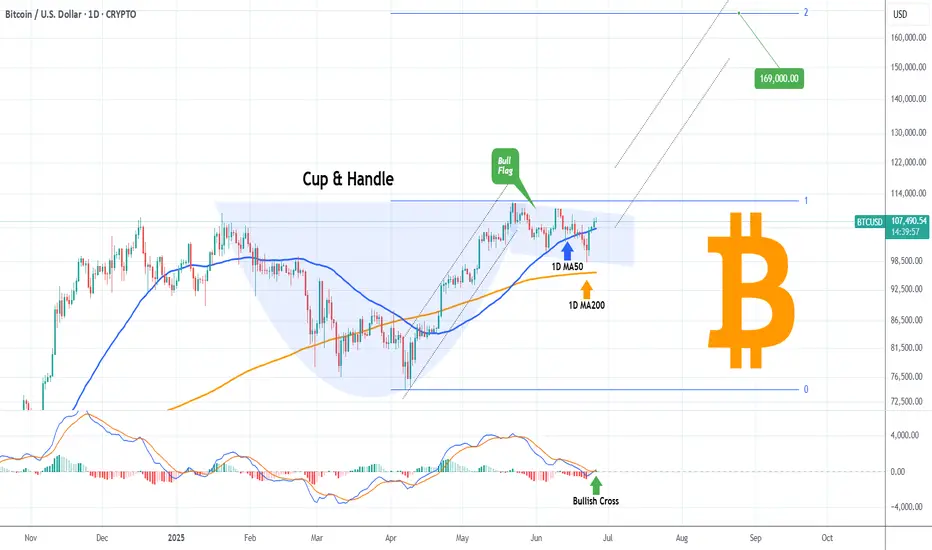
BITCOIN Cup & Handle completed! Technical Target $169k!Bitcoin (BTCUSD) is about to complete the Handle of a Cup and Handle (C&H) pattern. This comes only days after breaking below its 1D MA50 (blue trend-line) buy holding the 1D MA200 (orange trend-line) and rebounding.
Well the 1D MA50 has been recovered and on top of that, the 1D MACD just formed a Bullish Cross. This (isolated) Bull Flag, which is the Handle, technically targets the 2.0 Fibonacci extension at $169000.
Do you think that's realistic or a little excessive within thin time-frame? Feel free to let us know in the comments section below!
-------------------------------------------------------------------------------
** Please LIKE 👍, FOLLOW ✅, SHARE 🙌 and COMMENT ✍ if you enjoy this idea! Also share your ideas and charts in the comments section below! This is best way to keep it relevant, support us, keep the content here free and allow the idea to reach as many people as possible. **
-------------------------------------------------------------------------------
💸💸💸💸💸💸
👇 👇 👇 👇 👇 👇
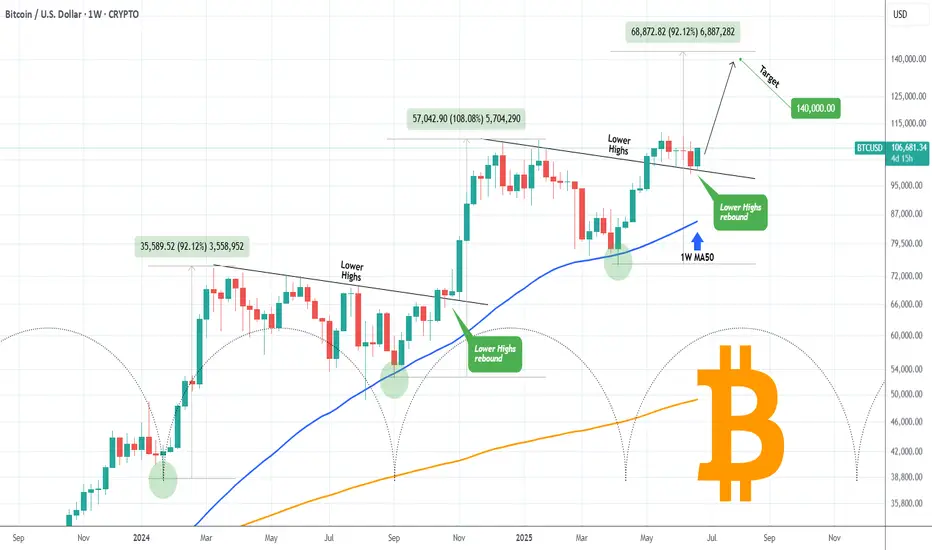
BITCOIN Major Pivot bounce eyes $140000!Bitcoin (BTCUSD) has started off the week with a huge 1W candle bounce on the former Lower Highs trend-line (that started on its All Time High), which has now turned into a Pivot. That trend-line held both last week and 3 weeks ago.
The very same Pivot test took place (October 2024) at the start of the previous Bullish Leg, resulting into a massive rebound that peaked upon a +108.08% rise. That was even higher than the Bullish Leg before it (+92.12%), which also started after a 1.5 month consolidation (Dec 2023 - Jan 2024).
Interestingly enough those Legs show an amazing frequency as the Time Cycles show on their bottoms. Assuming the current Bullish Leg will follow the 'bad case' scenario of +92.12%, we should be expecting to see at least $140000 before the next pull-back/ consolidation.
Do you think such Target is feasible by the end of August? Feel free to let us know in the comments section below!
-------------------------------------------------------------------------------
** Please LIKE 👍, FOLLOW ✅, SHARE 🙌 and COMMENT ✍ if you enjoy this idea! Also share your ideas and charts in the comments section below! This is best way to keep it relevant, support us, keep the content here free and allow the idea to reach as many people as possible. **
-------------------------------------------------------------------------------
💸💸💸💸💸💸
👇 👇 👇 👇 👇 👇
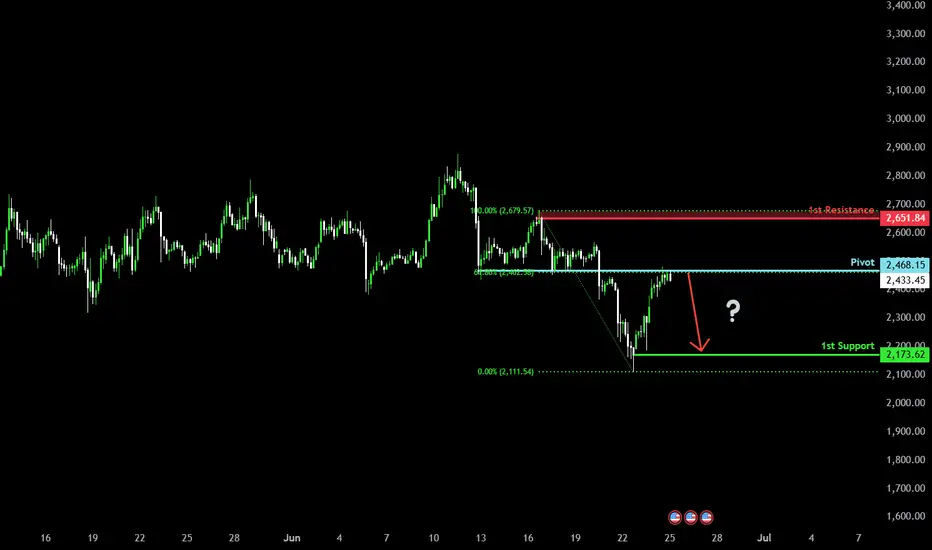
Bearish reversal?Ethereum (ETH/USD) is reacting off the pivot and could drop to the 1st support.
Pivot: 2,468.15
1st Support: 2,173.62
1st Resistance: 2,651.84
Risk Warning:
Trading Forex and CFDs carries a high level of risk to your capital and you should only trade with money you can afford to lose. Trading Forex and CFDs may not be suitable for all investors, so please ensure that you fully understand the risks involved and seek independent advice if necessary.
Disclaimer:
The above opinions given constitute general market commentary, and do not constitute the opinion or advice of IC Markets or any form of personal or investment advice.
Any opinions, news, research, analyses, prices, other information, or links to third-party sites contained on this website are provided on an "as-is" basis, are intended only to be informative, is not an advice nor a recommendation, nor research, or a record of our trading prices, or an offer of, or solicitation for a transaction in any financial instrument and thus should not be treated as such. The information provided does not involve any specific investment objectives, financial situation and needs of any specific person who may receive it. Please be aware, that past performance is not a reliable indicator of future performance and/or results. Past Performance or Forward-looking scenarios based upon the reasonable beliefs of the third-party provider are not a guarantee of future performance. Actual results may differ materially from those anticipated in forward-looking or past performance statements. IC Markets makes no representation or warranty and assumes no liability as to the accuracy or completeness of the information provided, nor any loss arising from any investment based on a recommendation, forecast or any information supplied by any third-party.
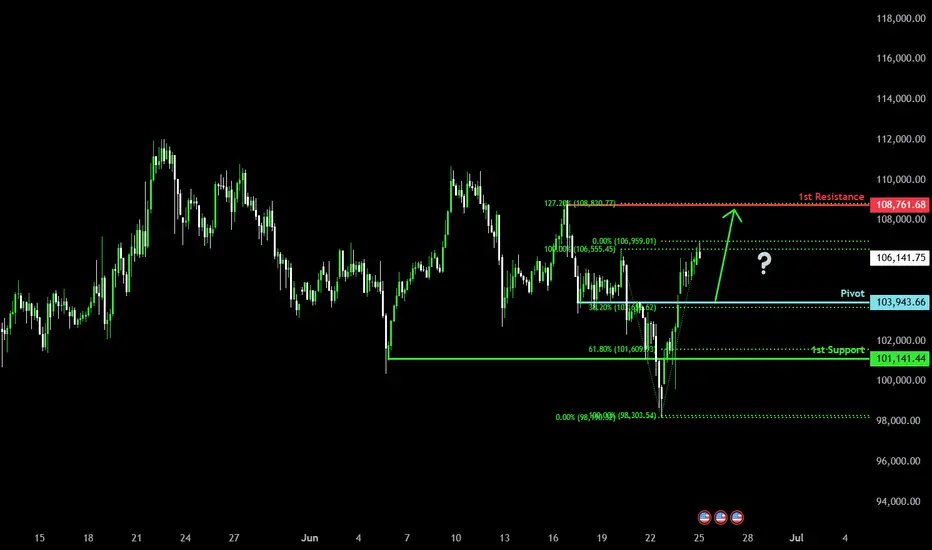
Bullish bounce?The Bitcoin (BTC/USD) is falling towards the pivot and could bounce to the pullback resistance.
Pivot: 103,943.66
1st Support: 101.141.44
1st Resistance: 108,761.68
Risk Warning:
Trading Forex and CFDs carries a high level of risk to your capital and you should only trade with money you can afford to lose. Trading Forex and CFDs may not be suitable for all investors, so please ensure that you fully understand the risks involved and seek independent advice if necessary.
Disclaimer:
The above opinions given constitute general market commentary, and do not constitute the opinion or advice of IC Markets or any form of personal or investment advice.
Any opinions, news, research, analyses, prices, other information, or links to third-party sites contained on this website are provided on an "as-is" basis, are intended only to be informative, is not an advice nor a recommendation, nor research, or a record of our trading prices, or an offer of, or solicitation for a transaction in any financial instrument and thus should not be treated as such. The information provided does not involve any specific investment objectives, financial situation and needs of any specific person who may receive it. Please be aware, that past performance is not a reliable indicator of future performance and/or results. Past Performance or Forward-looking scenarios based upon the reasonable beliefs of the third-party provider are not a guarantee of future performance. Actual results may differ materially from those anticipated in forward-looking or past performance statements. IC Markets makes no representation or warranty and assumes no liability as to the accuracy or completeness of the information provided, nor any loss arising from any investment based on a recommendation, forecast or any information supplied by any third-party.
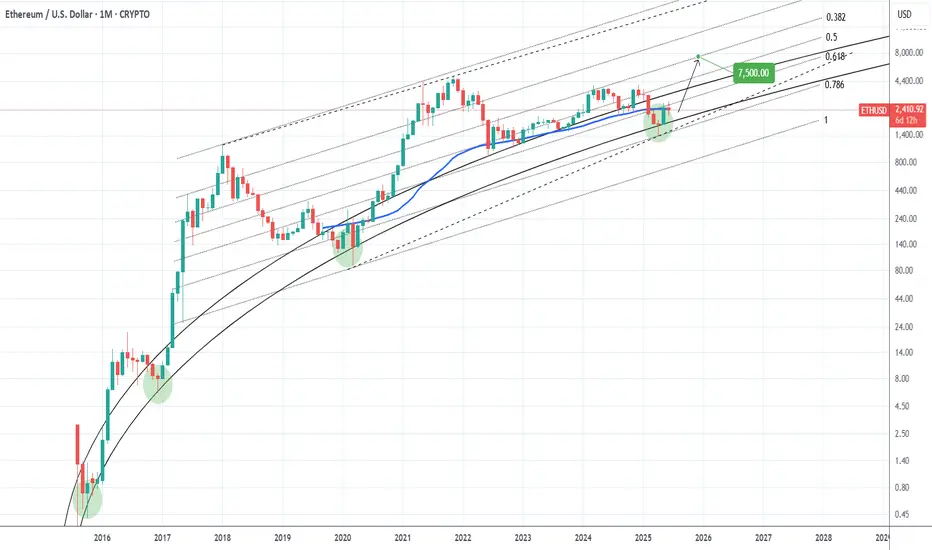
ETHEREUM Massive rally up ahead.Ethereum (ETHUSD) is trading on its 1M MA50, having recovered half of the Trade War losses. Still underperforming against most of its peers but as we've entered the 2nd half of the year, the traditional Bull Cycle rally is up ahead. We expect at least a 0.5 Fibonacci level test of the Channel Up, targeting 7500.
-------------------------------------------------------------------------------
** Please LIKE 👍, FOLLOW ✅, SHARE 🙌 and COMMENT ✍ if you enjoy this idea! Also share your ideas and charts in the comments section below! This is best way to keep it relevant, support us, keep the content here free and allow the idea to reach as many people as possible. **
-------------------------------------------------------------------------------
💸💸💸💸💸💸
👇 👇 👇 👇 👇 👇
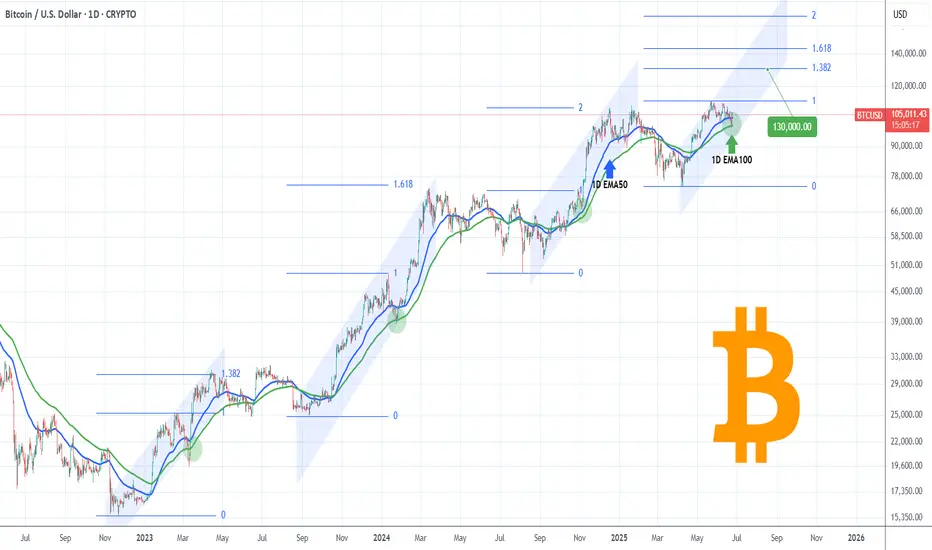
BITCOIN Trump and the 1D EMA100 saved the day!Bitcoin (BTCUSD) rebounded yesterday on its 1D EMA100 (green trend-line) and along with Trump's truce announcement between Israel and Iran, it sent the market into a buying frenzy and back above the $105k mark.
Technically, the 1D EMA100 isn't something to be ignored as since the November 2022 market bottom, each Bullish Leg (Channel Up) that started had a contact (or near) with it that resulted into a considerable bullish extension.
The 1st Channel Up even breached below it, but after rebounding, it reached the 1.382 Fibonacci extension before the next correction. The 2nd Channel Up rebounded exactly on the 1D EMA100, and reached the 1.618 Fibonacci extension. The 3rd Channel Up almost hit the 1D EMA100 and then rebounded to the 2.0 Fibonacci extension.
It is obvious that the pattern follows a progression and each Fib extension peak is higher than on the previous Channel Up. As a result, it is not unlikely to see a High even above the 2.0 Fib ext ($168k) on the current (4th) Channel Up, however on the short-term we would still welcome the 1.382 Fib 'minimum' expectation, targeting $130000.
Do you think we should at least be expecting that? Feel free to let us know in the comments section below!
-------------------------------------------------------------------------------
** Please LIKE 👍, FOLLOW ✅, SHARE 🙌 and COMMENT ✍ if you enjoy this idea! Also share your ideas and charts in the comments section below! This is best way to keep it relevant, support us, keep the content here free and allow the idea to reach as many people as possible. **
-------------------------------------------------------------------------------
💸💸💸💸💸💸
👇 👇 👇 👇 👇 👇
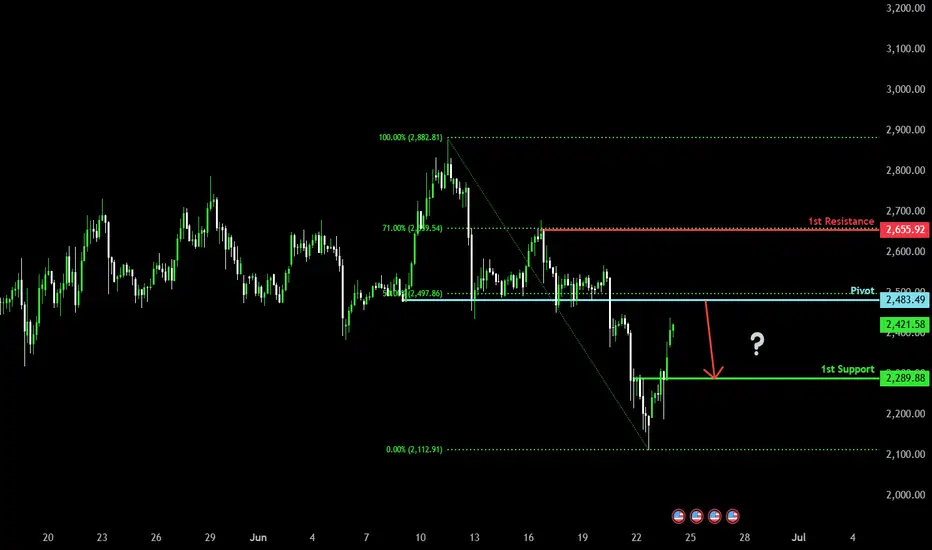
Pullback resistance ahead?The Ethereum (ETH/USD) is rising towards the pivot which has been identified as a pullback resistance that lines up with the 50% Fibonacci retracement and could drop to the 1st support.
Pivot: 2,483.49
1st Support: 2,289.88
1st Resistance: 2,655.92
Risk Warning:
Trading Forex and CFDs carries a high level of risk to your capital and you should only trade with money you can afford to lose. Trading Forex and CFDs may not be suitable for all investors, so please ensure that you fully understand the risks involved and seek independent advice if necessary.
Disclaimer:
The above opinions given constitute general market commentary, and do not constitute the opinion or advice of IC Markets or any form of personal or investment advice.
Any opinions, news, research, analyses, prices, other information, or links to third-party sites contained on this website are provided on an "as-is" basis, are intended only to be informative, is not an advice nor a recommendation, nor research, or a record of our trading prices, or an offer of, or solicitation for a transaction in any financial instrument and thus should not be treated as such. The information provided does not involve any specific investment objectives, financial situation and needs of any specific person who may receive it. Please be aware, that past performance is not a reliable indicator of future performance and/or results. Past Performance or Forward-looking scenarios based upon the reasonable beliefs of the third-party provider are not a guarantee of future performance. Actual results may differ materially from those anticipated in forward-looking or past performance statements. IC Markets makes no representation or warranty and assumes no liability as to the accuracy or completeness of the information provided, nor any loss arising from any investment based on a recommendation, forecast or any information supplied by any third-party.
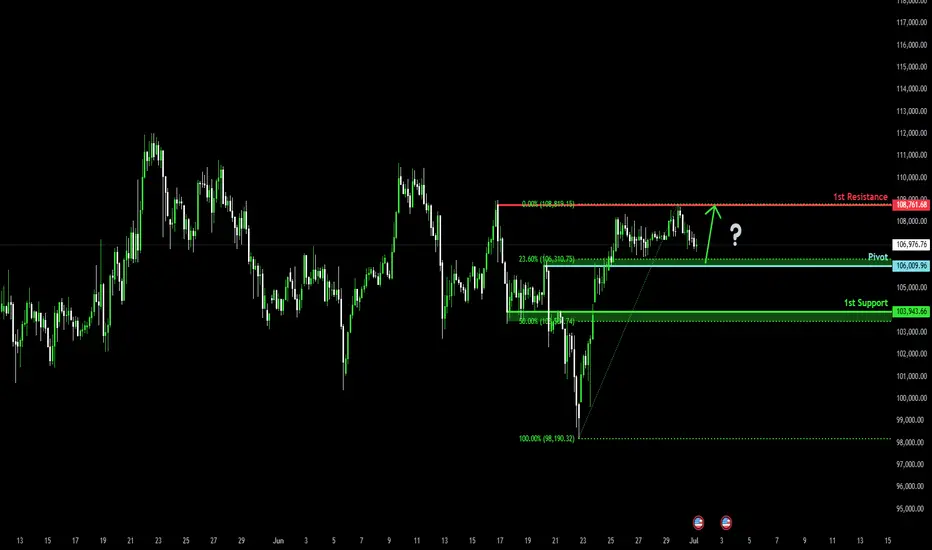
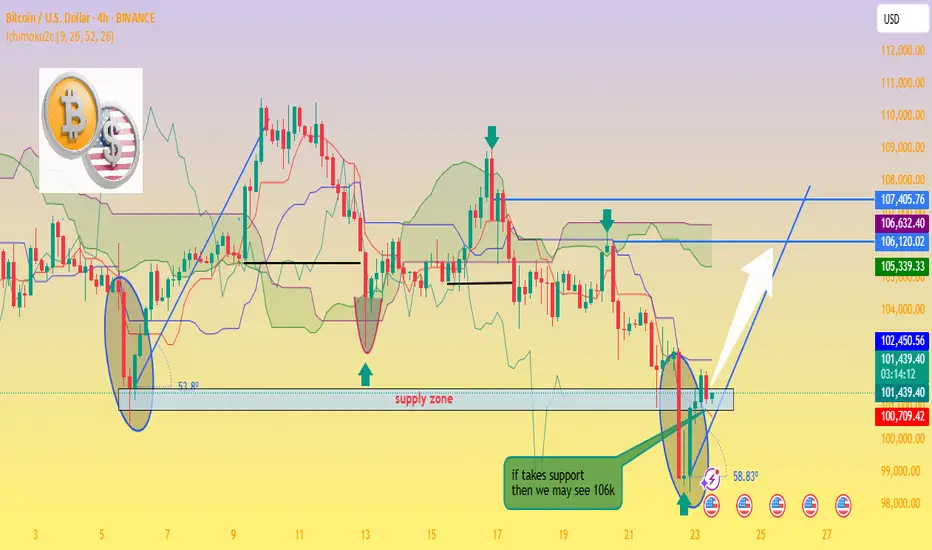
Bitcoin Bounce Alert: Holding the $100K Fortress! 📉 Market Context & Technical Levels
Key support at ~$100K: As the chart shows and multiple analysts confirm, this level continues to act as a strong defence zone. Cointelegraph noted bulls have been “defending the $100K key support level strongly,” triggering bounces during dips
Descending channel overhead: Bitcoin has retraced into a downward channel. A clean breakout above ~107K–109K (past recent peaks) is needed to signal a bullish shift .
Liquidity target at ~106K: Plenty of orders await in that region—flipping it to support may pave the way for another push higher .
📊 Indicators & Momentum
RSI dip near 25 during the latest drop indicates oversold conditions—often a precursor to rebounds
.
Volume surge on rebounds suggests absorbing sell pressure and strong accumulation interest at lower levels.
🚩 Key Price Zones to Watch
Level Significance
$100K Crucial support; losing it risks a slide toward $95K–97K or even $92K
.
$105K–106K Liquidity zone; flipping here as support could confirm upward momentum .
$107K–109K Resistance from channel tops and prior highs; a successful break is key to next leg up .
$112K–$112K+ If breakout occurs, upside targets extend toward prior ATH near $112K and beyond .
🎯 Chart Analysis Summary
Your chart shows three distinct bounces from the $100K–100.7K supply zone (highlighted in blue) and the latest one includes a sharp wick and rebound. This aligns with broader market dynamics emphasizing support at $100K and building liquidity at $106K. The arrow projection signals a probable retest of ~106K, with room to challenge ~107–109K after consolidation.
🧭 Trade Outlook
Bullish scenario: Hold above $100K → reclaim $106K → trendline breakout → potential rally to $112K+.
Bearish risk: Fails support at $100K → breakdown toward $95K–92K region.
📌 Bottom Line
Support $100K is alive and well. Bounces have been crisp and volume-backed.
Next test lies at $105–106K. That’s the battleground—flip it, and we may see bitcoin reclaim recent highs.
Watch the channel overhead (~107K–109K). A breakout could open the door to fresh records.
✅ Conclusion: BTC is defending its psychological base firmly. If this zone holds once more, the path to $106K and beyond is in focus. Breaking above demands conviction, but it’s the pivot to watch.
BITCOIN Is this just a giant Bull Flag??Bitcoin (BTCUSD) saw a strong sell-off yesterday in the aftermath of the U.S. strike in Iran and fears of retaliation, but in later hours recovered some of the lost ground. The recovery is being extended into the Asian and early E.U. hours today and the emerging Channel Down pattern already draws strong similarities with the one in December 17 2024 - January 13 2025.
Both broke below their respective 1D MA50 (blue trend-lines) to form a Lower Low, which in the case of Jan 2025, it initiated a rebound that tested the All Time High (ATH) Resistance. See also how similar their 1D RSI patterns are, testing the same Support level too (41.20).
Given that this time the uptrend has been much shorter since the April 07 2025 Low, this Channel Down may be nothing but a giant Bull Flag in the middle of a standard Bull Cycle Leg. Until confirmed with a 1W candle closing above the ATH Resistance though, the medium-term Target is $111900.
Notice also the formation today of a 1D MA100/200 Bullish Cross, the first since November 13 2024.
So what do you think? Is $111900 your short-term Target? Feel free to let us know in the comments section below!
-------------------------------------------------------------------------------
** Please LIKE 👍, FOLLOW ✅, SHARE 🙌 and COMMENT ✍ if you enjoy this idea! Also share your ideas and charts in the comments section below! This is best way to keep it relevant, support us, keep the content here free and allow the idea to reach as many people as possible. **
-------------------------------------------------------------------------------
💸💸💸💸💸💸
👇 👇 👇 👇 👇 👇

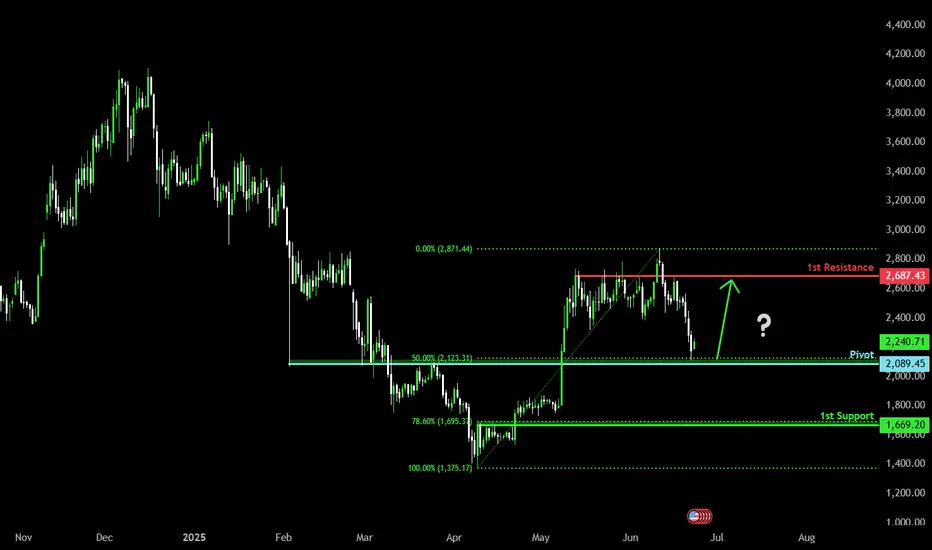
Bullish bounce off 50% Fibonacci support?The Ethereum (ETH/USD) is reacting off the pivot which has been identified as an overlap support and could bounce to the 1st resistance.
Pivot: 2,089.45
1st Support: 1,669.20
1st Resistance: 2,687.43
Risk Warning:
Trading Forex and CFDs carries a high level of risk to your capital and you should only trade with money you can afford to lose. Trading Forex and CFDs may not be suitable for all investors, so please ensure that you fully understand the risks involved and seek independent advice if necessary.
Disclaimer:
The above opinions given constitute general market commentary, and do not constitute the opinion or advice of IC Markets or any form of personal or investment advice.
Any opinions, news, research, analyses, prices, other information, or links to third-party sites contained on this website are provided on an "as-is" basis, are intended only to be informative, is not an advice nor a recommendation, nor research, or a record of our trading prices, or an offer of, or solicitation for a transaction in any financial instrument and thus should not be treated as such. The information provided does not involve any specific investment objectives, financial situation and needs of any specific person who may receive it. Please be aware, that past performance is not a reliable indicator of future performance and/or results. Past Performance or Forward-looking scenarios based upon the reasonable beliefs of the third-party provider are not a guarantee of future performance. Actual results may differ materially from those anticipated in forward-looking or past performance statements. IC Markets makes no representation or warranty and assumes no liability as to the accuracy or completeness of the information provided, nor any loss arising from any investment based on a recommendation, forecast or any information supplied by any third-party.
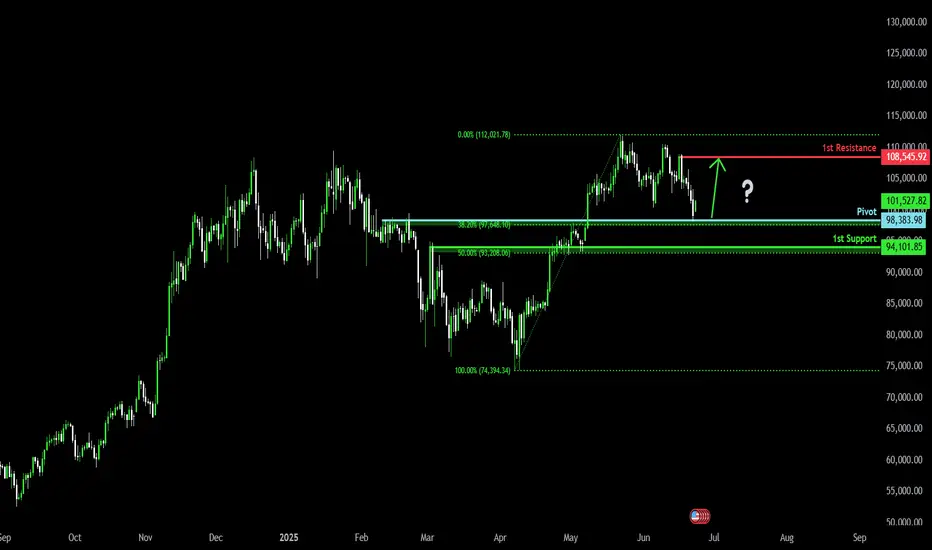
Bullish bounce off pullback support?The Bitcoin (BTC/USD) is reacting off the pivot and could bounce to the 1st resistance which acts as a pullback resistance.
Pivot: 98,383.98
1st Support: 94,101.85
1st Resistance: 108,545.92
Risk Warning:
Trading Forex and CFDs carries a high level of risk to your capital and you should only trade with money you can afford to lose. Trading Forex and CFDs may not be suitable for all investors, so please ensure that you fully understand the risks involved and seek independent advice if necessary.
Disclaimer:
The above opinions given constitute general market commentary, and do not constitute the opinion or advice of IC Markets or any form of personal or investment advice.
Any opinions, news, research, analyses, prices, other information, or links to third-party sites contained on this website are provided on an "as-is" basis, are intended only to be informative, is not an advice nor a recommendation, nor research, or a record of our trading prices, or an offer of, or solicitation for a transaction in any financial instrument and thus should not be treated as such. The information provided does not involve any specific investment objectives, financial situation and needs of any specific person who may receive it. Please be aware, that past performance is not a reliable indicator of future performance and/or results. Past Performance or Forward-looking scenarios based upon the reasonable beliefs of the third-party provider are not a guarantee of future performance. Actual results may differ materially from those anticipated in forward-looking or past performance statements. IC Markets makes no representation or warranty and assumes no liability as to the accuracy or completeness of the information provided, nor any loss arising from any investment based on a recommendation, forecast or any information supplied by any third-party.
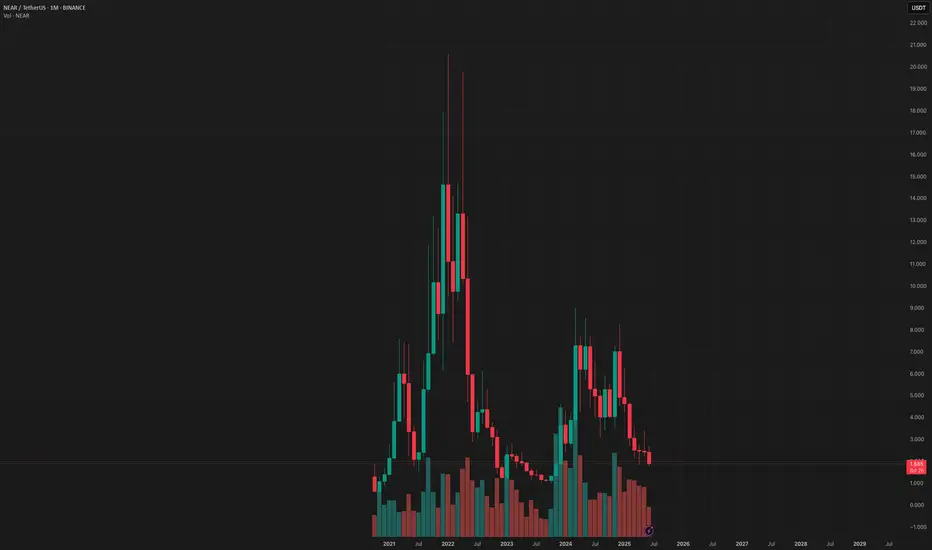
YOLO Near USDT is a stellar buy here HUGE UPSIDELast cycle we saw a large correction to these levels before seeing a huge altcoin season. I believe we will see another run this cycle.
Near is a entry between $1.90 and 1.60.
Sell targets 8 20% sell
$12 20% sell
$16 20% sell
$20 20% sell
20% sell: Let it rideeeee to euphoria
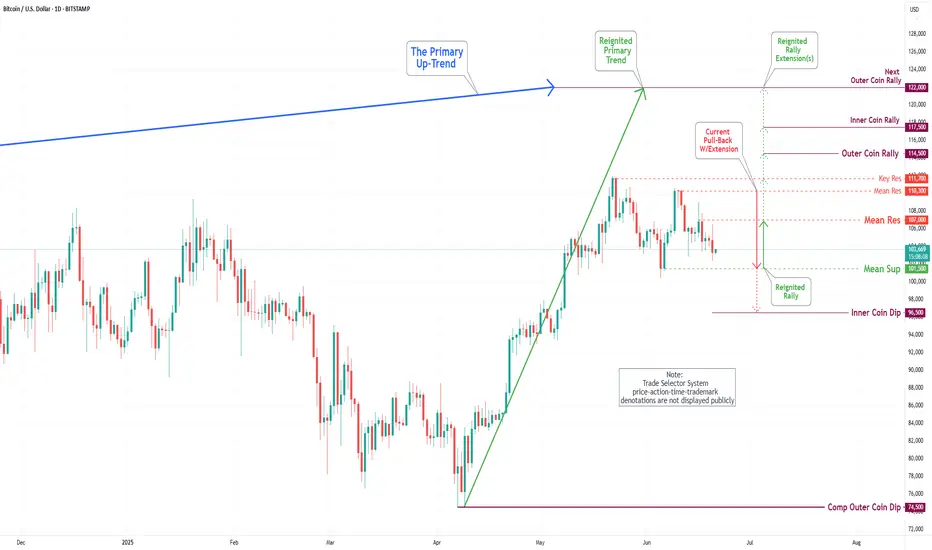
Bitcoin(BTC/USD) Daily Chart Analysis For Week of June 20, 2025Technical Analysis and Outlook:
In the recent trading session, Bitcoin exhibited an upward trend; however, it subsequently experienced a significant decline from the established Mean Resistance level at 110300. On Friday, Bitcoin exhibited notable price action, characterized by a pump-and-dump scenario. At this juncture, Bitcoin is retracing downwards as it seeks to approach the Mean Support level at 101500 and the ultimate Inner Coin Dip at 96500. It is essential to acknowledge the potential for an upward rally from the Mean Support levels of $101500 and/or the Inner Coin Dip at $96500. Such a rally could culminate in a retest of the Mean Resistance level at $107000.
BITCOIN This is the long-term picture. Don't get distracted.Bitcoin (BTCUSD) has been consolidating lately after making a new All Time High (ATH) last month and this is already making part of the market nervous over whether that's the Cycle Top or not.
This is one of those times when it would be best to ignore the short-term noise/ volatility and stick to the long-term picture. And that's exactly what's shown on this chart, with BTC on the 1M time-frame showing the incredible symmetry among its 4-year Cycles, with Bear Markets lasting 12 - 13 months and Bull Markets 35.
Based on that, this Cycle's Top is expected to be priced by October (2025). This also matches the Sine Waves as implied by the 1M RSI, which as been trading within a Channel Down (diminishing returns) since Bitcoin's inception.
So do you also think that we have around 4 months before the market tops? Feel free to let us know in the comments section below!
-------------------------------------------------------------------------------
** Please LIKE 👍, FOLLOW ✅, SHARE 🙌 and COMMENT ✍ if you enjoy this idea! Also share your ideas and charts in the comments section below! This is best way to keep it relevant, support us, keep the content here free and allow the idea to reach as many people as possible. **
-------------------------------------------------------------------------------
💸💸💸💸💸💸
👇 👇 👇 👇 👇 👇

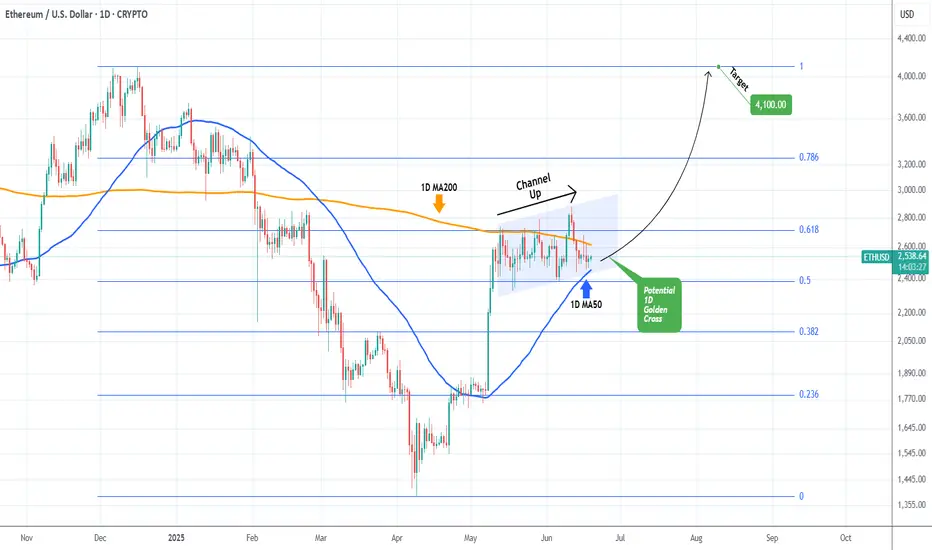
ETHEREUM Battling to hold its 1D MA50.Ethereum (ETHUSD) has been trading within a 5-week Channel Up pattern and in the past 2 days almost tested its 1D MA50 (blue trend-line). So far this is holding, showcasing the strong presence of buyers in that price region, which also happens to be the bottom of that Channel Up.
Ahead of a 1D Golden Cross that may potentially be formed in a week or so, this is the strongest buy signal we get since the April 09 bottom. Given also that the price is trading close to the 0.5 Fibonacci retracement level from the December 16 2024 High, the upside potential is significant. The obvious medium-term Target is that High at 4100.
-------------------------------------------------------------------------------
** Please LIKE 👍, FOLLOW ✅, SHARE 🙌 and COMMENT ✍ if you enjoy this idea! Also share your ideas and charts in the comments section below! This is best way to keep it relevant, support us, keep the content here free and allow the idea to reach as many people as possible. **
-------------------------------------------------------------------------------
💸💸💸💸💸💸
👇 👇 👇 👇 👇 👇
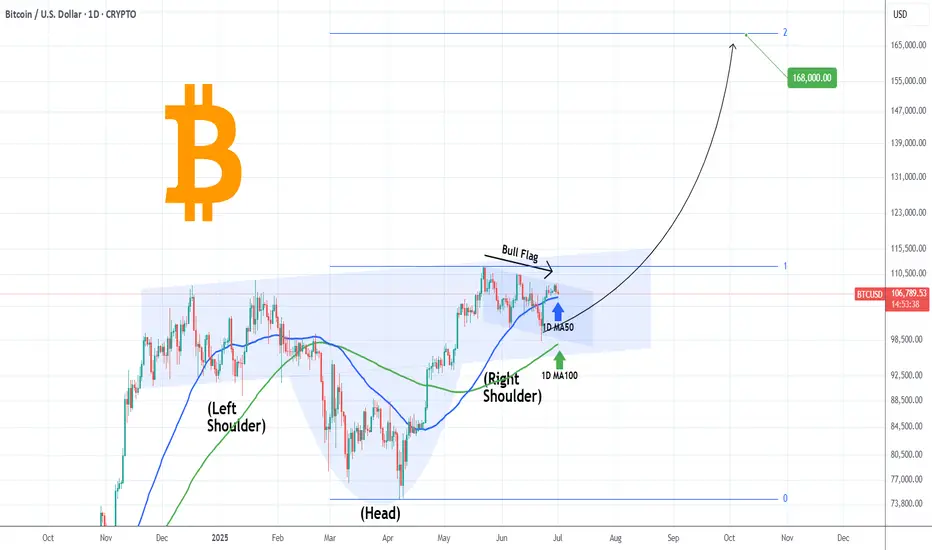
BITCOIN All boxes checked. Couldn't be more bullish than this!Bitcoin (BTCUSD) has filled numerous bullish conditions with the latest being holding the 1D MA50 (blue trend-line) as Support. This is basically the 3rd time testing and holding it since June 05. Even if that doesn't hold, we have the 1D MA200 (orange trend-line) directly below it as the ultimate long-term Support.
This trend-line just so happens to be exactly on the neckline of the Right Shoulder on the long-term Inverse Head and Shoulders (IH&S) pattern that has been in development since December 17 2024.
On top of all these, the market also formed a 1D Golden Cross a month ago, always a strong long-term bullish signal. IH&S patterns typically target their 2.0 Fibonacci extension, which sits at $168000.
Is that another indication that Bitcoin is going after 150k at least on its next run? Feel free to let us know in the comments section below!
-------------------------------------------------------------------------------
** Please LIKE 👍, FOLLOW ✅, SHARE 🙌 and COMMENT ✍ if you enjoy this idea! Also share your ideas and charts in the comments section below! This is best way to keep it relevant, support us, keep the content here free and allow the idea to reach as many people as possible. **
-------------------------------------------------------------------------------
💸💸💸💸💸💸
👇 👇 👇 👇 👇 👇

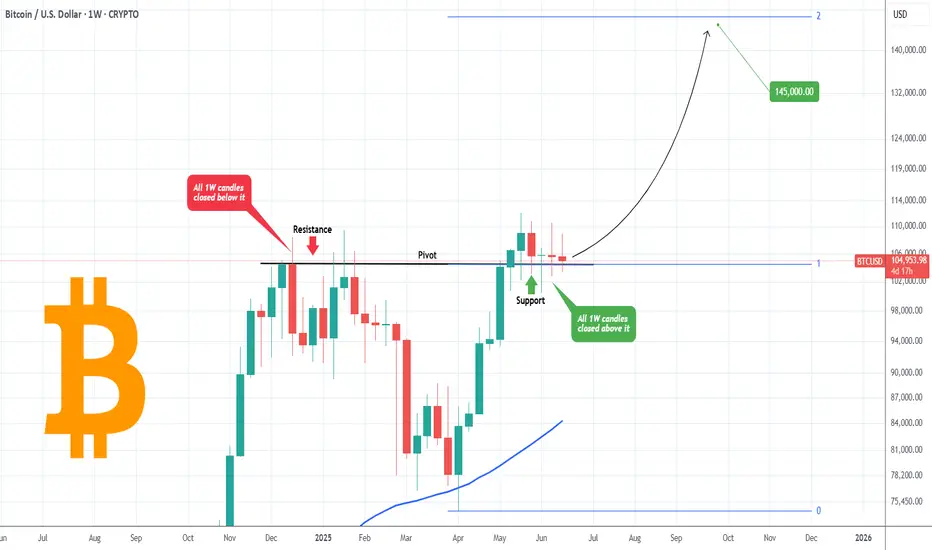
BITCOIN The secret trend-line that no one notices..Bitcoin (BTCUSD) was under heavy selling pressure yesterday and even the 1D time-frame turned marginally bearish. What most seem to ignore however is the larger picture. On the 1W time-frame, BTC has managed to close the last 5 weeks above the Pivot trend-line.
What that trend-line is? It is the level that initially started as a Resistance from December 09 2024 to January 27 2025, closing all 1W candles below it, despite occasional candle wicks breaking above it. That confirmed it's status as a Resistance at the time.
Now we see the opposite, five straight 1W candles closing above that Pivot line. Check in particular, how flat the last two 1W candles closed, showcasing no just the high volatility that the market is under in the past weeks, but also the same amount of sellers and buyers existing in the market (neutral).
This is an indication that this is a consolidation phase, preparing BTC for the next rally. If we place the top Fibonacci level (1.0) on that Pivot, we get the 2.0 Fib extension just above the $145000 mark. That gels perfectly with various other studies we've conducted showing a similar long-term Target.
So do you think the Pivot line will hold and push Bitcoin to $145k? Feel free to let us know in the comments section below!
-------------------------------------------------------------------------------
** Please LIKE 👍, FOLLOW ✅, SHARE 🙌 and COMMENT ✍ if you enjoy this idea! Also share your ideas and charts in the comments section below! This is best way to keep it relevant, support us, keep the content here free and allow the idea to reach as many people as possible. **
-------------------------------------------------------------------------------
💸💸💸💸💸💸
👇 👇 👇 👇 👇 👇