IBIT – Bull Flag + Trend-Based Fib Targets Lined Up🔍 Price Action Setup
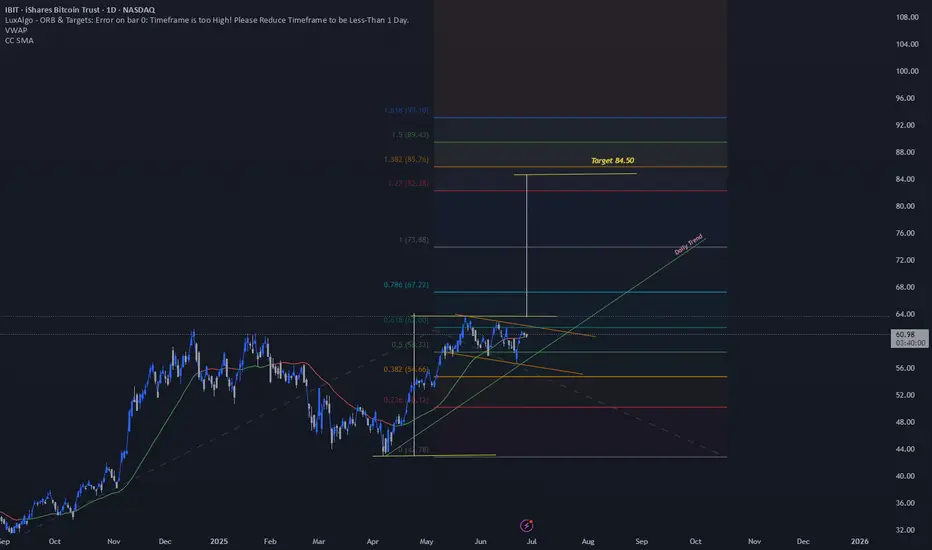
IBIT is forming a tight bull flag just beneath key resistance at $64 after a strong impulsive move off the $42.75 base. Structure remains bullish with price holding above the 20 EMA, and volume compression setting the stage for a breakout.
📈 Trend-Based Fibonacci Extensions
If this flag breaks, here's how the upside unfolds based on the trend-based Fib extension:
1.27 – $82.50
1.382 – $85.75 (Measured Move Target)
1.50 – $89.50
1.618 – $93.00 (Full Extension)
These levels align with the prior flagpole projection and market structure above. If bulls step in on volume, $85.75 becomes the logical first destination.
🌊 ETF Inflows Confirm the Narrative
IBIT has pulled in roughly $3.3B in recent inflows, leading the pack during a 12-day net inflow streak across spot Bitcoin ETFs. Institutions are clearly still positioning, and that's reflected in the tape. Tuesday alone brought $436M+ into spot Bitcoin ETFs.
₿ BTC Leading the Way
Bitcoin is holding strong above prior resistance and pushing higher. IBIT looks like it’s just waiting on a breakout confirmation to follow.
📌 Key Trade Levels
Breakout Trigger: Close above $64
Target Zone: $85.75 first, then extended to $93.00
Invalidation: Break below $56 structure
—
🧠 This is not financial advice — just a look at structure and flow through the DC Trading lens.
📲 Follow the journey on IG: @dc_trading_journey
Cryptoetf
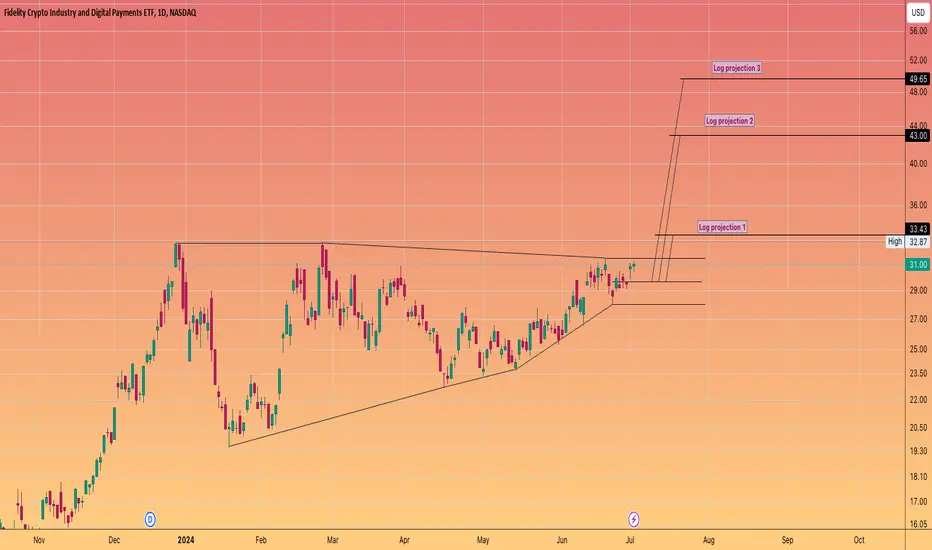
#BITQ Crypto index ETF ready to blow!Been a tough ride for #Crypto investors
But our patience is set to be rewarded
How quickly?
I expect these next two weeks will tell all..

#BITCOIN is down today BUT #FDIG suggests upsidefor the #crypto space
as are the #BTC miners which are performing admirably.
So we have a disconnect going on between wall st and the overall crypto space which is non euphoric and has completely reset sentiment since March.
My view this gets resolved to the upside , follow the smart money.
#HVF
@TheCryptoSniper
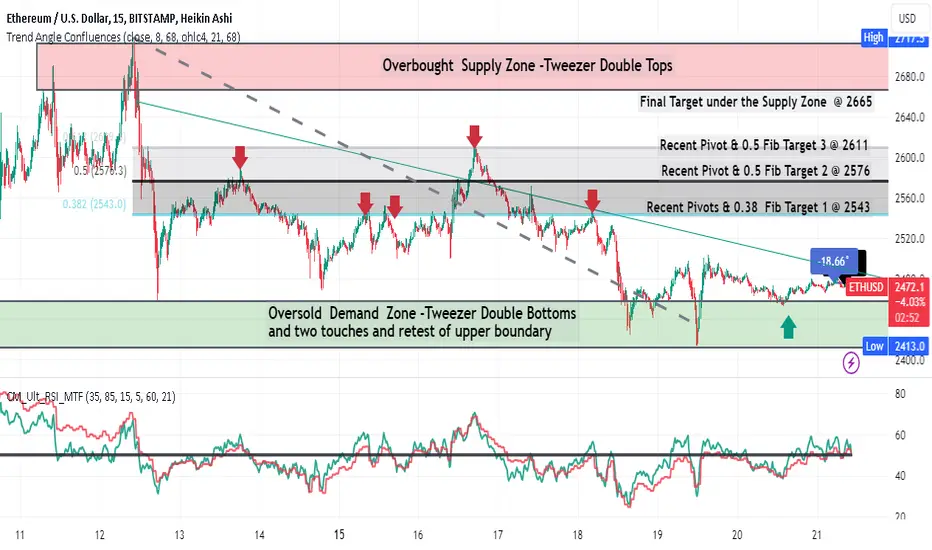
ETHUSD LONG Sitting on Demand Zone Fib TargetsOn this 15 minute chart from the candlesticks, supply and demand zones are tool drawn.
The resistance trendline and flat bottom form a triangle pattern. The Fibonnaci retracement
tool is used to find likely targets which are also pivots to the left. The dual TF RSI indicator
by Chris Moody shows both the faster 5 min and the slower 60 min rising over the 50 level with
the faster higher than the slower. The times straddle the chart time. Based on all of this
I will trade a swing trade long on forex with leverage set at 20. Partials taken 25% at each
target to minimize risk. Stop loss initially 40 ( the height of the green demand zone) then
raised by 22 every time price moves by 20. Expecting 60% profit overall in consideration
of a tiered closure and the leverage for a trade of 10-20 days depending on the trend angle
moving forward.
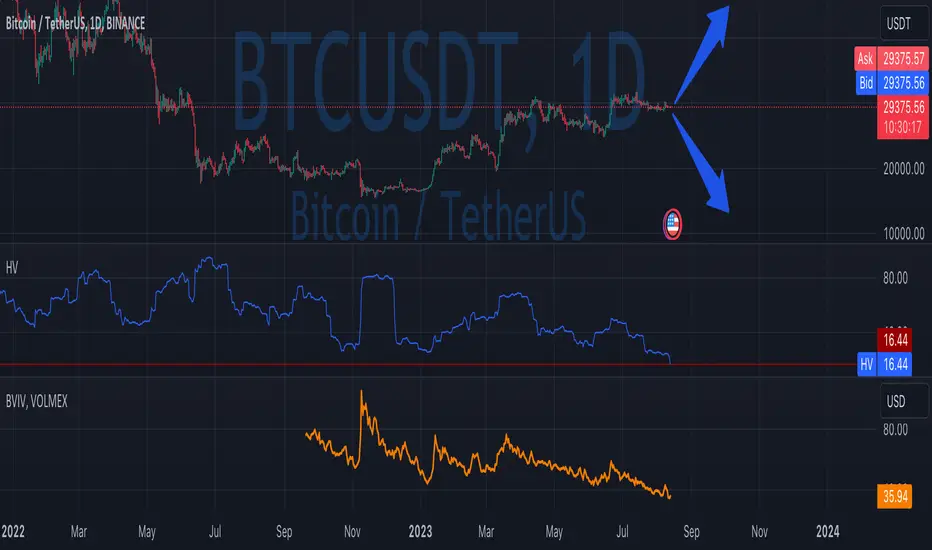
Volatility for Bitcoin is at all-time lowsBoth historical (30 days) and implied volatility for Bitcoins is at all-time low levels.
It seems like trades waiting for news about crypto ETFs approvals.
It might make sense to buy straddle/strangle to put a market neutral positions expecting big move and increase in volatility in Q4/2023.
Disclaimer
Please remember that past performance may not be indicative of future results.
Due to various factors, including changing market conditions, the strategy may no longer perform as good as in historical backtesting.
This post and/or the script don’t provide any financial advice.