TradeCityPro | Bitcoin Daily Analysis #127👋 Welcome to TradeCity Pro!
Let’s dive into the Bitcoin analysis and the key crypto indexes. In this analysis, as usual, I want to review the New York session futures triggers for you.
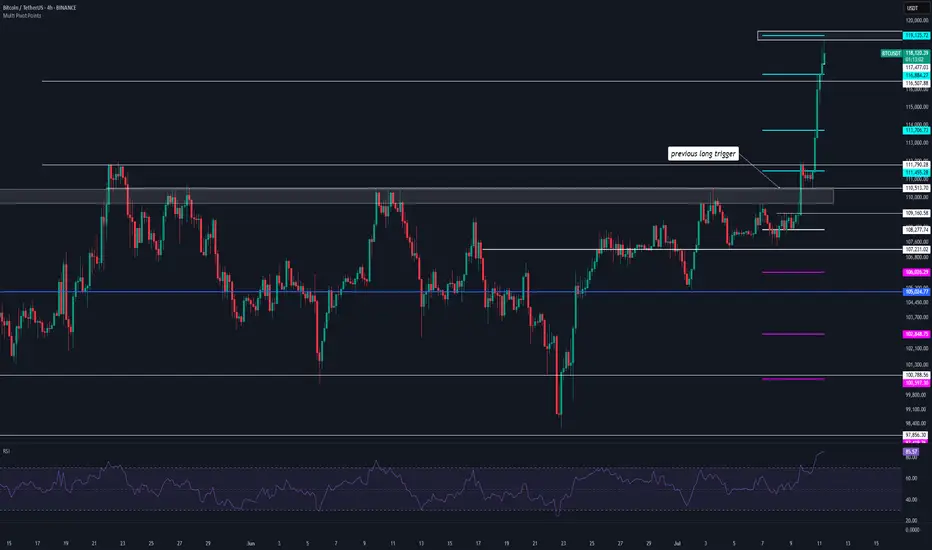
⏳ 1-Hour timeframe
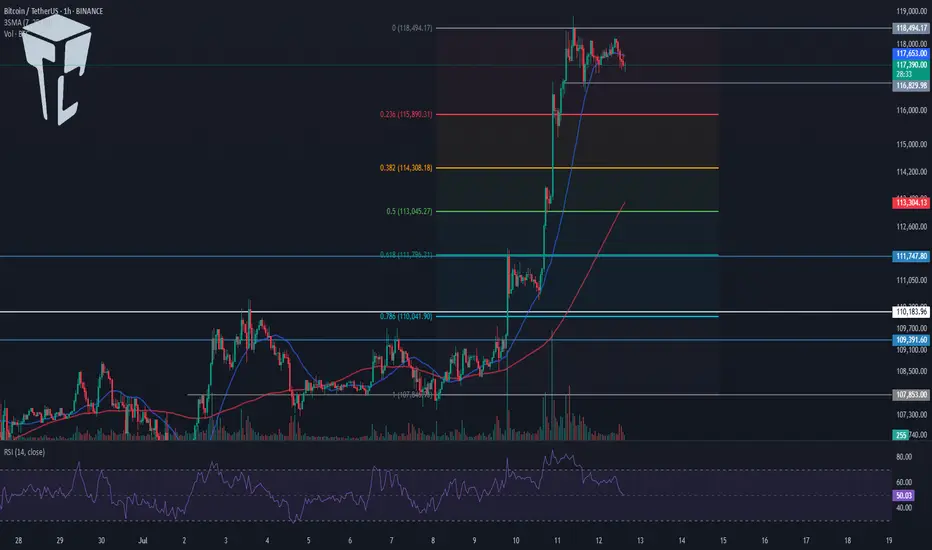
In the 1-hour timeframe, as you can see, Bitcoin, after the correction down to the 116829 level, is now breaking the 118494 top again.
🔔 This move can potentially start Bitcoin’s next bullish leg. In that case, I think this leg will be a strong one because the correction was very shallow and didn’t even reach the 0.236 Fibonacci level, so the price may perform another sharp move.
💥 On the other hand, the RSI oscillator is entering Overbuy, which increases the probability of a bullish scenario and a sharp next leg.
📈 If the 118494 level is broken, we can open a long position. We already have suitable confirmations for this position since volume and RSI are aligned with price, and also the SMA25 is supporting the price and pushing it upward.
👑 BTC.D Analysis
Let’s move on to Bitcoin Dominance. The dominance trend is still bearish and continuing downward.
⭐ Currently, it’s sitting on a key support at 64.44, and breaking this level can continue the bearish move in dominance.
📅 Total2 Analysis
Let’s go over Total2. Yesterday, after correcting to the 1.26 level, it seems the next bullish move has started and it’s heading toward 1.3.
🎲 The main resistance I see for Total2 is still 1.33, and I believe this will be the main ceiling that Total2 will struggle with.
📅 USDT.D Analysis
Moving on to Tether dominance. This index is still dropping and is now sitting at the 4.36 support.
✨ Breaking this level will start the next bearish leg, and the price can move toward 4.22. If a correction occurs, the first level will be 4.49.
❌ Disclaimer ❌
Trading futures is highly risky and dangerous. If you're not an expert, these triggers may not be suitable for you. You should first learn risk and capital management. You can also use the educational content from this channel.
Finally, these triggers reflect my personal opinions on price action, and the market may move completely against this analysis. So, do your own research before opening any position.
Cryptomarket

TradeCityPro | HBAR Rebounds Sharply After Trendline Breakout👋 Welcome to TradeCity Pro!
In this analysis, I’m going to review the HBAR coin for you—one of the RWA and Layer1 crypto projects, currently ranked 16 on CoinMarketCap with a market cap of 9.95 billion dollars.
📅 Daily Timeframe
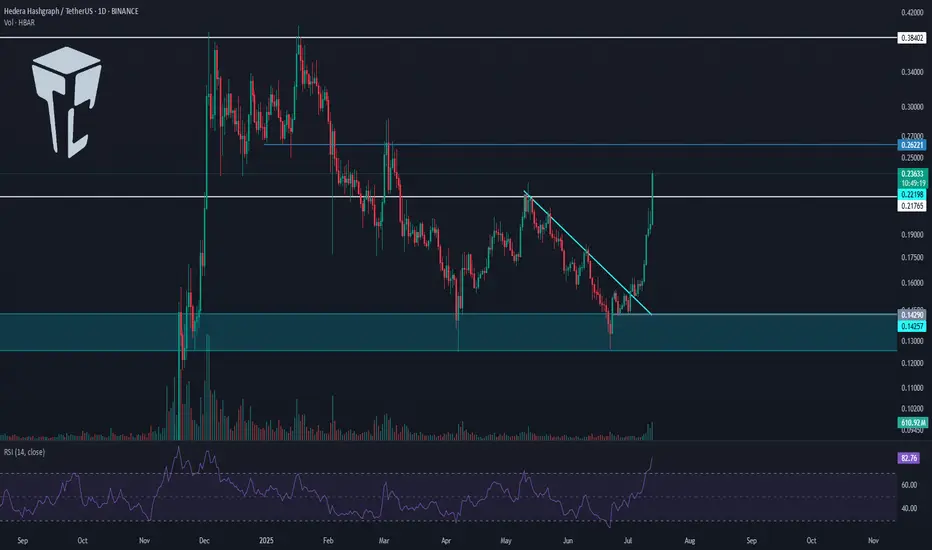
On the daily chart, as you can see, after a bullish rally toward the end of 2024, HBAR entered a corrective phase and is currently still in this correction.
✨ A major support zone (highlighted on the chart) was established, and a range box was formed between this zone and 0.21765 where price had been consolidating.
💥 There was also a descending trendline within this box that the price recently broke through, triggering strong bullish momentum. The price has now even broken above the 0.21765 level.
✔️ A significant increase in buying volume has entered the market, and with RSI entering the Overbuy zone, this move looks poised to continue even more sharply.
🔔 If this bullish momentum persists, the next targets are 0.26221 and 0.38402. If you already have an open position, these levels could be suitable for partial profit-taking.
🛒 If you're looking to buy this coin in spot, the breakout and confirmation above 0.21765 is a decent entry. However, the current stop-loss range is quite wide, so reaching a good risk-to-reward ratio might take longer with this trigger.
📈 The next potential spot triggers are 0.26221 and 0.38402. A breakout above 0.38402 would likely signal the start of a new major bullish leg.
📝 Final Thoughts
This analysis reflects our opinions and is not financial advice.
Share your thoughts in the comments, and don’t forget to share this analysis with your friends! ❤️
Are we on Super Bullish Express Highway ? Elliott Waves RoadmapHello friends,
Welcome to RK_Chaarts
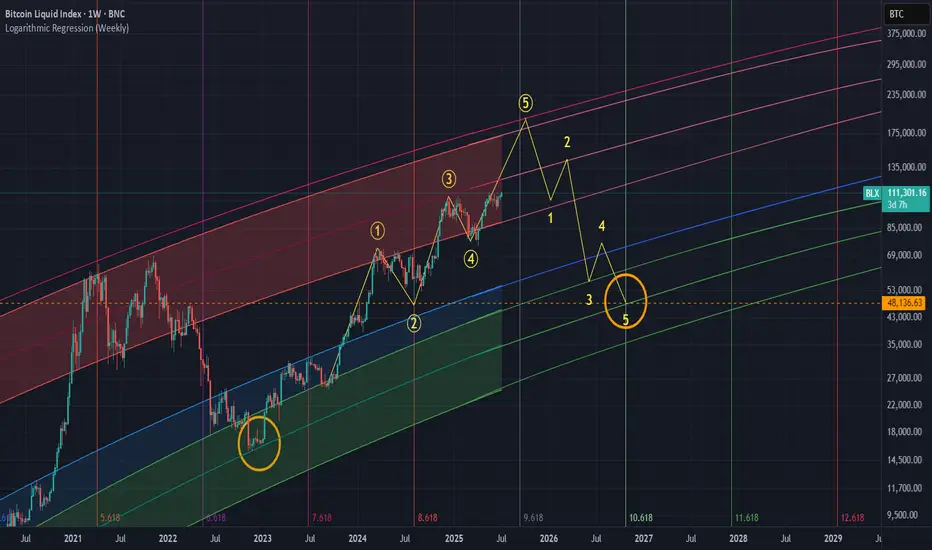
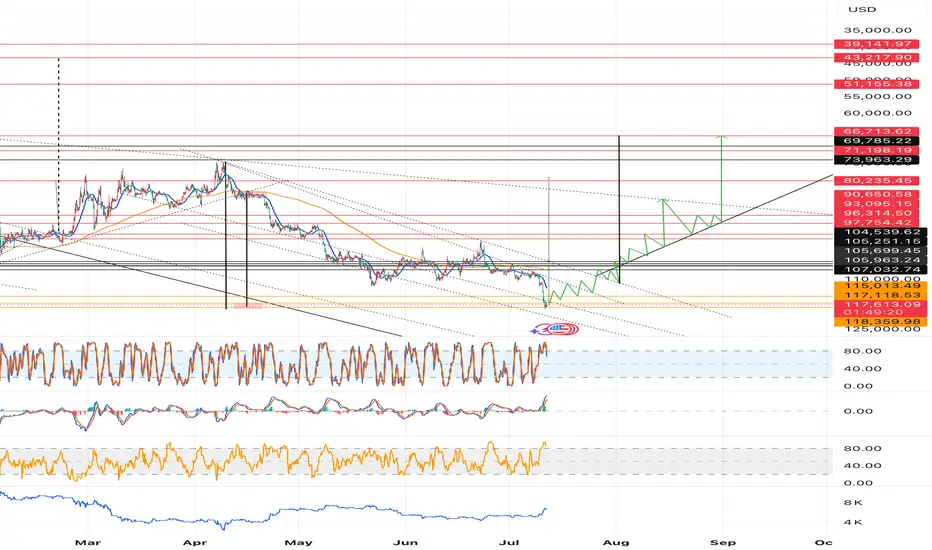
Today we're attempting to analyze Bitcoin's chart, specifically the BTCUSD chart, from an Elliott Wave perspective. Looking at the monthly timeframe chart, which spans the entire lifetime of Bitcoin's data since 2011, we can see the overall structure. According to Elliott Wave theory, it appears that a large Super Cycle degree Wave (I) has completed, followed by a correction in the form of Super Cycle degree Wave (II), marked in blue.
Now, friends, it's possible that we're unfolding Super Cycle degree Wave (III), which should have five sub-divisions - in red I, II, III, IV, & V. We can see that we've completed red I & II, and red III has just started. If the low we marked in red II doesn't get breached on the lower side, it can be considered our invalidation level.
Next, within red III, we should see five primary degree sub-divisions in black - ((1)), ((2)), ((3)), ((4)) & ((5)). We can see that we've completed black ((1)) & ((2)) and black ((3)) has just started. Within black ((3)), we should see five intermediate degree sub-divisions in blue - (1) to (5). Blue (1) has just started, and within blue one, we've already seen red 1 & 2 completed, and red 3 is in progress.
So, we're currently in a super bullish scenario, a third of a third of a third. Yes, the chart looks extremely bullish. We won't commit to any targets here as this is for educational purposes only. The analysis suggests potential targets could be very high, above $150,000 or $200,000, if the invalidation level of $98,240 isn't breached. But again, friends, this video is shared for educational purposes only.
Many people think that the market doesn't move according to Elliott Waves. But friends, here we've tried to analyze from the monthly time frame to the overly time frame. We've definitely aligned the multi-time frame and also aligned it with the principal rules of Elliott Waves, without violating any of its rules.
I agree that the Elliott Wave theory can be a bit difficult, and for those who don't practice it deeply, it can be challenging. But yes, the market moves according to this methodology, following this pattern. This is a significant achievement.
I am not Sebi registered analyst.
My studies are for educational purpose only.
Please Consult your financial advisor before trading or investing.
I am not responsible for any kinds of your profits and your losses.
Most investors treat trading as a hobby because they have a full-time job doing something else.
However, If you treat trading like a business, it will pay you like a business.
If you treat like a hobby, hobbies don't pay, they cost you...!
Hope this post is helpful to community
Thanks
RK💕
Disclaimer and Risk Warning.
The analysis and discussion provided on in.tradingview.com is intended for educational purposes only and should not be relied upon for trading decisions. RK_Chaarts is not an investment adviser and the information provided here should not be taken as professional investment advice. Before buying or selling any investments, securities, or precious metals, it is recommended that you conduct your own due diligence. RK_Chaarts does not share in your profits and will not take responsibility for any losses you may incur. So Please Consult your financial advisor before trading or investing.

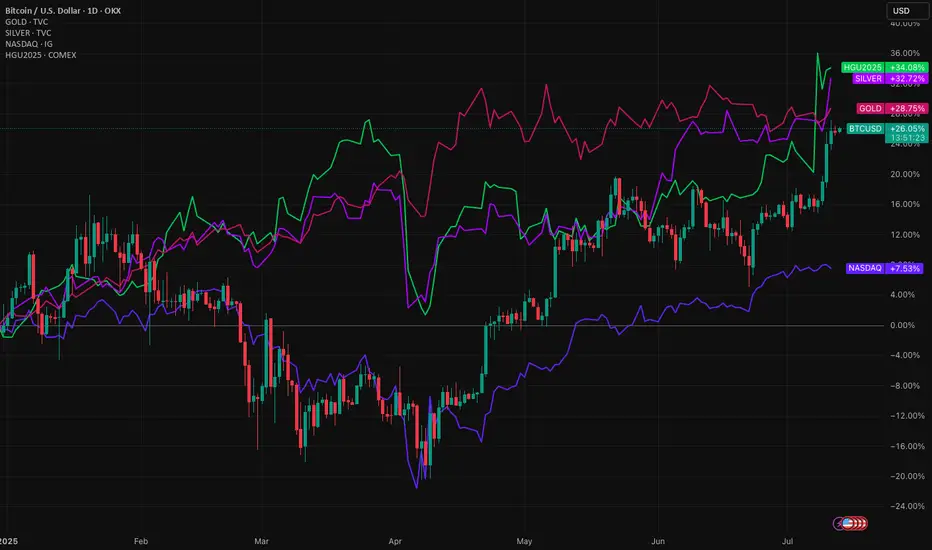
Bitcoin pushes higher, but its not the only game in townBitcoin is up around 26% this year. A strong gain. But it’s not alone. The higher Bitcoin rises, the less the gains become in percentage terms. It's now in a different league, so a $1,000 or $10,000 move its necessarily what it used to be.
Meanwhile, Gold, silver and copper have also pushed higher in 2025. The Nasdaq 100 is up too. All signs point to a weakening US dollar.
When risk assets and commodities rally together, it's a signal. Investors are shifting. Not out of fear, but to diversify away from the dollar. This is a theme that’s building strength.
Gold is up nearly over 25% YTD. Silver even more. Copper, the industrial bellwether, has joined the rally. These aren’t just trades. They’re strategic moves. A hedge against dollar debasement, inflation, and long-term fiscal risks in the US.
The Nasdaq’s rise tells a similar story. Tech stocks benefit when yields fall and the dollar softens. Big tech also has global revenue exposure. A weaker dollar inflates their earnings in foreign currencies.
What ties all this together? Loss of confidence in the dollar as the sole reserve hedge. Too much debt, too much printing. Central banks know it. They’ve been buying gold for years. Now, retail and institutional investors are catching on.
Bitcoin, the digital alternative to gold, gets the headlines. But it’s part of a broader move. The USD remains the world’s most important currency. That’s not changing tomorrow. But its dominance is being questioned in ways we haven’t seen in decades.
This isn’t just a crypto rally. It’s a dollar diversification play. And it’s gaining momentum.
The forecasts provided herein are intended for informational purposes only and should not be construed as guarantees of future performance. This is an example only to enhance a consumer's understanding of the strategy being described above and is not to be taken as Blueberry Markets providing personal advice.
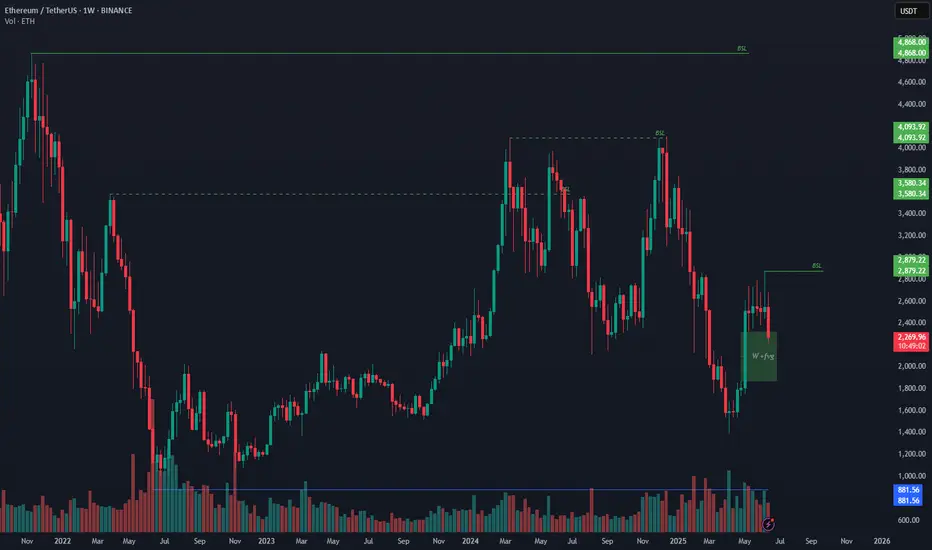
BTC.D Slipping ! ALTSEASON Loading ? This is BTC.D on the daily chart.
It has shown a strong relationship with the 50MA (blue/cyan line), often using it as support. While there were a couple of daily closes below it in the past, they lasted only 1 or 2 candles.
Now we’ve seen 4 consecutive daily closes below the 50MA (including today), which increases the likelihood of a deeper move to search for support.
The next key support zone (green rectangle) is defined by the 200MA (red line) and the 62.25% level (black line) — both of which acted as support before.
If BTC.D drops into that zone, ETH and altcoins could experience a strong bounce.
Always take profits and manage risk.
Interaction is welcome.

BTCUSDTHello Traders! 👋
What are your thoughts on BITCOIN?
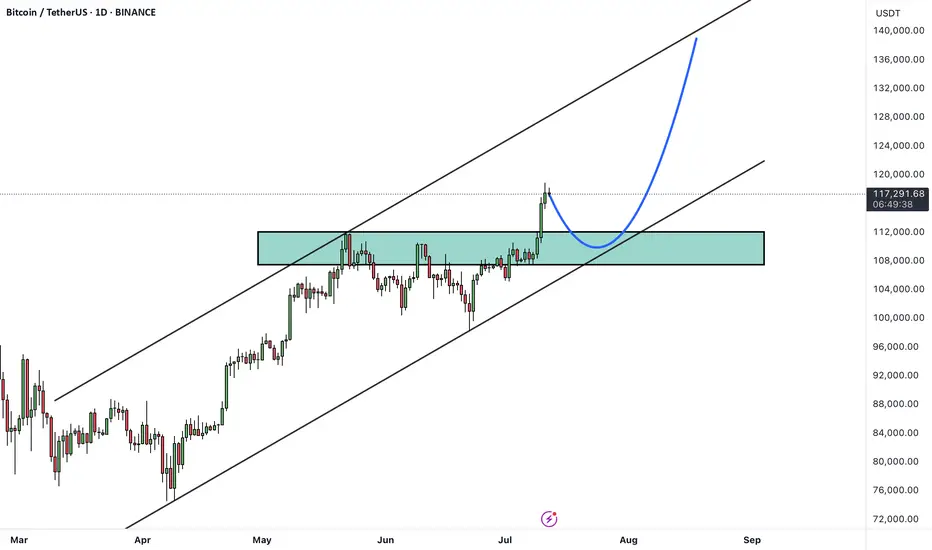
Bitcoin has recently broken above its all-time high and printed a new record high, signaling strong bullish momentum. Currently, the market has entered a consolidation phase, which is typical after such a major breakout.
A pullback toward the previous breakout level (the old all-time high) is expected, which now acts as new support.
After this consolidation and pullback, the price could resume its bullish trajectory and move toward higher targets, including the upper boundary of the current bullish channel.
As long as the price remains above the key support zone, the overall trend remains bullish and any dip could be seen as a buying opportunity within the broader uptrend.
Will this consolidation lead to the next leg up, or is a deeper correction ahead? Share your thoughts below! 🤔👇
Don’t forget to like and share your thoughts in the comments! ❤️
TradeCityPro | Bitcoin Daily Analysis #126👋 Welcome to TradeCity Pro!
Let’s dive into the Bitcoin analysis and key crypto indices. As usual, in this analysis I’ll review the potential triggers for the New York futures session.
⏳ 1-Hour Timeframe
As you can see on the 1-Hour chart, Bitcoin started a bullish move after breaking the 111747 resistance, which continued up to 118494.
✨ Currently, the price is consolidating after reaching that resistance and has formed a range box between 116829 and 118494, fluctuating within this zone.
💥 The RSI oscillator has exited the Overbuy zone and is now near the 50 level. If it drops below 50, there is a possibility of a deeper correction.
⚡️ Confirmation of a deeper correction would come with a close below the 116829 level. The next support areas will be Fibonacci levels, which I have marked on the chart.
✔️ Since the SMA25 has reached the candles and there is no significant momentum yet, we’ll need to wait for the SMA99 to approach the price to see if momentum enters the market.
👑 BTC.D Analysis
Looking at Bitcoin Dominance, yesterday it reached the 64.18 support level and managed to bounce back, closing above 64.44.
🔔 Currently, it’s consolidating above 64.81, and if this holds, the trend could turn bullish for now.
📅 Total2 Analysis
Total2’s main resistance is at 1.33, but the price was rejected at 1.3 and is now correcting toward 1.26.
🔍 If the correction continues, the 0.382 and 0.618 Fibonacci levels would be reasonable areas to watch. If the upward move resumes, the next target will be 1.33.
📅 USDT.D Analysis
Tether Dominance has had a steep drop from 4.72 and has now reached 4.36. If support holds at this level, we could see a correction back toward Fibonacci zones.
🎲 A break below 4.36 would confirm continuation of the downtrend.
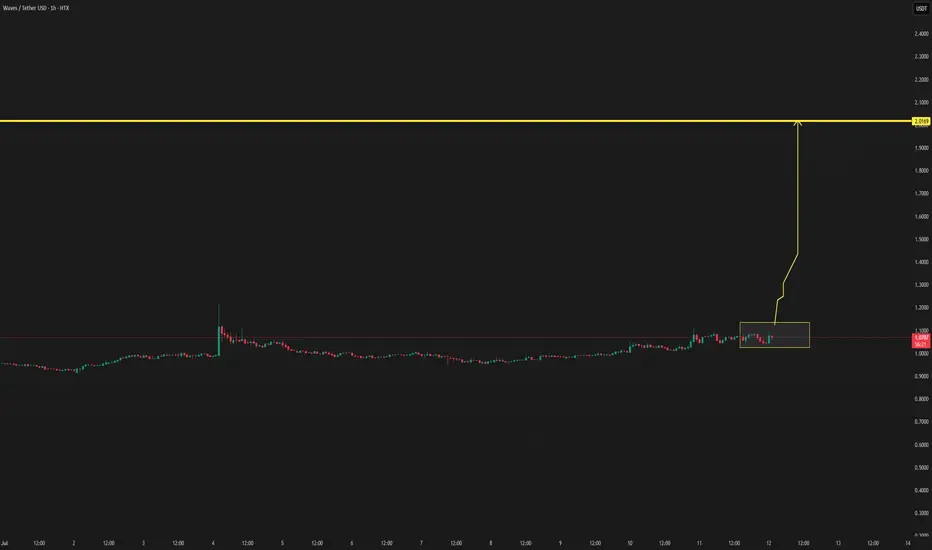
WAVES ON WAY TO $2waves have a high chance to enter a new break to 2 usd, since the last data.
When there is more confirmation, the updates will be below.
XRP is making moves!Will it break $3, or drop back to $2? Previous Cycles showed that a correction might be next in line for the crypto market as a whole. Which means, if it happens, altcoins will get affected a lot...Do not get shaken out, after the correction expect a huge rally, but for now...it might be a perfect point to secure some profit.
Not investment advice.
#xrp #bitcoin #crypto #short #analysis

Bitcoin Looks Ready for LiftoffBitcoin is showing a textbook bullish continuation.
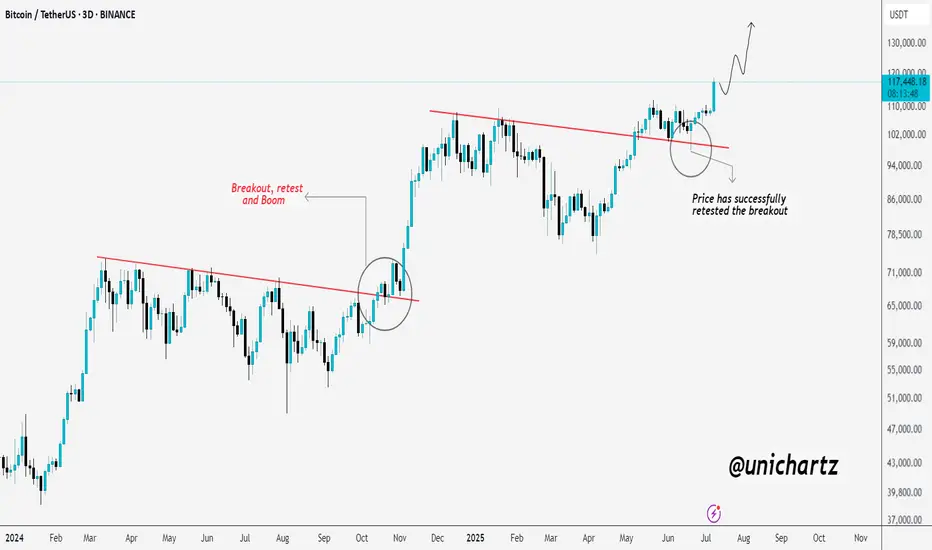
After breaking out of a long-term downtrend line, CRYPTOCAP:BTC came back for a clean retest — just like it did during the last breakout phase. That previous breakout led to a massive rally, and now we're seeing a very similar setup again.
The retest around $94K held perfectly, confirming strong demand and validating the breakout. Since then, price has pushed higher with momentum, now trading above $117K.
If this pattern continues to play out like before, Bitcoin could be eyeing $130K and beyond in the coming weeks.
The structure is strong, the trend is intact, and bulls are clearly in control.
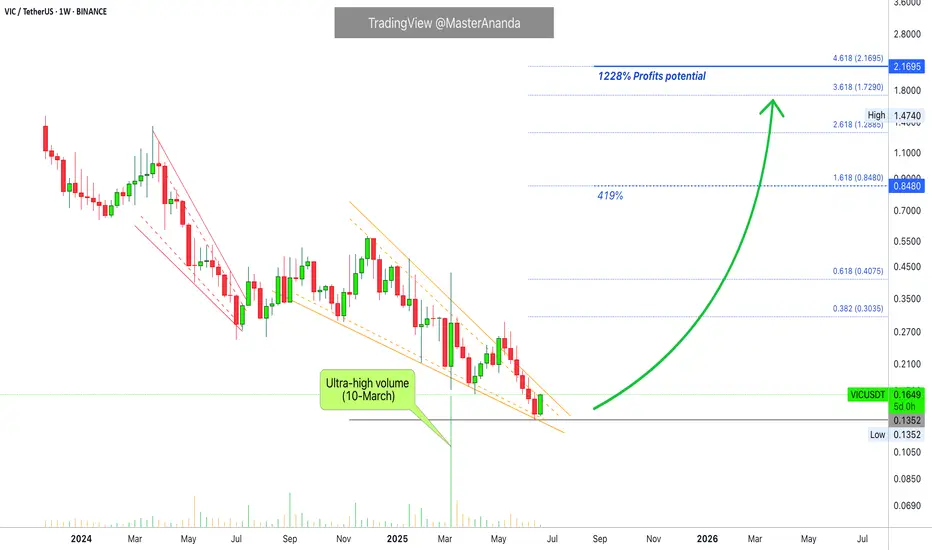
Viction Hits Bottom, 1,228% Growth Potential or HigherViction produced the highest volume ever on the 10-March week. All the other weeks have insignificant volume compared to this one and this session ended closing green. This is a strong signal.
A large part of the altcoins market produced a bottom 10-March.
Another signal that favors the bulls and the development of a bullish wave is the fact that bearish volume is very low as the market moves to produce lower lows. The final bottom happened last week and this week VICUSDT is full green.
There is a falling wedge pattern.
Seeing marketwide action and knowing the year is 2025 and we are already late for the bull market phase, we can be ready and should be prepared for maximum growth.
Thank you for reading.
Namaste.
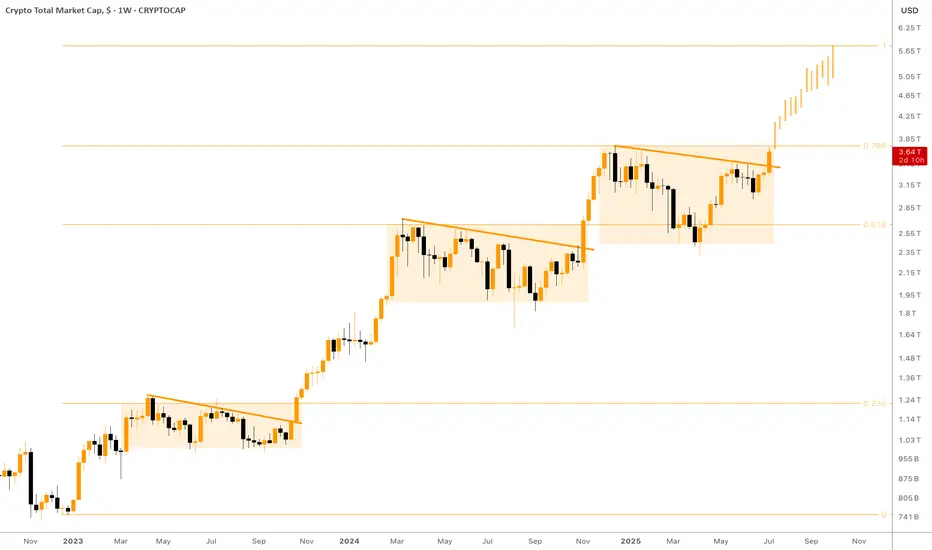
[CRYPTO] - Last Pump of the BULL CYCLE is ComingWe can see a highly organised bull cycle , with each multi-month consolidation wedge followed by a major leg upward, ending in breakout and continuation.
At the moment the CRYPTOCAP:TOTAL is breaking through the descending resistance again and ready to break thorough the 0.786 Fibo level as well - clear sign of the new up-rally beginning. Prior patterns (Q3 2023 and Q2 2024) led to vertical rallies , and the current structure suggests another leg may target the $6T+ zone in coming quarters.
What makes this different from past cycles is the underlying strength in Ethereum and other Altcoins. CRYPTOCAP:BTC.D has started to roll off highs, while projects like CRYPTOCAP:SOL , CRYPTOCAP:SUI and AI-related chains ( NYSE:FET , GETTEX:TAO , EURONEXT:RNDR ) are gaining TVL and developer traction. This is not just retail speculation—institutional capital is increasingly driving flows.
Moreover , Bitcoin ETF keeps getting huge daily inflows, the narrative of Coinbase including in S&P500 and Stablecoins velocity rising helps in spreading the crypto narrative between insituational & retail investors.
You can read more about why I expect a ton of money to inflow crypto in the next 6 - 12 months in one of the previous ideas: Again/
Overall , the chart structure, macro catalysts, and expanding adoption point toward a potential parabolic leg into late 2025 or early 2026. As long as the market holds above $3.3T, the breakout is valid and bulls are in control. The target is $5.5T —and possibly higher.
TradeCityPro | Bitcoin Daily Analysis #125👋 Welcome to TradeCity Pro!
In this Bitcoin analysis, I want to switch to a higher timeframe and analyze the daily chart because a very significant resistance has been broken and it’s important to take a closer look.
📅 Daily Timeframe
On the daily chart, as you can see, a bullish trend started around the 80000 level and in the first leg moved up to 110183. After a prolonged correction, the price has now managed to break that previous high and begin a new bullish leg.
⚡️ As shown, volume was sharply decreasing during the correction phase, but in the past few candles, significant buying volume has entered the market, enabling the price to break above 110183.
💥 The RSI oscillator is entering the Overbuy zone in today’s candle, which could be a sign of continuation of this bullish move. The next RSI resistance is around 78.47.
🎲 Meanwhile, based on Fibonacci levels, 120140 and 134922 are key zones that could mark the end of this bullish leg. The price is currently very close to 120140, and we need to watch for the market's reaction to this level.
✅ If 120140 is broken, Bitcoin will likely head toward 134922. In that case, I believe this leg could be the final bullish leg of this bull run, since I’ve previously mentioned that my target range for Bitcoin in this cycle is between 130000 and 180000.
📊 The curved trendline I’ve drawn is very important in this leg. As long as the price remains above this trendline, the market momentum will stay bullish, and the likelihood of continued upward movement increases.
🔽 If this trendline is broken, we could see the first signal of a trend reversal. A close below 110183 would confirm that the breakout was fake, and a break below 100763 would open the door for a longer-term short position.
❌ Disclaimer ❌
Trading futures is highly risky and dangerous. If you're not an expert, these triggers may not be suitable for you. You should first learn risk and capital management. You can also use the educational content from this channel.
Finally, these triggers reflect my personal opinions on price action, and the market may move completely against this analysis. So, do your own research before opening any position.
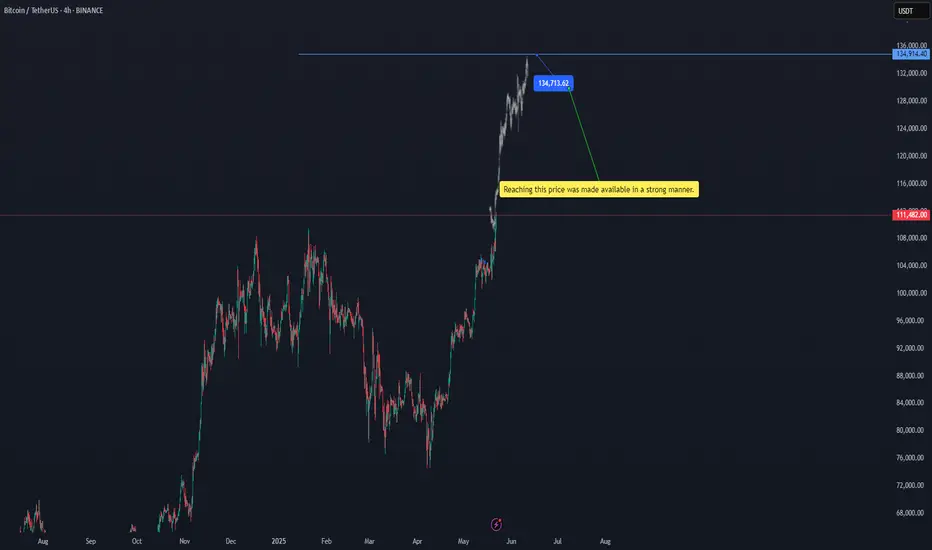
btcusdtReaching this price was made available in a strong manner. 134713.16$ BINANCE:BTCUSDT
Of course, there is a possibility of a temporary correction at the current price, but the target is $134,713.
#btc
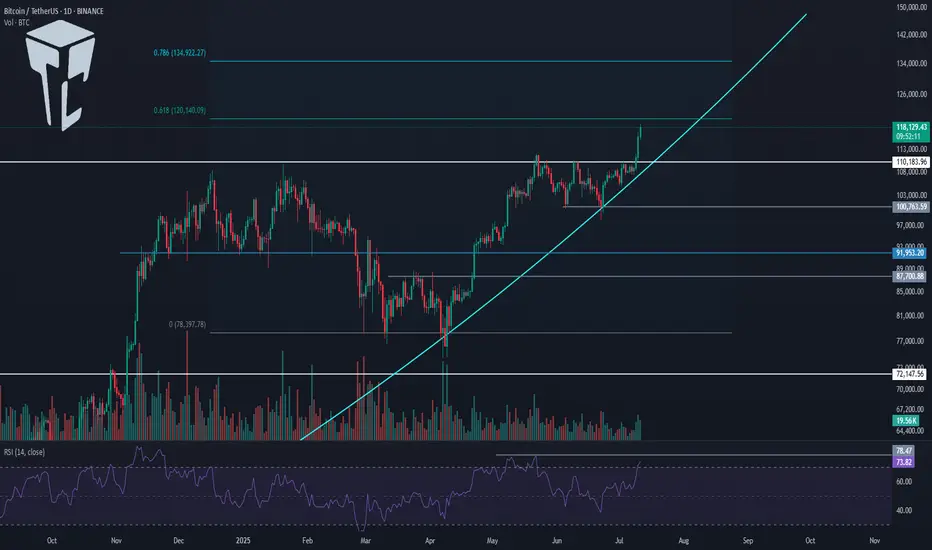
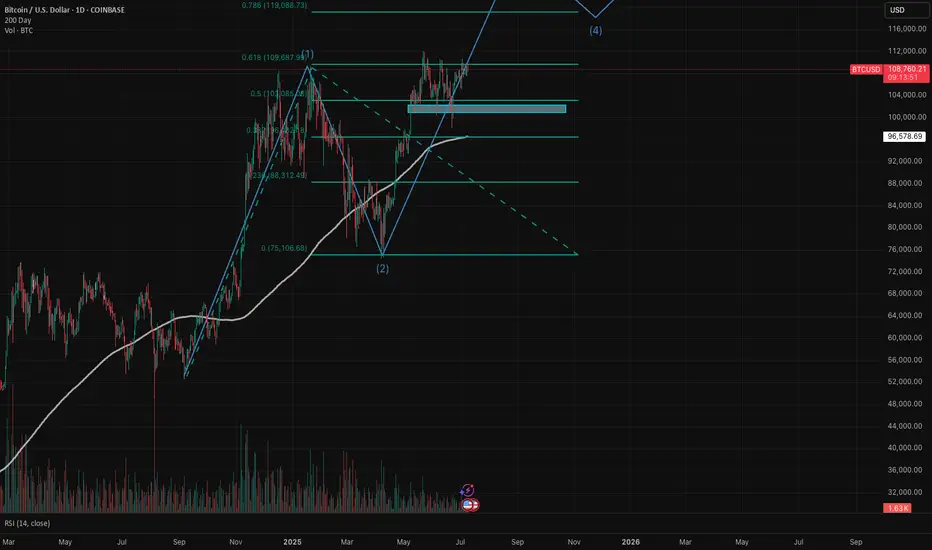
Bitcoin (BTC/USD) is currently in wave 3 of a 5 (Elliott Wave)BTC/USD experienced a halving last year on April 20, 2024. We have been seeing the typical post-halving cycle with exponential upside, followed by deep pullbacks. The price action we've seen to date follow Elliott Wave Cycle quite nicely. I believe we are in wave 3 of a bull cycle that has really been in place since Sep 2024.
- Wave 1: Sep 2024 - Jan 2025 - parabolic upside from $54K to $109K - absolutely explosive!
- Wave 2: Jan 2025 - Apr 2025 - we saw price peak and pull back all the way to the 61.8% Fibonacci level right around $75K. Remember, that in wave 2, a healthy pullback is 50% - 61.8% of the first wave.
- Wave 3: Apr 2025 - we have since rallied to around $109K as of this analysis. We are likely in subwave 3. Subwave 1 was from the low in April to the high in May (around $112K). Subwave 2 was a very nice 3-wave zig zag (reaching low of $98.3K in June). I believe we are currently in the middle of wave 3.
My next price target based on Fibonacci extension is $118K-$120K with the $78.6% level right at $119K. Note current resistance that we need to turn into support ($109.7K level) is the 61.8% Fibonacci extension level. I do expect a meaningful pullback after the peak of wave 3, which would be wave 4. The rest is TBD and I will continue to update this idea.
Remember, Elliott Wave theory is one tool in the toolbox. I do believe there is a larger post-halving cycle narrative that is dominant and most reliable, especially since BTC has largely followed this blueprint that we see every four years, but as of now EWT fits in quite nicely. I also look at the pi cycle top indicator and believe we need to use multiple indicators to understand where we are in the cycle.
BTC/USDT : Breaks Out – New Highs In Sight After Smashing $111K!By analyzing the Bitcoin (BTC) chart on the weekly timeframe, we can see that the price has finally started to rally as expected—successfully hitting the $111,700 target and even printing a new high at $111,999 with an impressive pump.
This analysis remains valid, and we should expect new all-time highs soon.
The next bullish targets are $124,000 and $131,800.
THE WEEKLY TF ANALYSIS :

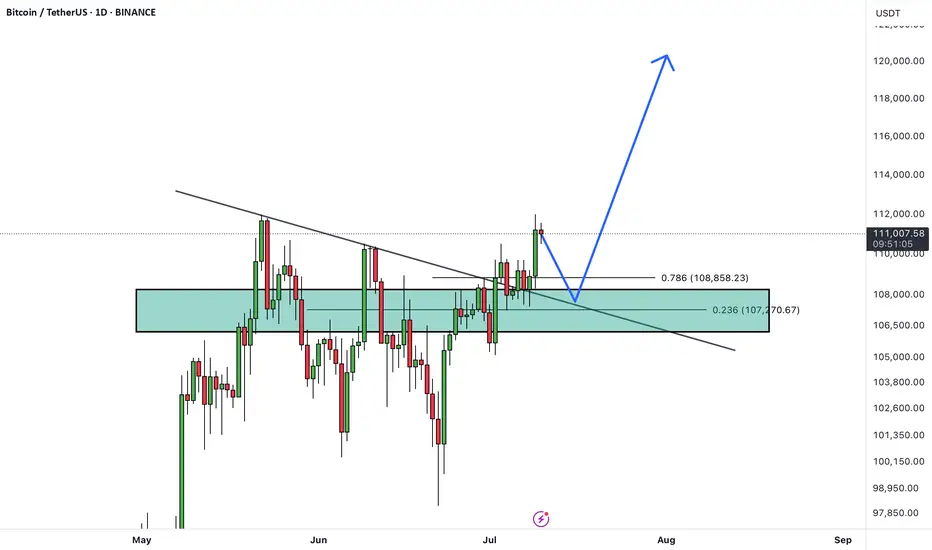
BYCUSDTHello Traders! 👋
What are your thoughts on Bitcoin?
Bitcoin has broken above its descending trendline and formed a new higher high. The price is now in a consolidation phase, taking a short pause after the breakout.
We expect the bullish trend to remain intact. After a pullback to the broken trendline and some consolidation in the support zone, Bitcoin is likely to resume its upward move toward higher levels and new all-time highs.
The overall market structure remains bullish, and this consolidation phase could present a buy-the-dip opportunity.
Is Bitcoin ready for the next leg higher, or will the pullback go deeper? Share your view below! 🤔👇
Don’t forget to like and share your thoughts in the comments! ❤️
Skeptic | Why did Bitcoin grow? What’s the next move?Unemployment rate’s up...
lemme explain short and sweet. When unemployment —a key factor for setting interest rates —rises, the Federal Reserve’s got no choice but to lower rates so companies can hire. Lower rates = more liquidity = Bitcoin and stocks go up.
What’s the next move?
Around $ 120,000 , there’s about 1 billion in short liquidity positions. also it overlaps with the weekly pivot point level 4 . I see a high chance of correction or ranging here. Personally, I opened a position before the $ 110,513 breakout ( i shared in this analysis ) and only took profits. If you’re still holding, I suggest not closing yet—once the $ 110,000 resistance broke, Bitcoin’s major weekly trend woke up, so we could see more growth.
If this analysis helped you, hit that boost—it fuels my mission! 😊 Stay disciplined, fam! ✌️
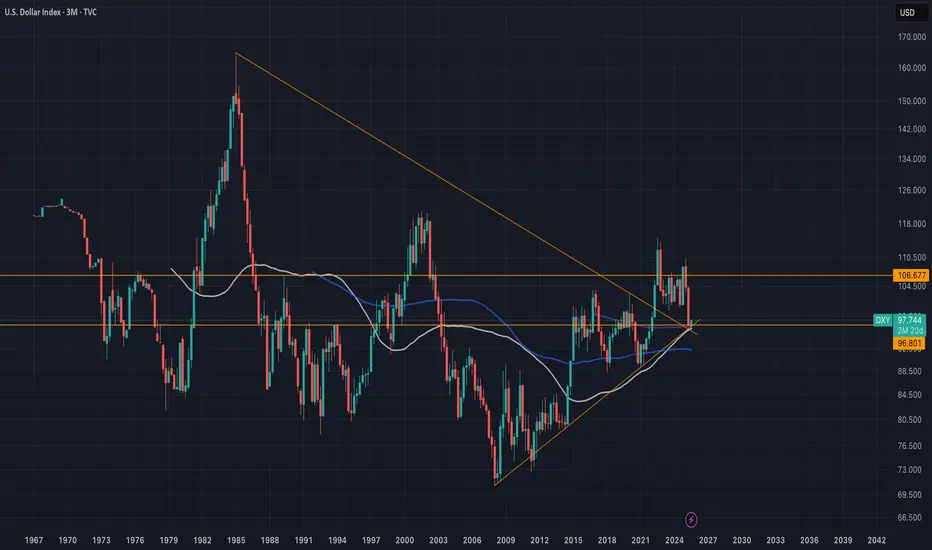
DXY (USD Basket) - 3 Month - Short Squeeze In Play?Technicals:
The last 3-month candle closed above the major resistance that tends to hold according to historic levels going back to the year 1967.
Golden Cross is almost complete (50 MA crossing the 200 MA).
Fundamentals:
The dollar has only been more shorted once in history (2018), setting things up for a potential "Short Squeeze" and triggering a "Risk Off" scenario. Tends to hurt risk assets quite hard—for example, tech stocks, crypto, and other leverage plays.
A rise in the DXY could potentially trigger a "Short Squeeze" for foreign countries, companies, and investors that borrow in USD, creating "economic panic" in other countries that get their currency devalued relative to their obligations.
Countries that need USD to service their debt. With the current tariffs, the flow of dollars in the world will change. The question is: what will the effect look like in August when these tariffs start to go live? Like I mentioned before, other countries need the dollars in order to service their debt. If it gets more expensive for US consumers to import (caused by the tariffs), the exporting countries won’t get those dollars—setting it up for a buying cycle that could potentially drive the USD (DXY) higher, even to all-time highs.
Current narrative:
The narrative right now is that the USD will get "worthless," setting the stage to take more risk and use more leverage, maybe without even hedging. A surprise variable to this narrative could be devastating to the financial markets—not just in the US, but even to the world. IF/When this happens, everyone will hunt the USD once again, creating a new bullish narrative for the USD, and everyone will be forced to return to the reserve currency.
Nothing in this post should be considered financial advice. Always do your own research and analysis before investing.
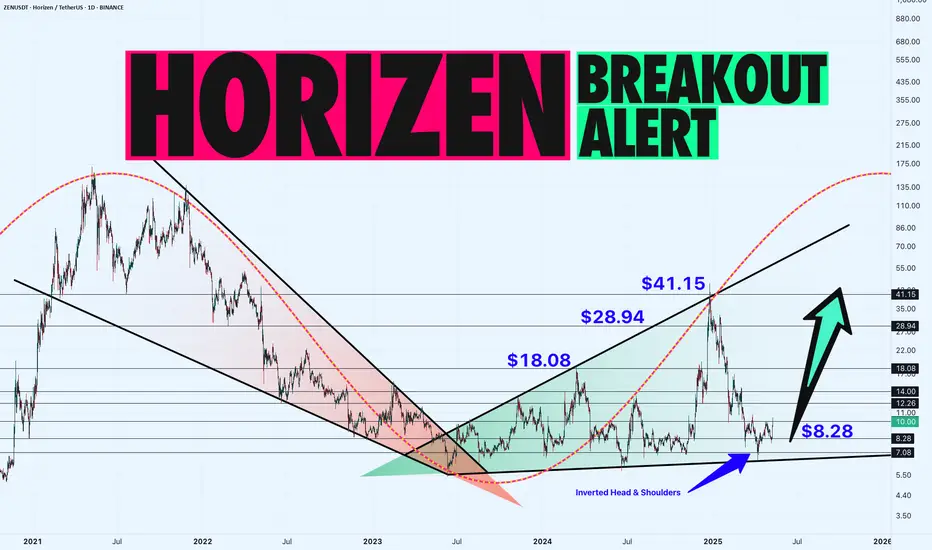
ZEN/USDT Daily Chart: Accumulation Before the Big Move? Hey traders! Let’s dive into this daily ZENUSDT chart. Horizon is in a sideways accumulation phase, forming an Expanding Wedge right after a massive bullish Falling Wedge breakout.
We’re also seeing a small inverted head and shoulders at the bottom support range of $7.08-$10.08 , with the neckline at $10.08 . ZEN recently revisited this level, and a confirmed breakout could propel it toward $18.08-$28.94 , with a major target at $41.15 .
If the breakout fails, we might see a pullback to the neckline at $10.08 or the shoulder support at $8.28 .
Key Levels to Watch:
Resistance: $18.08, $28.94, $41.15
Support: $8.28
Breakout Target: $41.15
Breakdown Risk: $8.28
Is ZEN about to skyrocket, or will this breakout fail? Let’s hear your thoughts below!
The Final Parabola: What History Says About Bitcoin’s July MovesIf you’ve been following here for a while, you know we’ve been nearly pinpoint in calling all the moves for Bitcoin. The altcoin market, not so much, but check out previous TAs to catch up on my perspective.
The two wave counts you see on the main chart have been in place for many months, I believe since around October 2024. As you can see, things have been playing out perfectly so far. The four year cycle continues to follow its path.
If the same thing happens this cycle like the last two, we should see a top sometime between October and December 2025, anywhere from 185K to 225K, followed by a cycle low somewhere around 48K in October 2026.
Bitcoin’s Julys
Every July during the 4th cycle year, Bitcoin begins its final parabolic run. This has happened without fail since the beginning of the Bitcoin Index chart. July consistently marks a major bottom, and then it's off to the races. The “only up” period that follows typically lasts 4 to 6 months and happens just once every four years like clockwork.
Here we are once again, the 4th year of the cycle, in July. Bitcoin has just hit all time highs and we've had a Hash Ribbon buy signal.
The perfect storm is brewing. Like always, the stars align in the second half of the 4th year of the Bitcoin cycle.
Time Cycles and Fibs
Looking at this time wave chart, we can see that every two waves like clockwork have marked a top. The next major wave appears to land in December 2025.
If we zoom into this smaller time wave, it has pinpointed the bottom of every small wave so far. The fact that we are once again at a bottom in July during the 4th year of the Bitcoin cycle is just another sign of the magical stars aligning.
This smaller Fibonacci sequence I’ve been tracking has already hit twice and predicted two major moves. The next dates to watch are August 2025 and January 2026.
There’s plenty of talk about an extended cycle. But during the last bull run, many traders and analysts said the same thing. In the end, Bitcoin topped out at exactly the same timeframe as the previous cycles.
If we reach the top of this model in Q4 2025, and we see a Pi Cycle Top signal along with a Mayer Multiple over 2.0, that will be our trigger.
If you've been sidelined this entire time, it's now or never. You don’t want to be the one buying in at 185K in Q4 2025 when everyone is calling for a million dollars. The time to act is now.