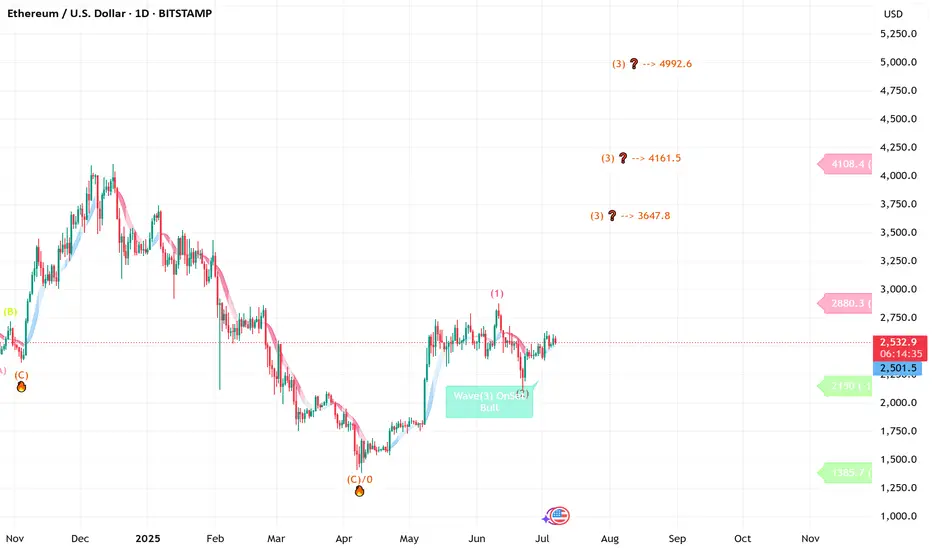
ETH ( Ethereum ) lovers looking strong for long term ETH -----Daily counts indicate Excellent bullish wave structure.
Both appear to be optimistic and this stock invalidation number (S L) wave 2 low
target short / long term are already shared as per charts
correction wave leg seems completed
Investing in declines is a smart move for short/ long-term players.
Buy in DIPS recommended
Long-term investors prepare for strong returns over the next two to five years.
one of best counter
Every graphic used to comprehend & LEARN & understand the theory of Elliot waves, Harmonic waves, Gann Theory, and Time theory
Every chart is for educational purposes.
We have no accountability for your profit or loss.
Cryptomarket
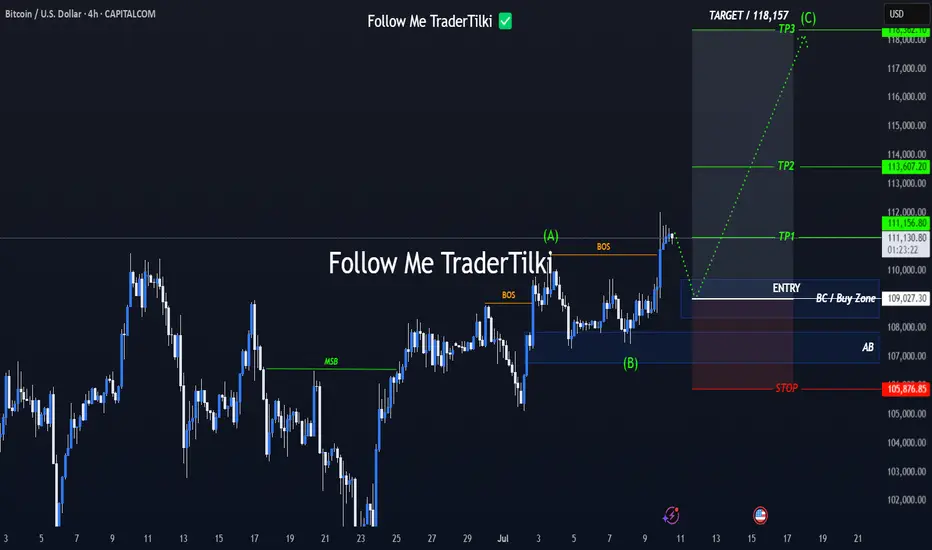
109K Launch Zone? Bitcoin Update Now LiveHey everyone,
Here's my latest Bitcoin analysis for you. The current price action is unfolding within an ABC corrective wave.
🔍 I've identified the optimal buy zone between 108,349 and 109,682.
📉 Once the price pulls back into this range, my limit orders will be triggered and the position will open.
🎯 In this scenario, my target level is 118,157.
Below are the exact levels for my entry, targets, and stop-loss:
- 🟩 Entry Level: 109,027
- 🟥 Stop-Loss: 105,876
- 🎯 TP1: 111,156
- 🎯 TP2: 113,607
- 🎯 TP3: 118,362
- ⚖️ Risk/Reward Ratio: 3.00
(This is based on a swing trade model, so reaching this level may take some time)
--------
Your likes and support are what keep me motivated to share these analyses consistently.
Huge thanks to everyone who shows love and appreciation! 🙏
BTCUSDTHello Traders! 👋
What are your thoughts on BITCOIN?
Bitcoin has once again failed to break above its previous high and entered a corrective phase. The price is now moving within a channel and is approaching the lower boundary of that channel.
The correction is expected to continue toward the support zone and the bottom of the channel, where we may see buying interest and a bullish reaction.
If Bitcoin breaks above the channel resistance and key supply zone, it could trigger a strong upward move and lead to new all-time highs.
Key Note:
Price action near the channel support and demand zone will be crucial. A successful rebound from this area may signal the start of the next bullish leg.
Will Bitcoin hold the channel and bounce higher, or is a deeper correction ahead? Share your thoughts below! 🤔👇
Don’t forget to like and share your thoughts in the comments! ❤️

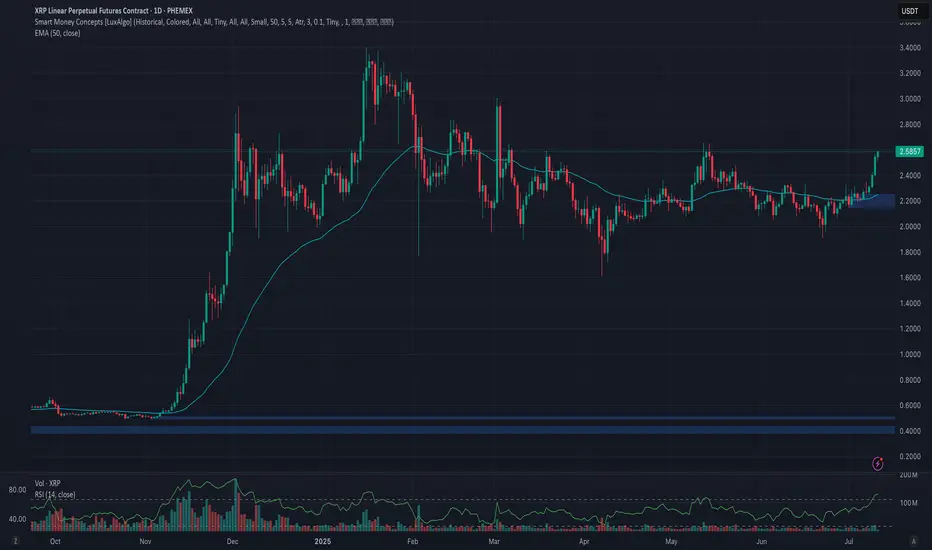
Phemex Analysis #96: Pro Tips for Trading Ripple (XRP)Since our previous analysis on XRP , Ripple’s native token [ PHEMEX:XRPUSDT.P ] successfully broke above the significant $2.45 resistance level, subsequently establishing a higher low around $1.90 on June 22nd. Encouragingly, XRP has surged 10% over the past two days, once again decisively breaking the $2.45 barrier, and is currently trading at around $2.57.
Given XRP’s recent bullish performance and evolving market dynamics, let's explore several potential scenarios that traders should closely monitor.
Possible Scenarios
1. Continued Bullish Momentum (Breakout Scenario)
If XRP maintains its current bullish strength, it’s likely to break above its recent high at $2.65. Such a breakout would signal strong buying interest and may push the price further toward the resistance zones at $2.96 and $3.12.
Pro Tips:
Entry Strategy: Consider entering or scaling positions upon confirmation of a breakout above $2.65, supported by increased trading volume.
Profit-Taking: Strategically take partial profits as XRP approaches the next resistance levels at $2.96 and especially $3.12 to secure gains effectively.
2. Rejected by Strong Resistance Levels (Pullback Scenario)
While the recent rally is promising, broader market conditions currently exhibit limited bullish momentum, indicating caution. XRP may face strong selling pressure at resistance levels like $3.12, leading to a potential price rejection.
In this scenario, XRP could retreat to establish a higher low above the important support at $2.15.
Pro Tips:
Buying Opportunities: Long-term investors might consider gradually accumulating positions if XRP forms a confirmed higher low above the critical support zone around $2.15.
Patience: Wait for clear stabilization signs at support before increasing positions, rather than rushing entries during active retracements.
3. Consolidation within Defined Range (Neutral Scenario)
XRP might enter a period of price consolidation, oscillating between support at $1.91 and resistance at $2.65. This scenario is common when market sentiment is uncertain or awaiting clearer directional cues.
Pro Tips:
Grid Trading Strategy: Utilize grid trading bots to profit systematically from predictable range-bound price movements. Initiate Long Grid bots near support at $1.91 and Short Grid bots near resistance around $2.65.
Stop-Loss: Always set clear stop-losses outside the consolidation range, ensuring protection against unexpected breakouts or breakdowns.
Conclusion
Ripple (XRP) currently offers compelling trade opportunities across different market scenarios. By closely monitoring bullish breakout signals above $2.65, potential pullbacks toward $2.15, and consolidation opportunities within $1.91–$2.65, traders can strategically position themselves to capitalize effectively while managing risks prudently. Always maintain a disciplined approach, pay close attention to broader market trends, and carefully execute trades based on well-defined scenarios.
🔥 Tips:
Armed Your Trading Arsenal with advanced tools like multiple watchlists, basket orders, and real-time strategy adjustments at Phemex. Our USDT-based scaled orders give you precise control over your risk, while iceberg orders provide stealthy execution.
Disclaimer: This is NOT financial or investment advice. Please conduct your own research (DYOR). Phemex is not responsible, directly or indirectly, for any damage or loss incurred or claimed to be caused by or in association with the use of or reliance on any content, goods, or services mentioned in this article.
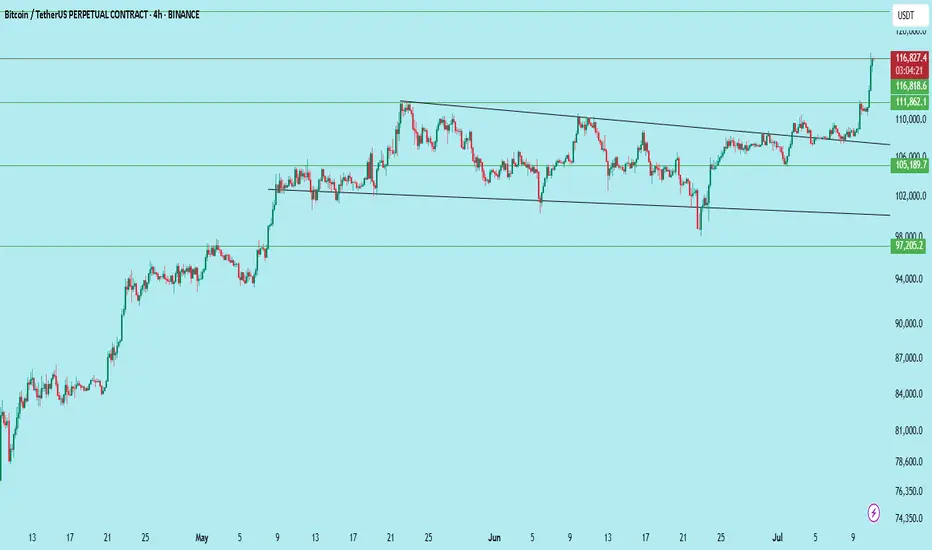
Bitcoin Breaks Out — Major Momentum ShiftBTC/USDT has officially broken out of the descending channel it was consolidating in for over a month. The breakout was strong, clearing the horizontal resistance at $111,862, flipping it into support.
Chart Structure:
Descending channel broken to the upside
Horizontal resistance is flipped to support
Volume confirmed breakout momentum
Key Levels:
Support: $111,862 → Newly flipped support
Resistance Zones Ahead:
$116,818
$122,342
Upside Targets:
Immediate: $116,818
Extended: $122,342
Caution: Avoid FOMO. Wait for a retest near $111,800–$112,200 to confirm breakout strength.
Bias: Bullish
Timeframe: 4H
Wait for confirmation before fresh entries.
DYOR | Not financial advice
#BTC #Bitcoin
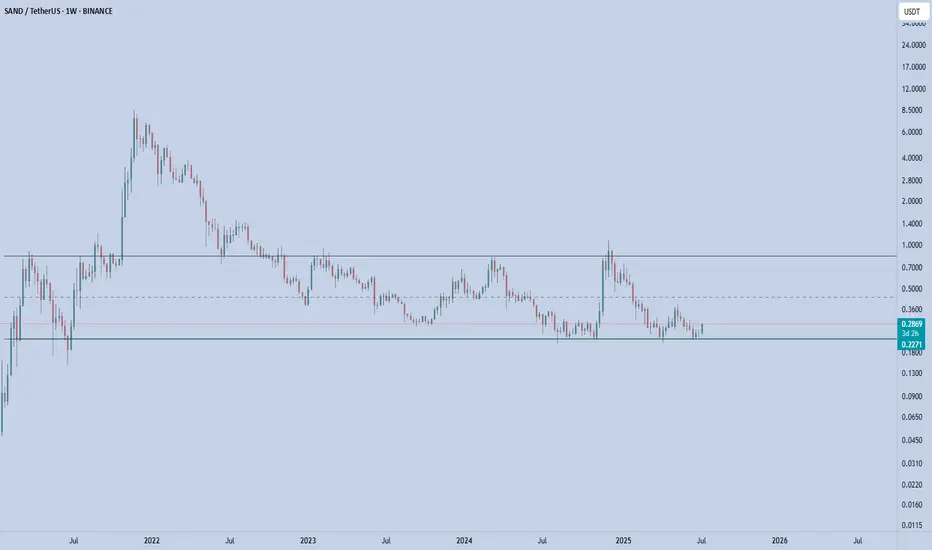
SAND – Rotation in PlaySAND is showing early signs of strength off the long-term demand zone near $0.23–0.24, where it's been accumulating for several months. Price just printed a strong weekly bounce, up +16%, reclaiming the bottom of the range.
This area has acted as a key base since mid-2023 — with each touch producing a notable reaction. Now trading at $0.286, SAND is attempting to rotate toward the top of the established range.
Key Levels
Support (Range Low): $0.23–0.24 (strong demand zone)
Resistance (Mid-Range): $0.43
Range High: $0.85
A clean flip of the mid-range ($0.43) could open the door to test $0.70+.
📌 Risk management: A break and weekly close below $0.23 invalidates this setup. As long as it holds, the upside potential is attractive from a risk/reward standpoint.
This is a classic accumulation > reclaim > expansion structure. Let the chart speak if the range holds, the rotation is in play.
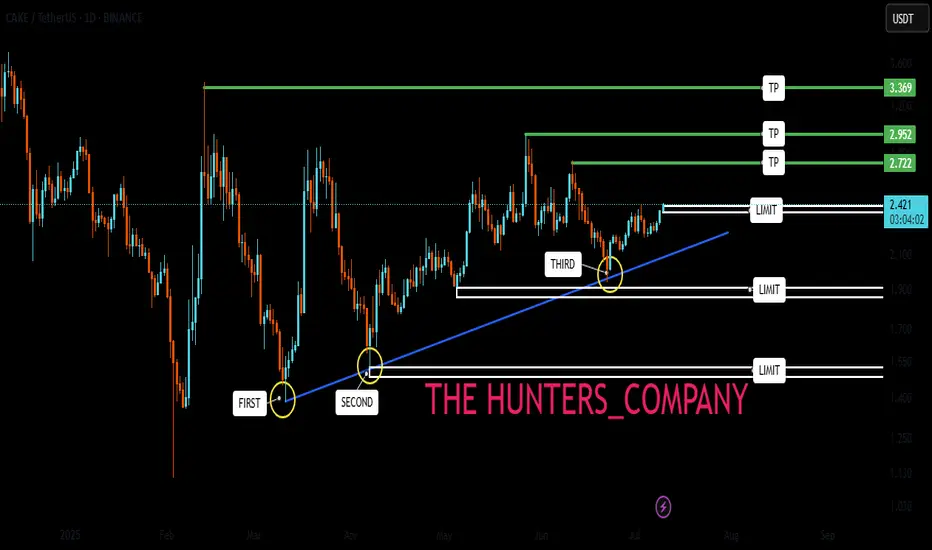
CAKE : Are we left behind?Hello friends🙌
😉We came with a good currency analysis from the decentralized exchange Pancake Swap.
So you see that we have a good price support that buyers supported the price well after each collision.
🔊Now, considering the collision with this support, we can expect growth to the specified areas. Of course, don't forget that capital management and risk are the priority of trading.
🔥Follow us for more signals🔥
*Trade safely with us*
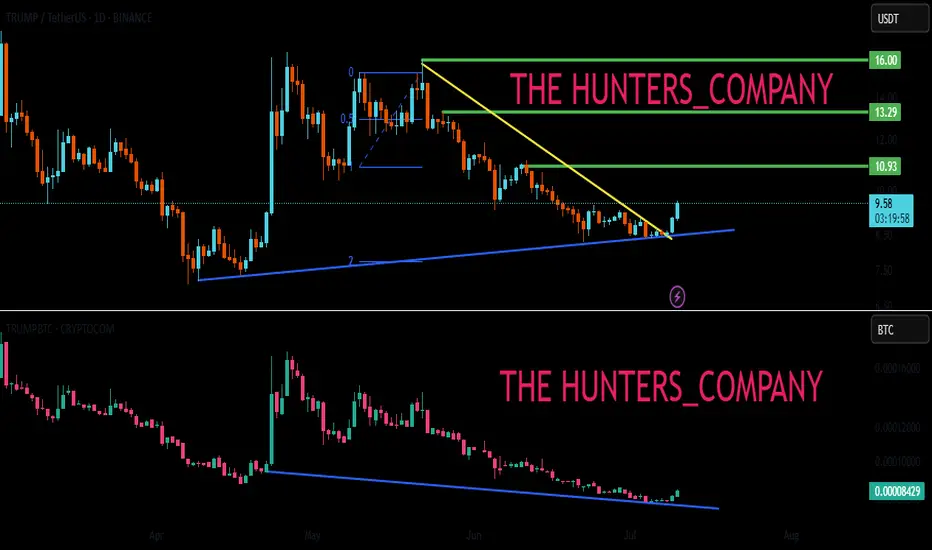
TRUMP BUY ???Hello friends🙌
🔊As you can see in the picture, we have brought you two Trump charts:
1_TRUMP/USDT, in which we see an upward trend.
2_TRUMP/BTC, in which we see a downward trend.
✔Now what is the conclusion? When this negative divergence occurs, it means that money flows from Bit to Tether, and we can expect good growth from it to the specified targets, given the price reaching important support and its return📈
🔥Join us for more signals🔥
Trade safely with us.
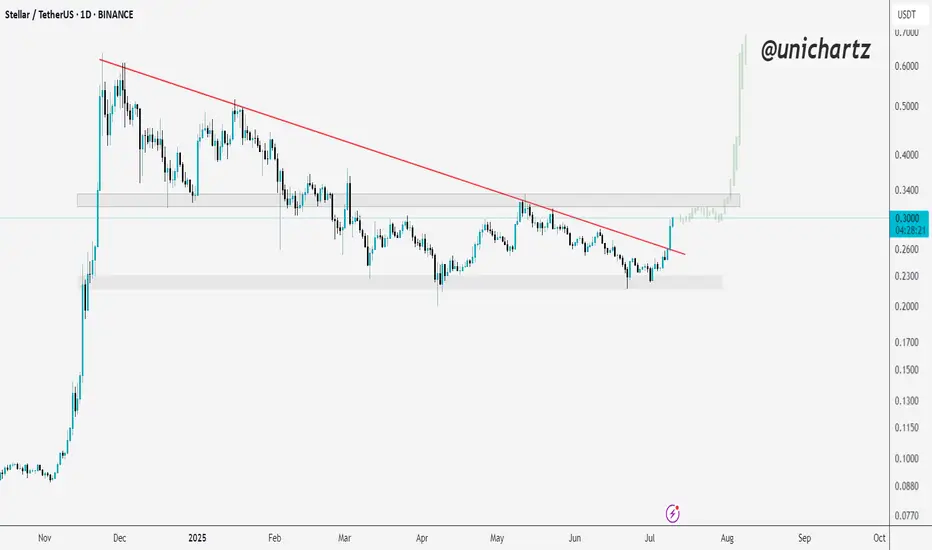
From Resistance to Support: XLM Sets the StageXLM had been consolidating under a descending trendline since early 2025. But today, we saw a strong breakout backed by solid momentum.
What’s even better?
It flipped a key resistance zone into support — classic breakout, retest setup.
If bulls hold this level, the next leg up could be explosive.
DYOR, NFA
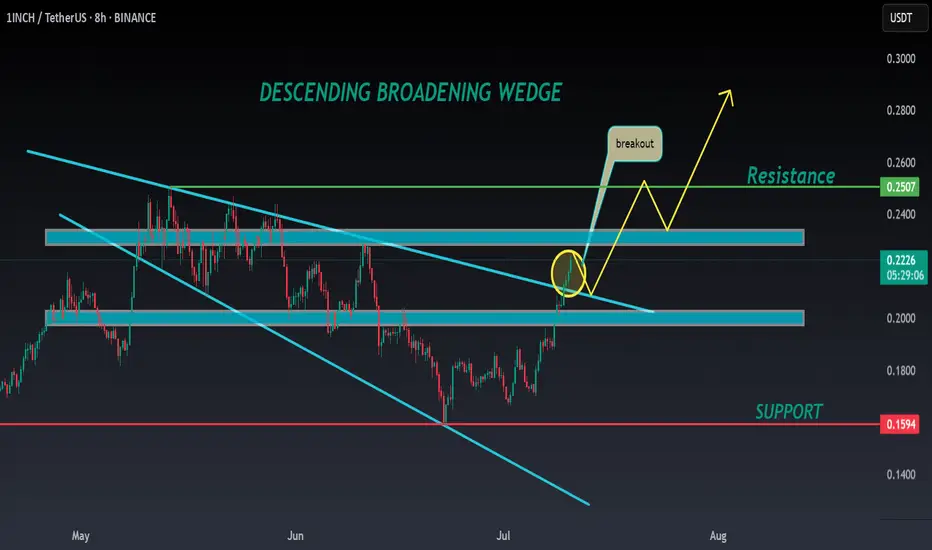
1INCH ANALYSIS🔮 #1INCH Analysis 🚀🚀
💲💲 #1INCH was trading in a Descending Broadening Wedge Pattern, give a perfect breakout and will retests the levels. If the price of #1INCH sustains the breakout then we will see a bullish move. 📈📈
💸Current Price -- $0.2220
📈Target Price -- $0.2510
⁉️ What to do?
- We have marked crucial levels in the chart . We can trade according to the chart and make some profits. 🚀💸
🏷Remember, the crypto market is dynamic in nature and changes rapidly, so always use stop loss and take proper knowledge before investments.
#1INCH #Cryptocurrency #Breakout #DYOR
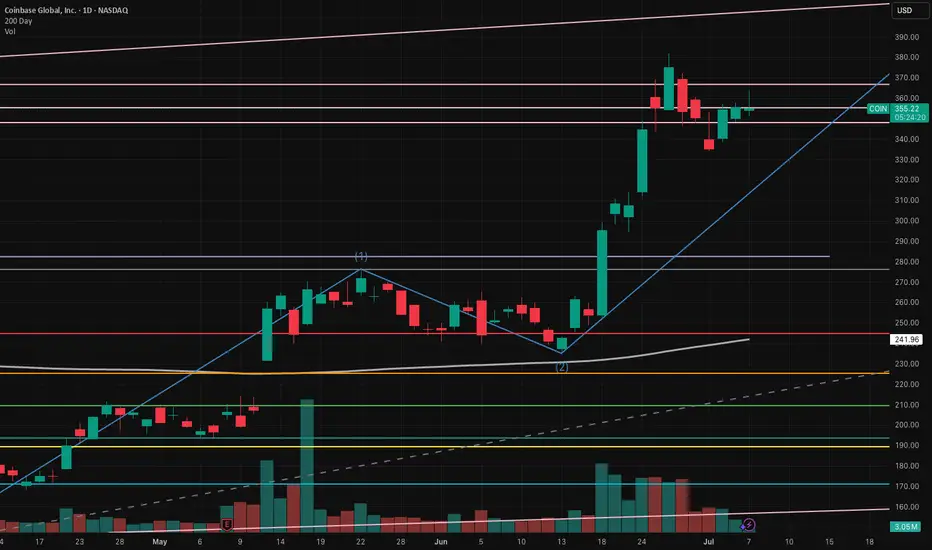
COIN long -- currently in Wave 3 of 5 wave advance I've been using Elliott Wave Theory to look at COIN's price action. We seem to be in the middle of Wave 3.
- Wave 1: April 7, 2025 to May 22, 2025
- Wave 2: May 23, 2025 to June 13, 2025 - we pulled back right below the 23.6% Fibonacci retracement level with ~$244 serving as support.
- Wave 3: June 14, 2025 - now. The third wave usually has 5 distinct sub-waves. As of July 7, 2025 We appear to be in the 3rd sub-wave of wave 3. Using the upper channel line, price target for this wave is around $408-$410. Quite possible if we see BTC move up explosively, which also seems imminent given the highest weekly close on July 6, 2025.
COIN is a very volatile stock that has explosive moves to the up and downside. I think we still have more room to run in this current wave 3--even beyond sub-wave 1 peak at $380.
Bitcoin Breaks All-Time High: What’s Next?Bitcoin (BTC) has once again captured the world’s attention by smashing through its previous all-time high (ATH). This milestone has sparked excitement and speculation across the crypto community and beyond. But the key question remains: Will BTC continue its upward trajectory, or is a correction on the horizon?
Long-Term Outlook: The Bullish Case
In the long run, the fundamentals for Bitcoin remain strong. Several factors support a positive outlook:
Institutional Adoption: More institutional investors are entering the market, providing greater liquidity and legitimacy.
Scarcity and Halving Cycles: Bitcoin’s fixed supply and periodic halving events historically drive long-term price appreciation.
Macro Trends: Ongoing concerns about inflation and fiat currency devaluation continue to make BTC an attractive hedge.
Given these dynamics, we believe Bitcoin’s long-term trajectory remains upward.
Short-Term Caution: A Correction May Be Coming
While the long-term view is optimistic, the short-term picture may be less rosy:
Overheated Market Indicators: Rapid price surges often lead to overbought conditions, increasing the likelihood of a pullback.
Profit-Taking: After breaking ATH, some investors may lock in gains, adding selling pressure.
Technical Resistance: Historical patterns suggest that corrections often follow major breakouts.
We anticipate a potential correction, possibly pulling BTC back to the $90,000 range. This adjustment could unfold in the coming week or weeks as the market digests recent gains.
What Should Investors Do?
Stay Calm: Volatility is part of the crypto landscape. Corrections are healthy for sustainable growth.
Focus on Fundamentals: Remember why you invested in BTC in the first place.
Consider Dollar-Cost Averaging: Spreading out purchases can help mitigate the impact of short-term swings.
Conclusion
Bitcoin’s break above its all-time high is a testament to its enduring appeal and the growing confidence of investors. While a short-term correction may be likely, the long-term case for BTC remains compelling. As always, prudent risk management and a focus on fundamentals are key to navigating the exciting—and sometimes turbulent—world of crypto.
Do not consider it as investment advice.
#crypto #bitcoin #analysis
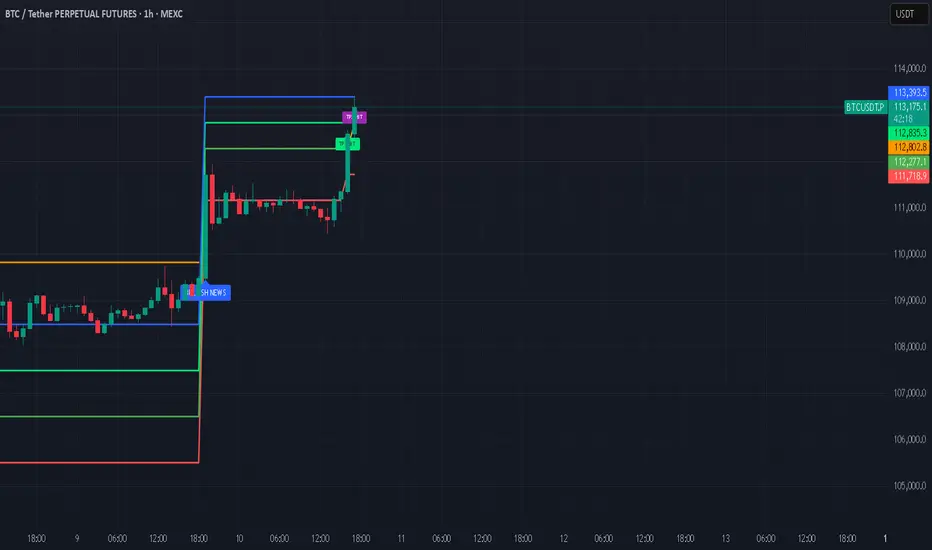
ARE YOU READY FOR 150K+ BTC RALLY !!!BTC has successfully broken out it's bull flag resistance and currently testing above it.
Major resistance resides above is 112K level , if we successfully break and hold above it then easy targets would be 130-150k levels.
Elliott Wave Count final targets 180k level.
If we goes below 106k level then we may see BTC getting into support region of 102-100K region.
For all of this, BTC should remain above 98K level.

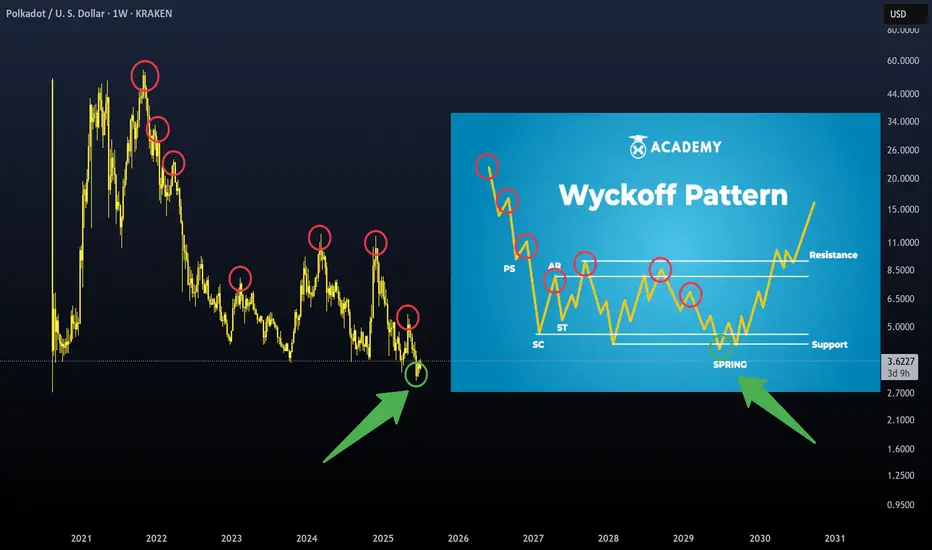
Wyckoff Pattern- To understand trading at its core, you need to understand the Wyckoff Theory.
- Everything you need is in the chart and yes, it's simple and might look like copy-paste, but it's pure Wyckoff.
- Remember this post i made in 2021 ? check it again :
Remember, trading is like a washing machine, it shakes you up, spins you around, and pressures you to sell when you should be buying or Holding.
Not a price prediction, just a smarter way to level up your strategy.
Happy Tr4Ding !
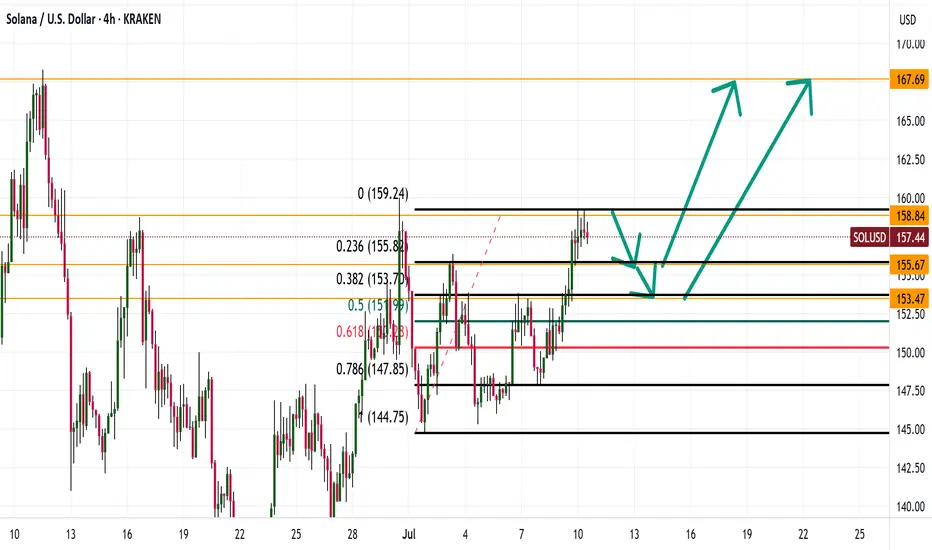
SOL TO 167?Good morning folks
so it looks like we are correcting down possibly down to 153 then seeing a drive up to 167. What are your thoughts on the market for Solana
Looks like things are heating up for Solana
Kris/Mindbloome Exchange
Trade Smarter Live Better
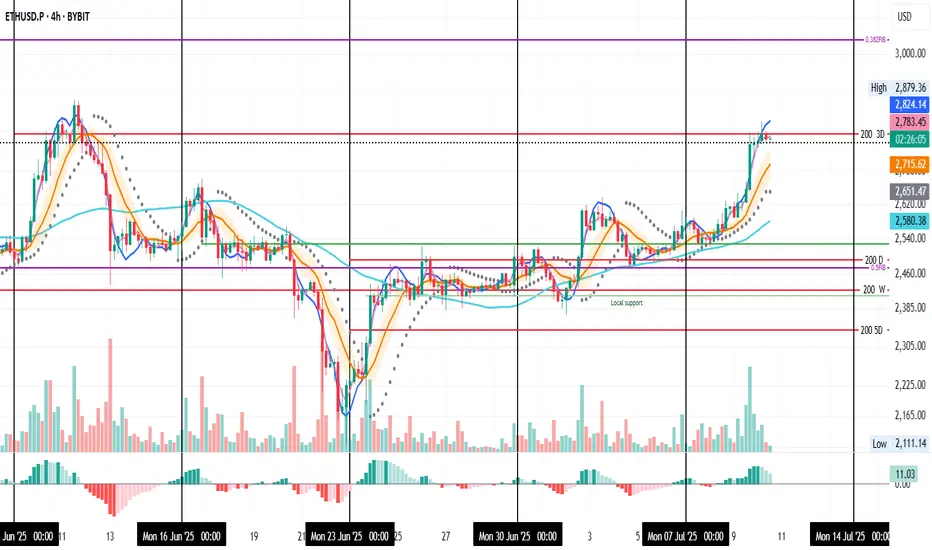
ETH Not Taking Profits Yet – System Still Long
ETH on the 4H is pausing right at the 3D 200MA, picture perfect, actually.
Now we wait to see if this resistance flips into support.
If that happens, price could go for the 0.382 Fib level around $3,040.
Of course, that’s the ideal scenario, but the market could easily contradict me, so keep that in mind.
Personally, it’s not time to take profits yet.
Both my 4H and 1D systems are still in long positions.
For extra safety, you could set a partial take-profit just under the second-to-last PSAR dot.
Always take profits and manage risk.
Interaction is welcome.
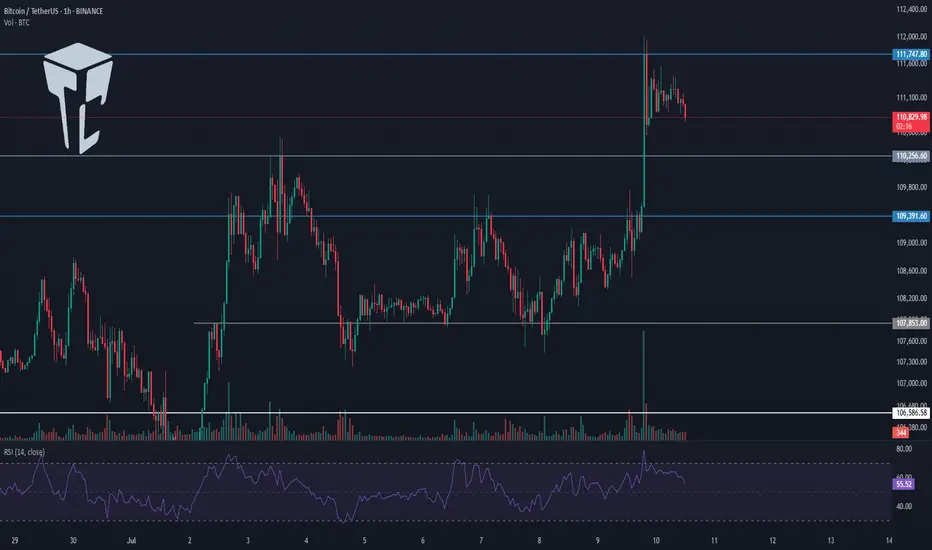
TradeCityPro | Bitcoin Daily Analysis #124👋 Welcome to TradeCity Pro!
Let’s dive into the analysis of Bitcoin and key crypto indicators. As usual, I’ll review the futures triggers for the New York session.
⏳ 1-Hour Timeframe
On the 1-hour timeframe, as you can see, Bitcoin made a bullish move yesterday after stabilizing above the 109391 level and managed to register a new ATH around the 112000 level.
⭐ The resistance at 111747 has effectively held back further price increases, and the price has reacted to it and entered a corrective phase.
✔️ I believe the correction could continue down to 110256. The next lower support levels are 109391 and 107853.
📈 If you already have a long position open, I recommend holding it. If the 111747 resistance breaks, a strong bullish trend could begin, and having an open position from earlier could have a big positive impact on your account.
🔼 If 111747 is broken, we can consider opening new long positions. If this level breaks, I’ll post a higher timeframe analysis to identify the next major resistance levels.
💥 RSI entering the Overbuy zone and rising volume would provide strong confirmation for this position.
👑 BTC.D Analysis
Bitcoin Dominance is still dropping. Yesterday, after breaking 64.81, it continued its downward move and is now approaching the 64.49 level.
🔍 If this level breaks, the drop could continue further, but in my opinion, after the recent drop, it's time for BTC.D to enter a correction phase.
📅 Total2 Analysis
Total2 has also had a bullish move, breaking through the 1.18 and 1.2 levels, and continues to rise.
🎲 The next resistance is at 1.24, which the price may target. However, I think there’s a high chance of a correction or consolidation phase starting soon.
📅 USDT.D Analysis
Looking at Tether Dominance, after the recent drop and the break of 4.72, it reached the 4.63 level and has formed a base there.
✨ If 4.63 breaks, USDT.D could head toward 4.56. In case of a pullback, the first level to watch is 4.72.
❌ Disclaimer ❌
Trading futures is highly risky and dangerous. If you're not an expert, these triggers may not be suitable for you. You should first learn risk and capital management. You can also use the educational content from this channel.
Finally, these triggers reflect my personal opinions on price action, and the market may move completely against this analysis. So, do your own research before opening any position.
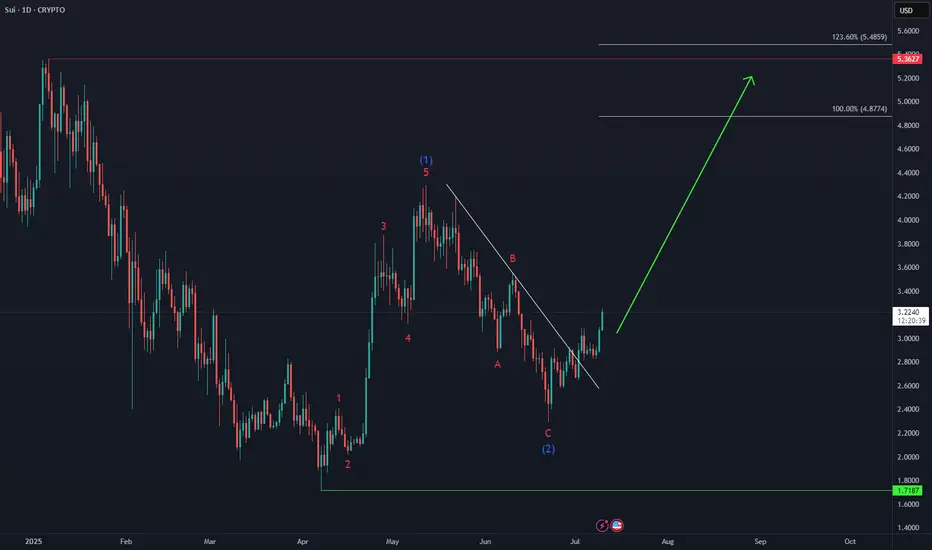
SUI Next Upside Target🚀 After holding above the April low and completing a 3-wave pullback in wave (2), CRYPTO:SUIUSD is now advancing in a potential wave (3).
Momentum is building, and the next upside target lies in the equal legs zone at $4.80 – $5.40, which could eventually lead to a new all-time high.
TradeCityPro | ADA Eyes Breakout from Bearish Channel Top👋 Welcome to TradeCity Pro!
In this analysis, I want to review the ADA coin for you. The Cardano project is one of the oldest and most popular projects in crypto.
🔍 The coin of this project has a market cap of 22.21 billion dollars and is ranked 10 on CoinMarketCap.
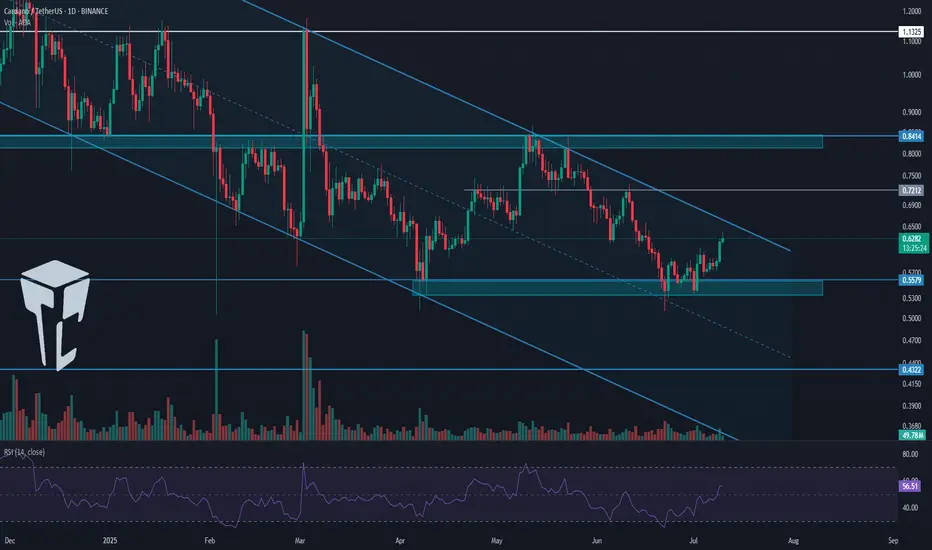
📅 Daily Timeframe
On the daily timeframe, ADA is moving downward within a descending channel and is currently trying to break out of the channel from the top after reaching a support zone.
⭐ One positive sign for buyers is that they didn’t let the price reach the bottom of the channel. Instead, they used the overlap between the midline of the channel and the key 0.5579 zone (marked as a support area) to stop the price from falling.
✨ However, as long as the coin is fluctuating inside this channel, the trend remains bearish. Holding the midline is not a sign of trend reversal yet, but it does indicate weakening of the current trend and may act as one of the bases for a future reversal.
✅ Looking at the RSI oscillator, we can see that each time the price tried to break the channel’s top, RSI reached the 70 area and got rejected, causing the price to drop.
⚡️ Currently, the price is very close to the top of the channel, but RSI has just broken above the 50 line and is moving upward. This is a bullish sign for buyers, as it shows there is still room for upward momentum, which increases the chance of a breakout.
🎲 The nearest trigger for confirming the breakout from the channel is the 0.7212 zone, which is a bit far, and the price will likely form a higher low and high before reaching it, confirming the breakout earlier.
💥 But based on the current data, the breakout trigger remains at 0.7212, and for spot buying, this is the first valid entry level.
👀 Personally, I’m not adding any altcoins to my portfolio right now, as Bitcoin Dominance is still in an uptrend. As long as this trend continues, large capital flows into altcoins are unlikely.
🛒 More reasonable triggers for spot entries would be a breakout above the 0.8414 supply zone. If I were to buy, I’d enter at this level. The final trigger is 1.1325, which is quite far from the current price, and if BTC Dominance continues upward, it could take several months to reach this zone.
🔽 If you already hold this coin in spot, your stop-loss can be set at a break below the 0.5579 level. A breakdown here would also provide a good short setup in futures, as the price could move toward the bottom of the box or the static level at 0.4322.
📝 Final Thoughts
This analysis reflects our opinions and is not financial advice.
Share your thoughts in the comments, and don’t forget to share this analysis with your friends! ❤️
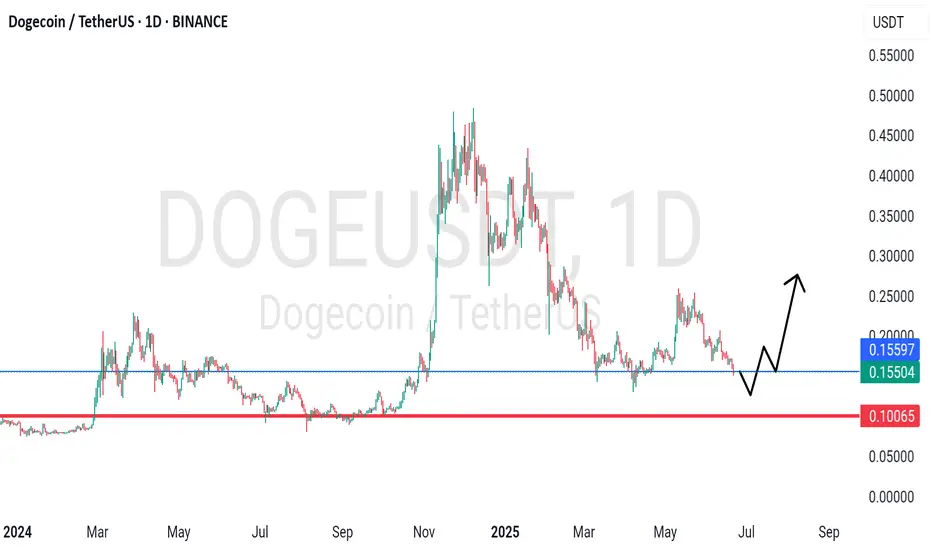
DOGEUSDT - near support? Holds or not??#DOGEUSDT... market just reached near his supporting area even ultimate area. That is around 0.10 and current market price is around 0.15
If market holds current supporting area then we can expect a bounce from here.
Below 0.10 we will never see again bounce ... Note that.
Good luck
Trade wisely
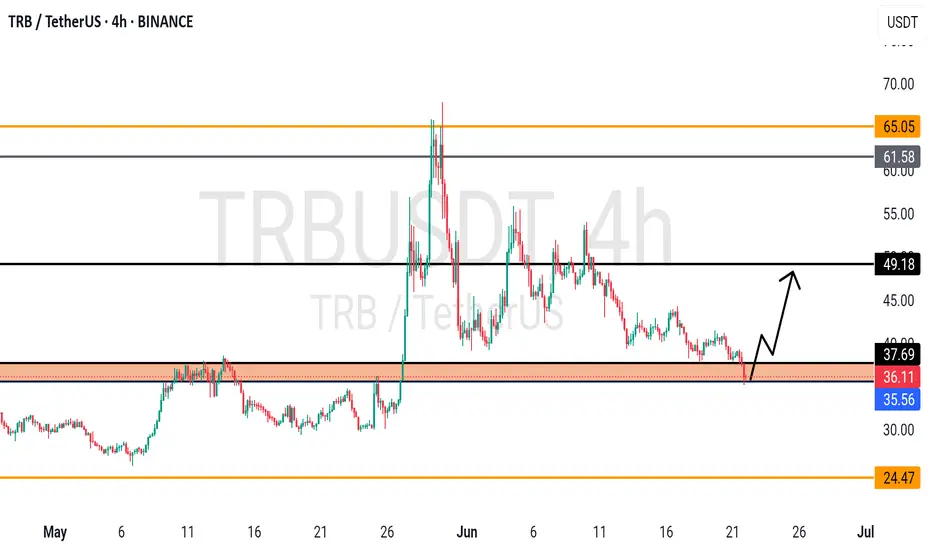
TRBUSDT - at CUT n REVERSE Area? What's next??#TRBUSDT - market just reached at his ultimate supporting region and below that we can expect a further straight drop.
So we will cut n reverse below our mentioned region that is around 35 (region neck line)
Good luck
trade wisely
$SOL | Triple Top or Launchpad?Macro to Micro Context:
SOL is now testing a third rejection in the upper 153s, forming a textbook triple top just under a multi-month descending trendline and major Fib resistance. This ceiling has held firm since late June, despite higher lows grinding up from below. Price is now squeezed tightly between compressing demand and stacked supply, with volatility contraction apparent across the board.
The structure is coiling hard but momentum and volume must confirm resolution before positioning aggressively.
Structural & Momentum Breakdown:
Resistance Layering (Reinforced):
Triple Top: Price has repeatedly failed to break above the upper 153s.
Fib Overlap: 50%–61.8% retracement range aligns with both trendline resistance and OB stack.
Order Block Stack: Resistance from mid-153s to low-154s is now reinforced across timeframes (30M → Daily).
Momentum Shifts:
RSI Divergence: Lower highs on RSI across 2H/1H, despite flat or slightly higher price.
PVT Flattening: No fresh accumulation during recent tests.
Volume Decline: Progressive volume deterioration on each retest distributional tone building.
Demand Shelf:
Key demand and support range from low-150s to mid-151s has held through three separate dips.
This is the immediate pivot zone — lose it and vacuum effect likely down into the upper 140s.
Updated Trade Plan:
Rejection Short Setup:
Entry: Breakdown through mid-151s with confirming sell volume.
Stop: Above low-154s to account for potential deviation wicks.
TP1: Upper 148s (first OB cluster).
TP2: Mid-146s (Fib + minor support).
TP3: Low 140s (macro demand + wedge base).
Bear Confirmation: RSI breakdown + volume expansion + OB flips into resistance.
Breakout Setup (Only on Clear Validation):
Entry: Strong candle close above low-154s with breakout volume.
Stop: Below low-151s — invalidation of reclaim.
TP1: Upper 157s (Fib zone).
TP2: Low 160s (swing high area).
TP3: Upper 160s (macro breakout expansion).
Bull Confirmation: RSI > 62 on 2H, strong PVT rise, and flip of local OB into demand.
Risk Warning:
Triple tops near macro resistance are high-risk unless clearly broken. This zone is overloaded with historical rejection. Don't front-run the breakout — volume will show you who's in control.
Closing Thoughts:
With a confirmed triple top now visible, SOL is facing its most important rejection zone in weeks. Bulls must reclaim with strength or this becomes a clean setup for rotation into the mid to low 140s. Patience and confirmation are key here. Keep risk asymmetric.

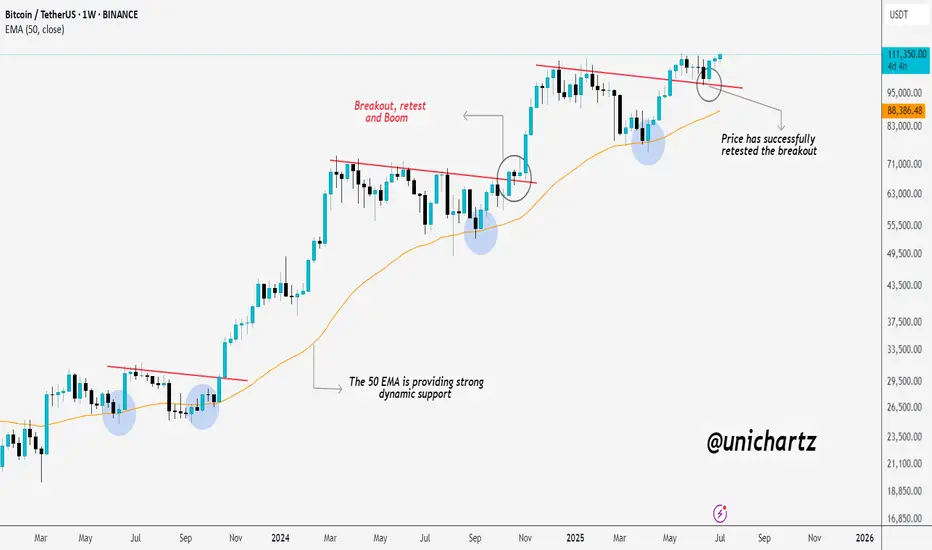
50 EMA Magic: Bitcoin Explodes After Perfect Retest!CRYPTOCAP:BTC just made a new All-Time High (ATH) — exactly as mentioned!
It broke out, retested perfectly, and blasted off.
The 50 EMA is acting like a rocket launchpad, giving price solid support every time.