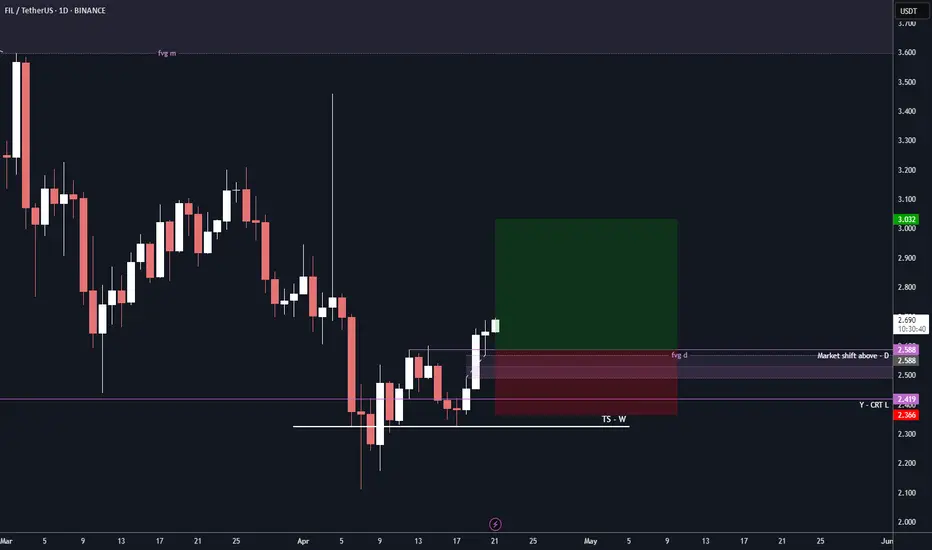
Bullish Sign FIL / USDTBreak and retest high and make a new higher low also there is a fake breakout on Weekly
Target : 3
Stop : 2.36
Cryptomarket
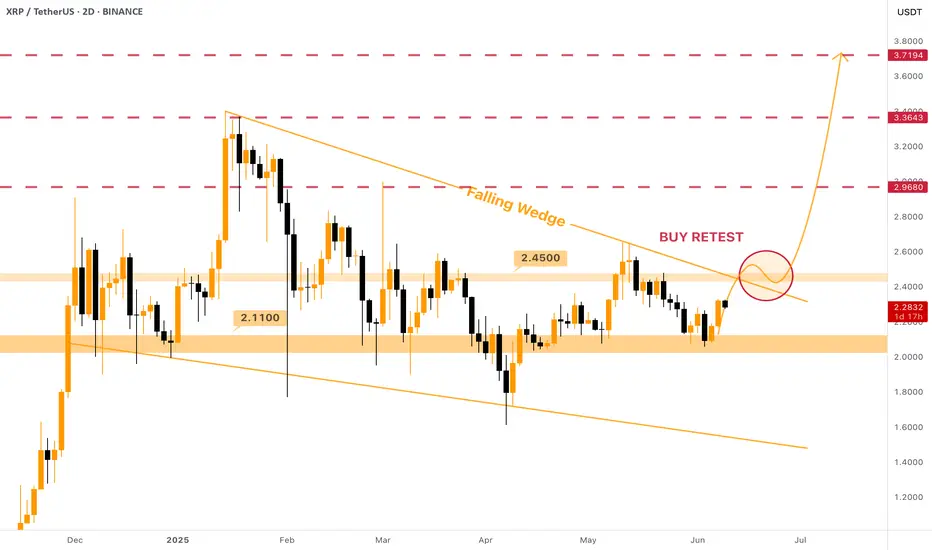
$XRP - Falling Wedge Breakout is CookingRipple is forming a simple yet perfect setup
There is a strong horizontal support level of $2.11 that was established back in December of 2024 and has held the price perfectly (with only one breakdown) since then. Moreover, at that time a massive Falling Wedge started forming and is still doing it up to this day.
Talking about resistances, there is a $2.45 one. Not very strong, but solid enough to form a decent horizontal channel within which the price moves.
So, as the result we have the following structure: CRYPTOCAP:XRP has been consolidating above strong support for 6 months already and formed a pattern that suggest upcoming upward movement. The perfect entry spot in LONG will be at the breakout&retest of the both $2.45 resistance and Falling Wedge resistance (they perfectly correlate) .
Target zone of $3.5 - $4 can be reached within the next 3 - 5 months.
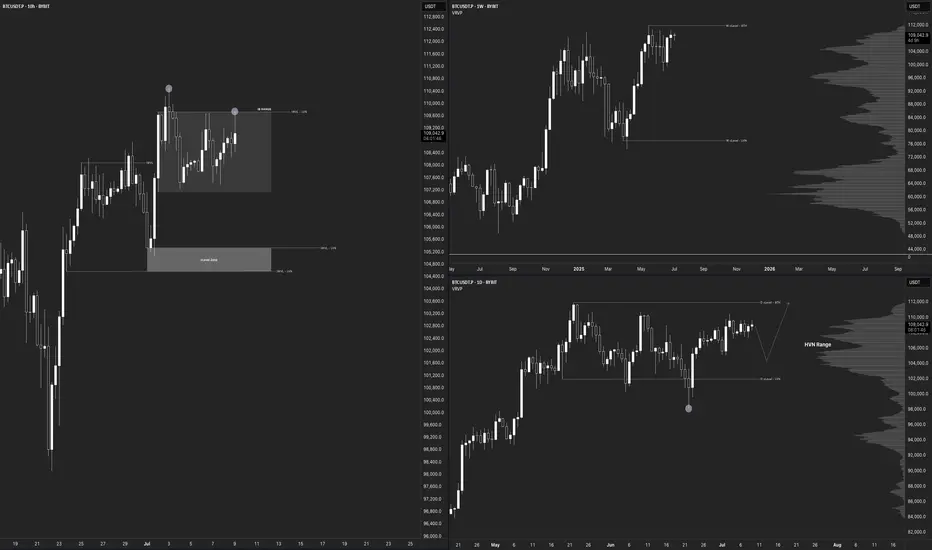
$BTC Daily Outlook BYBIT:BTCUSDT.P
Macro Picture
Weekly Chart
Both Bias & Momentum aligned bullish
Moving towards 111968.0 vLevel (HH) - ATH
Be careful with Weekly FA from that Level
More upside room from here
vLevels Range between 111968.0 - 77083.5
Daily Chart
Both Bias & Momentum aligned Bullish
Failed Auction at 102000.0
Validated from Volume Footprint Charts - Selling Delta trapped on this Failed Auction - POC & Value Area at Wick Lows
vLevels Range between 111968.0 - 102000.0
More Upside room from here, but overall consolidation for now as we are inside a High Volume Node
A pullback would be ideal to look for entries
10-Hour Chart
Price is currently inside an Inside Bar Range between 109740.9 - 107134.7
Overall momentum from the Intraweek Chart (10-Hour) is bearish due to a Failed Auction around 109740.9
Need to wait for confirmation for New Failed Auction Today.
vLevels zone around 105335.0 - 104567.0
Would be nice to have a pullback towards this zone, in which we can start looking for rejections for Intra-Week Longs
Nice zone to look for longs is also IB Range Low 107134.7
Intraday Picture
1-Hour Chart
No outlook for now, waiting for Intra-Week Chart Confirmation
No shorts from here, as HTF bias & momentum remain bullish
Patience - Overall range, don't want to get chopped here.
10-Minute Chart
No Outlook for now, waiting for MTFs and HTFs confirmation
Bitcoin Outlook — Narrative Recap
On the higher time-frames the picture is straightforward: both weekly and daily bias and momentum are in sync to the upside. Price is grinding toward the prior all-time high vLevel at 111 968 USD. Treat that level with respect, if a weekly failed auction (FA) forms there, it could mark the next inflection, but for now there is still air between price and that resistance. The broader weekly value range spans from 111 968 USD down to 77 083 USD.
The daily chart reinforces the bullish thesis. A failed auction printed at 102 000 USD, and volume-footprint data show sell-side delta trapped at those wick lows; the point of control and value area also sit there. 102 k is now strong support. Price is chopping inside a high-volume node, so a healthy pullback toward 102 k (or at least into value) would be the ideal place to reload longs before the next push higher.
Drop to the 10-hour “intra-week” view and momentum tilts short-term bearish. Price is boxed inside an inside-bar range between 109 741 USD and 107 135 USD after a failed auction at the range high. The preferred play is patience: let price drift into either the IB low at 107 135 USD or, even better, the deeper vLevel cluster at 105 335 USD – 104 567 USD. There we’ll watch for a fresh failed auction or obvious seller exhaustion to trigger new longs targeting the ATH zone.
On the 1-hour and 10-minute intraday charts there is no edge yet, conditions are choppy and hostage to the intra-week setup to align with the Higher Timeframes. With higher-time-frame bias still firmly bullish, fading strength makes little sense; stand aside until the 10-hour chart confirms a pullback and reversal.
Bottom line: stay bullish, stalk a pullback, and look to join strength from 107 k or 105–104 k. A decisive daily close back below 102 k would force a rethink; until then, patience is the edge.
ZBCN/USDT | Breakout from Downtrend Channel | 360%+ Potential !!ZBCN has broken out of a clean falling channel on the 4H timeframe. This setup resembles the earlier rally in May that delivered over 350% upside. We may be setting up for another explosive move, contingent on a successful retest.
Trade Setup:
Entry (on retest): 0.002901 – 0.003021
Stop Loss: 0.00243 (below channel low)
Targets:
0.00375
0.00510
0.00685
Long-term target: 0.01137
Total potential upside: ~360%
Structure Analysis:
Price is now out of the descending channel
Previous move from similar breakout yielded ~357%
RSI climbing with volume surge — momentum shift evident
Watching BTC for macro support
This could be a game-changing entry for medium to long-term holders if the retest holds.
DYOR | Not financial advice

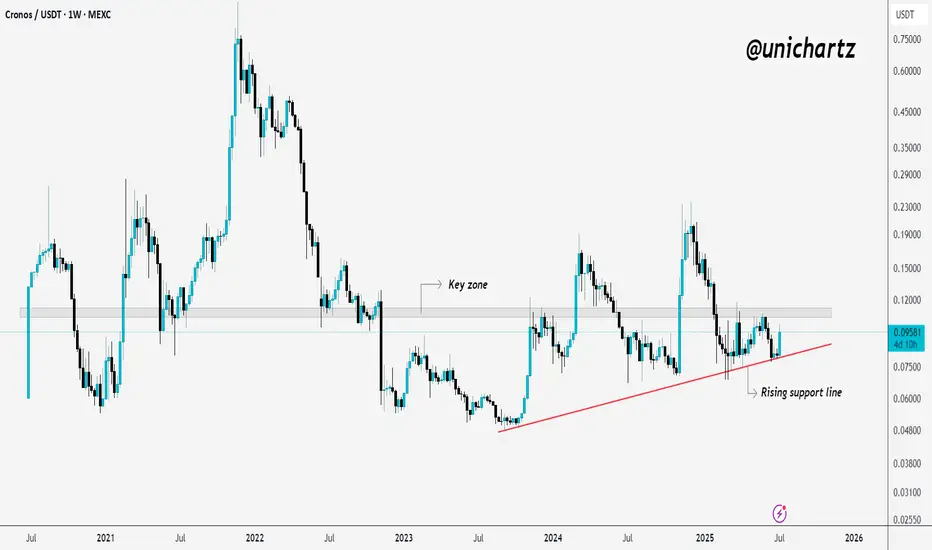
Cronos Holds Key Trendline – Will Resistance Crack Next?CRO is bouncing off its rising support line again.
The price has respected this trendline multiple times, showing steady accumulation. It’s also sitting just below a key resistance zone, if it breaks above that, we could see momentum kick in.
For now, the structure looks healthy as long as the support holds.
DYOR, NFA
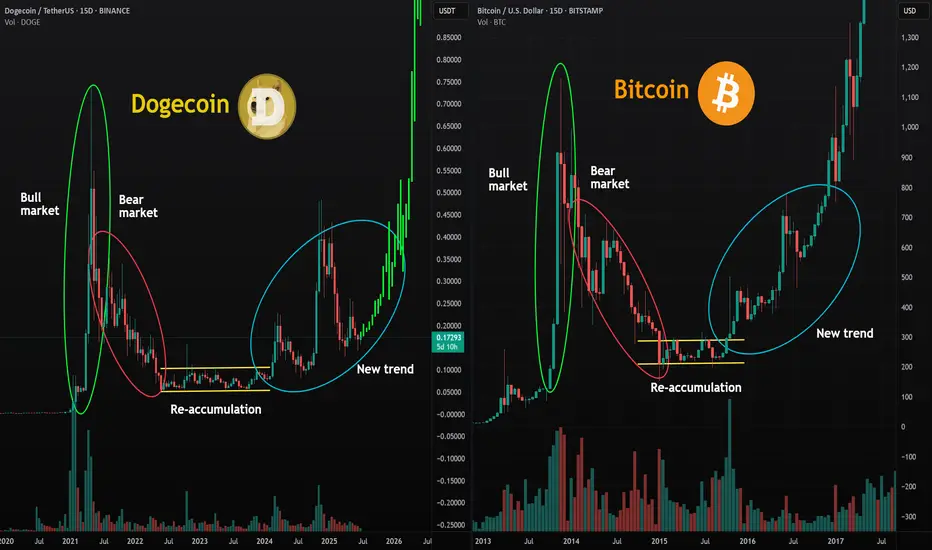
Dogecoin Will Shock Investors With Its Next Move!Today I’m doing an in-depth analysis of Dogecoin and its market cycle in comparison to the early Bitcoin cycles. As you can see, the same human psychology and emotions are playing out in the Dogecoin market that we previously saw with Bitcoin. With mass adoption coming to the cryptocurrency markets, it’s very possible we’ll see a parabolic run on Dogecoin similar to what we saw with Bitcoin in 2016 and 2017. This could lead us to a new all-time high.
Because markets are fractal in nature, we see similar patterns appearing over and over again. If you can learn to understand and identify these cycles and patterns, you can position yourself for maximum profit. I see Dogecoin running very bullish through the rest of 2025, and it could also continue into 2026 as mass adoption drives increasing demand for cryptocurrencies. In fact, we could see the entire crypto market run all the way into 2029, as the stock market is also primed for a large parabolic move in its own cycle.
Stocks and crypto are heavily correlated since both are tied to the global economy. Contrary to popular belief, the world economy may actually be set up for a massive run in value—almost like a “Roaring 20s 2.0.” This means buying Dogecoin today could be like buying Bitcoin in early 2016—the opportunity for profit is enormous.
As always, stay profitable.
- Dalin Anderson
TradeCityPro | Bitcoin Daily Analysis #123👋 Welcome to TradeCity Pro!
Let’s dive into the analysis of Bitcoin and key crypto indices. As usual, in this analysis I’ll go over the trigger levels for the New York futures session.
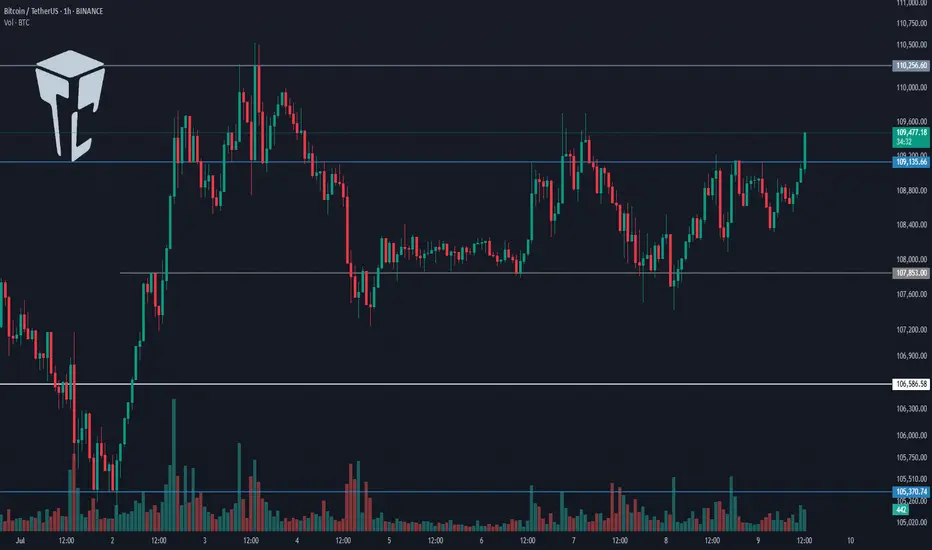
⏳ 1-Hour Timeframe
On the 1-hour chart, as you can see, Bitcoin is currently below a resistance zone at 109135 and is approaching this level with strong bullish momentum.
⭐ If the price breaks and stabilizes above this level, we can open a long position. Both the volume and market momentum are confirming this setup well, but the main long trigger remains the breakout of 109135.
📈 If this bullish move turns out to be fake and the price starts heading downward, the first trigger we have for a short position is the 107853 level. A break below this level would give us an entry for a short.
👀 Overall, I think the market has been pretty straightforward lately, and we don’t need complex tools to analyze it. Just these support and resistance levels and simple triggers are sufficient.
👑 BTC.D Analysis
Moving on to Bitcoin Dominance, the 65.04 floor has finally broken, and dominance is now trending downward.
💫 The next support ahead is at 64.81, which the price is approaching. We’ll have to see how the market reacts to this level. For now, the trend of dominance in the 1-hour timeframe appears bearish.
📅 Total2 Analysis
Let’s look at Total2. With Bitcoin Dominance dropping and Bitcoin itself moving upward, Total2 has started a strong bullish leg and is heading toward the 1.18 level.
🔑 Many of the altcoins I’ve analyzed have triggered their entries, and as long as Total2 remains bullish, these moves can continue.
📅 USDT.D Analysis
Now to Tether Dominance. After breaking below the 4.76 level, it has now reached the 4.72 floor.
💥 A break below this floor could confirm continuation of the downtrend, but in my opinion, the price may pause here for some correction and consolidation.
❌ Disclaimer ❌
Trading futures is highly risky and dangerous. If you're not an expert, these triggers may not be suitable for you. You should first learn risk and capital management. You can also use the educational content from this channel.
Finally, these triggers reflect my personal opinions on price action, and the market may move completely against this analysis. So, do your own research before opening any position.
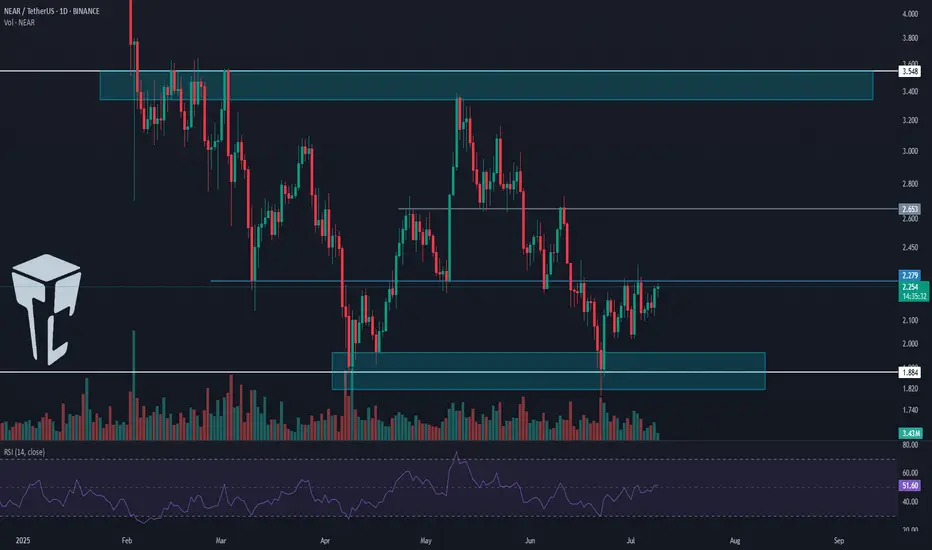
TradeCityPro | NEAR Faces Resistance in Lower Range Zone👋 Welcome to TradeCity Pro!
In this analysis, I’m going to review NEAR, one of the AI and Layer1 crypto projects, currently ranked 35 on CoinMarketCap with a market cap of 2.77 billion dollars.
📅 Daily Timeframe
On the daily chart, NEAR has formed a large ranging box between the 1.884 and 3.548 levels and is currently positioned in the lower half of that range.
✔️ After hitting the lower boundary, the price has formed a trigger around the 2.279 level and is now fluctuating below it.
✨ A breakout above this level could give us a long entry. However, the downside is that volume is decreasing and diverging from price. If this volume drop continues, the likelihood of the range breaking to the downside increases.
📊 If volume starts to rise, considering that the RSI is stabilizing above the 50 zone, the probability of a bullish scenario becomes much stronger.
💥 The main resistance above the current price is at 3.548, which I’ve marked as a zone. In my opinion, breaking this level would be the main trigger for a spot buy, and I personally plan to wait for this level to break before buying spot.
🔔 If the price gets rejected from the 2.279 level and bearish momentum enters the market, a break below 1.884 would be a strong short trigger and could signal the start of a new bearish leg and continuation of the previous downtrend.
📝 Final Thoughts
This analysis reflects our opinions and is not financial advice.
Share your thoughts in the comments, and don’t forget to share this analysis with your friends! ❤️
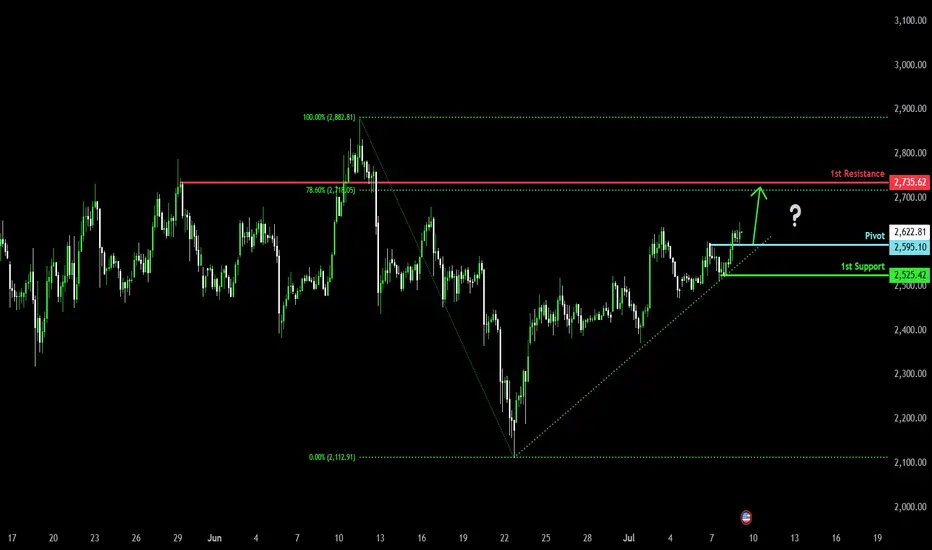
Bullish momentum to extend?Ethereum (ETH/USD) is reacting off the pivot which is a pullback support and could rise to the 78.6% Fibonacci resistance.
Pivot: 2,595.10
1st Support: 2,525.42
1st Resistance: 2,735.62
Risk Warning:
Trading Forex and CFDs carries a high level of risk to your capital and you should only trade with money you can afford to lose. Trading Forex and CFDs may not be suitable for all investors, so please ensure that you fully understand the risks involved and seek independent advice if necessary.
Disclaimer:
The above opinions given constitute general market commentary, and do not constitute the opinion or advice of IC Markets or any form of personal or investment advice.
Any opinions, news, research, analyses, prices, other information, or links to third-party sites contained on this website are provided on an "as-is" basis, are intended only to be informative, is not an advice nor a recommendation, nor research, or a record of our trading prices, or an offer of, or solicitation for a transaction in any financial instrument and thus should not be treated as such. The information provided does not involve any specific investment objectives, financial situation and needs of any specific person who may receive it. Please be aware, that past performance is not a reliable indicator of future performance and/or results. Past Performance or Forward-looking scenarios based upon the reasonable beliefs of the third-party provider are not a guarantee of future performance. Actual results may differ materially from those anticipated in forward-looking or past performance statements. IC Markets makes no representation or warranty and assumes no liability as to the accuracy or completeness of the information provided, nor any loss arising from any investment based on a recommendation, forecast or any information supplied by any third-party.
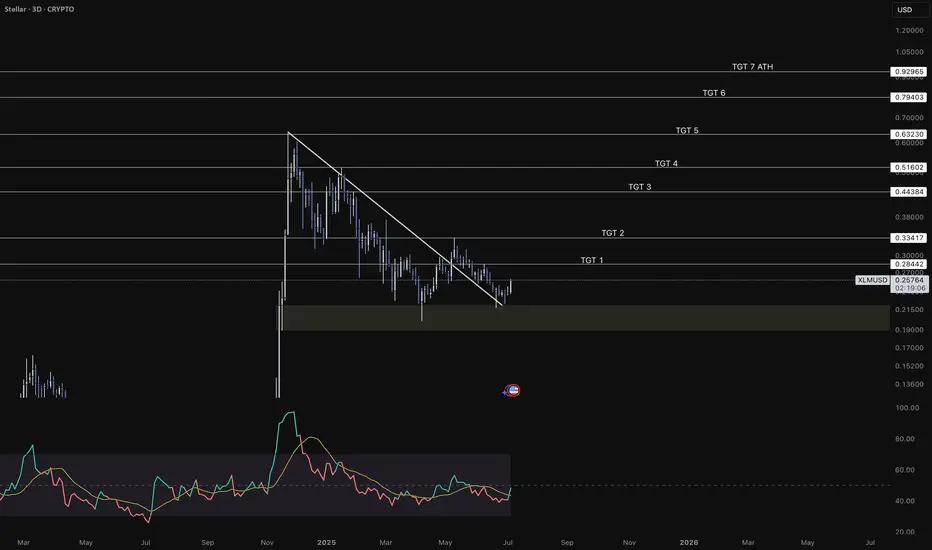
Is The Bottom In For XLM?Stellar Lumens (XLM) is exhibiting strong bullish momentum supported by favorable technical indicators, resilient support zones, and growing investor sentiment around utility-driven altcoins. The recent rebound off the $0.24 support level marks a significant higher low on the daily chart, reinforcing the continuation of the medium-term uptrend that began in Q2 2025. This rebound occurred with increasing trading volume, signaling renewed accumulation and a potential shift in market structure from consolidation to expansion.
I firmly believe the bottom is in, and the next leg up is upon us.
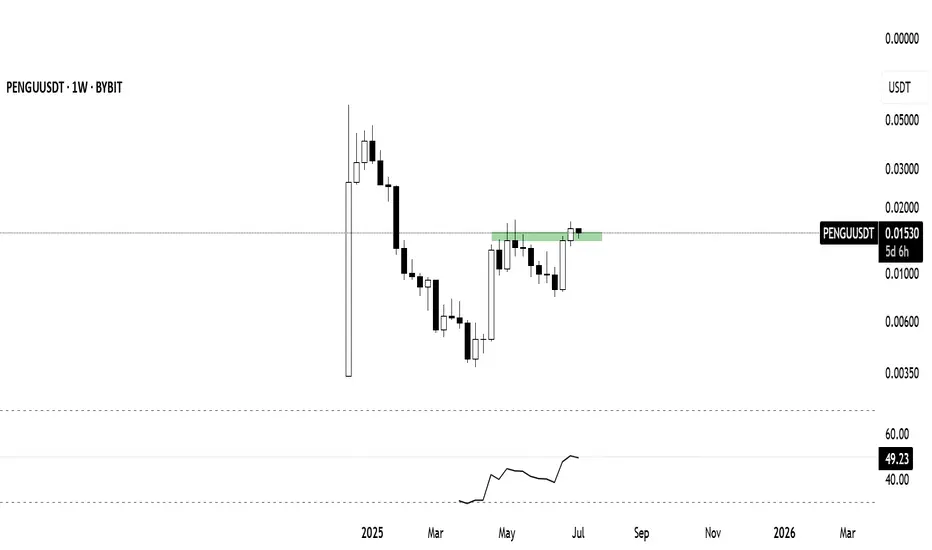
The best-looking HTF meme chart, hands down is $PENGUThe team behind the crypto mascot accomplished a lot over the last couple of weeks, and the TA is showing;
- CBOE filing for PENGU ETF
- Appeared at @Nasdaq
- Listed on @eToro
- Listed on @RevolutApp
- Listed on @Official_Upbit
- Listed on @WebullGlobal Pay
- @NASCAR Partnership
- PEZ x Pudgy Penguins Partnership
- Miles & More Partnership
- @PenguClash reached 2M+ on waitlist
- 1B views per day
All this and much more!
@pudgypenguins are doing it the right way 🐧
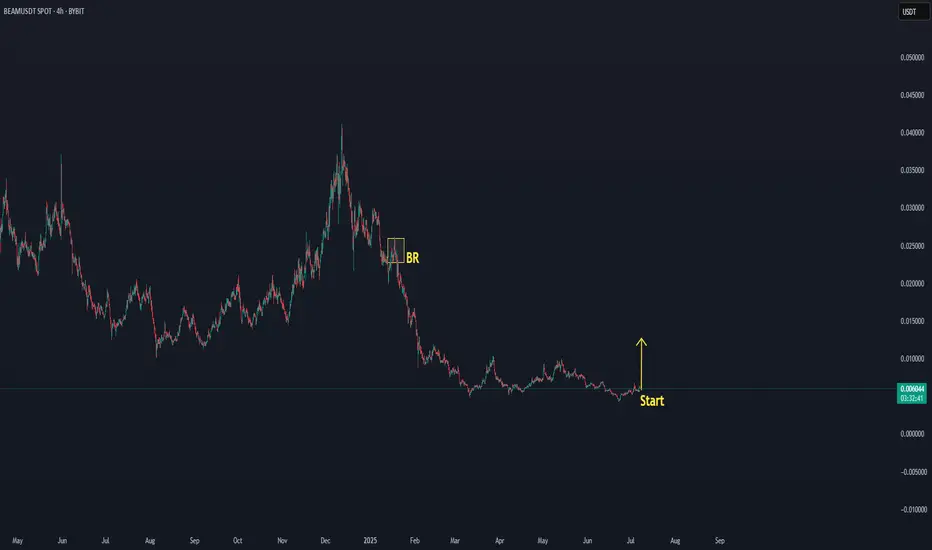
BEAM FROM A NORMAL COIN TO A GOLDEN COIN SOON!! DUBBLE EFFECTThis is exactly what we expect, depending on the data that Beamx/USDT will show an interesting break since the new data.
when the real whale entering is started, we will see diffrance price movements ( not in a stable way as we see it now)
What is the expected target
up $0,001
There is an interesting update upcoming also that can give this coin an effect from a normal coin to a golden coin.
Every good increase and cycle movement takes time.
So let's see what time this expected update will take..
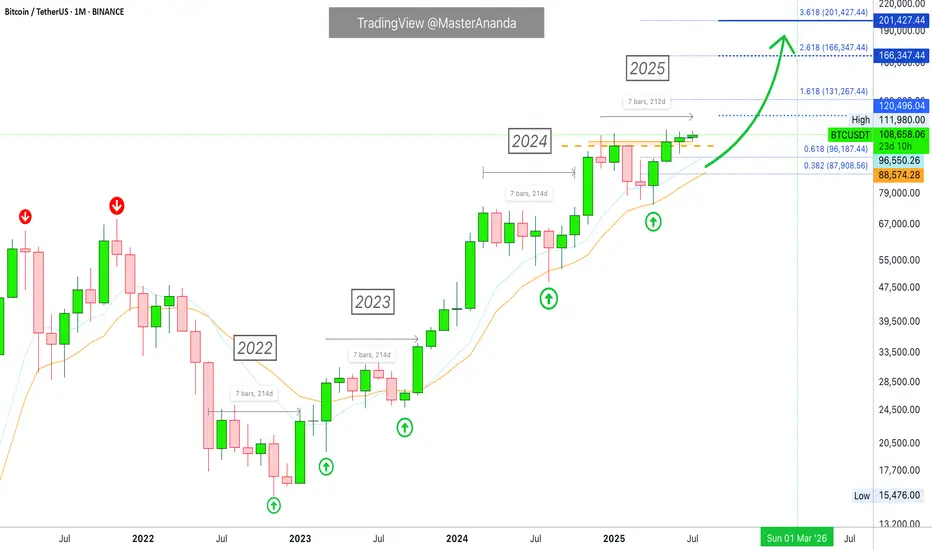
Bitcoin Monthly · New ATH vs 2021, Indicators & MoreLast month Bitcoin produced its highest close ever, $107,146. The last three months all closed green, the close was higher than the open, and this is the fourth green month so far.
Bitcoin tends to produce a period of bullish consolidation before a major move, and this is exactly what we are seeing now. Bitcoin tends to produce a correction before a major bullish move, and this is exactly what happened between January and April. Bitcoin is set to grow.
Past action · consolidation
We already looked at the consolidation period that happens between each major price advance. Since 2022, Bitcoin has been moving sideways for some 200-220 days before each advance. This happened in 2022, 2023, 2024 and also now in 2025.
Looking at it from the monthly timeframe, the consolidation period was capped each time at 7 bars, 214 days. Current consolidation has already been going for more than 215 days. Bitcoin is set to continue growing.
Indicators · MAs, RSI & MACD
Bitcoin is trading above all moving averages. The monthly RSI is very strong, beyond 70.6.
The monthly MACD is moving at all-time high levels, trending up with room available for additional growth.
Chart patterns · candlestick reading
The chart patterns now has no similarities to 2021. Many people were saying that Bitcoin produced a double-top similar to 2021 and was set to move down. I completely disagree with this analysis.
In 2021 both instances when Bitcoin peaked the month ended up closing red. In 2025 the months when Bitcoin peaked the months ended closing green.
The same month the peak was hit in 2021 was followed by bearish action, twice. And of course, the bear market. In 2025 the market has been consolidating for months and trading near its all-time high.
Finally, in 2021 each peak was 7 months apart, 214. In 2025, the last two peaks are 4 months apart, only 120 days.
This difference is good to point out because market conditions are not the same. Not the same market conditions means that Bitcoin is not likely to go into a bear market now, instead, it can produce something difference. The market has only three directions: Down, sideways and up.
Down has been eliminated based on past action.
Sideways is happening now.
Something different only leaves the upside open; Bitcoin is going up.
Namaste.
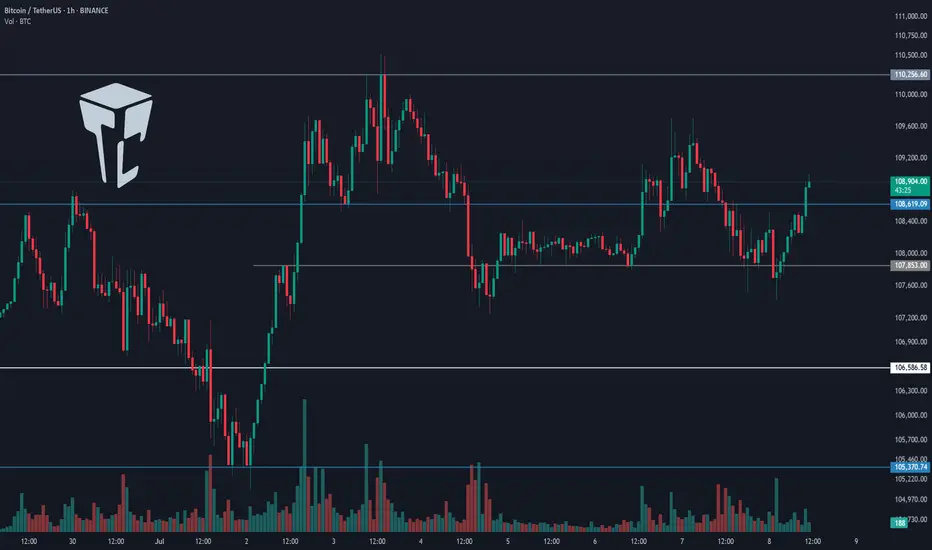
TradeCityPro | Bitcoin Daily Analysis #122👋 Welcome to TradeCity Pro!
Let’s dive into the latest analysis of Bitcoin and major crypto indicators. As usual, this update will focus on potential triggers for the New York futures session.
⌛️ 1-Hour Timeframe
On the 1-hour chart, Bitcoin is once again ranging between the 107,853 and 108,619 levels.
✔️ Last night, Bitcoin briefly faked out below the bottom of this range, so we now need to wait and see how the price reacts upon revisiting this area.
💫 I believe it’s best to hold off on entering a short position until we identify the precise location of the support line. As price retests this area, we can pinpoint the true support level.
✨ Once that level is confirmed, and if it breaks, a short position could be considered. The next support zones would be at 106,586 and 105,370.
📊 Make sure to watch the volume closely for this trade, and I strongly recommend waiting for a volume confirmation before entering.
📈 As for a long position, if 108,619 breaks to the upside, we could consider going long. The buying volume in the current upward leg is increasing, and if this trend continues, a breakout above 108,619 would make a long position reasonable.
👑 BTC.D Analysis
Moving on to Bitcoin dominance — it has once again reached its trendline and is currently being rejected from it. If this rejection continues, BTC.D could decline toward 65.04.
🔍 However, if the trendline breaks, the 65.31 level will be the bullish confirmation trigger.
📅 Total2 Analysis
Now on to the Total2 index (altcoin market cap excluding BTC), it has bounced from the 1.14 support and is moving toward 1.16.
🔑 A breakout above 1.16 would serve as a bullish confirmation for long positions, with 1.17 acting as the main breakout trigger.
📅 USDT.D Analysis
USDT dominance is also moving downward and has reached the 4.78 support zone.
💥 A breakdown below this level would confirm a bearish continuation toward the 4.72 level..
❌ Disclaimer ❌
Trading futures is highly risky and dangerous. If you're not an expert, these triggers may not be suitable for you. You should first learn risk and capital management. You can also use the educational content from this channel.
Finally, these triggers reflect my personal opinions on price action, and the market may move completely against this analysis. So, do your own research before opening any position.
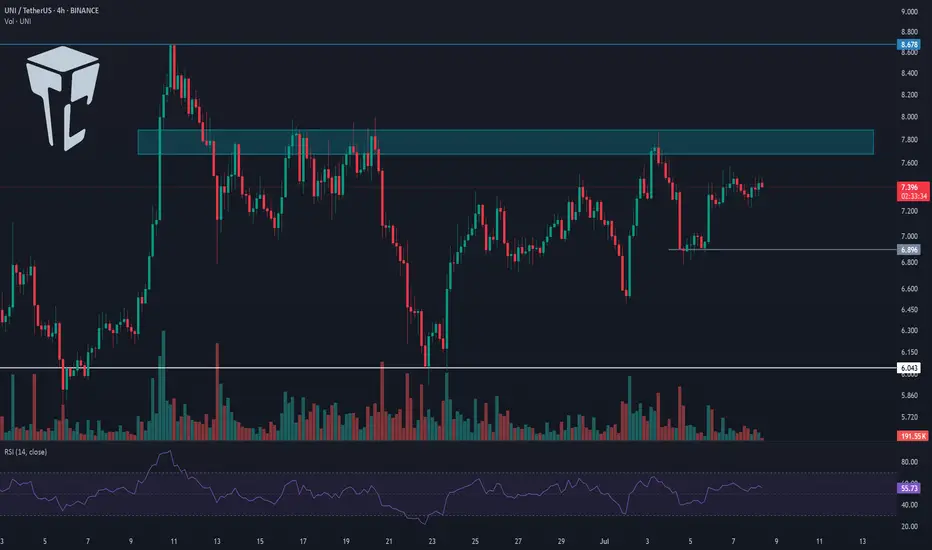
TradeCityPro | UNI Builds Pressure Below Key Resistance Zone👋 Welcome to TradeCity Pro!
In this analysis, I’ll be reviewing the UNI coin — one of the notable DeFi tokens, currently ranked 27th on CoinMarketCap with a market cap of $254 million.
⌛️ 4-Hour Timeframe
On the 4-hour chart, as you can see, UNI has formed a bottom around the 6.043 level, which is considered its key support zone. After reaching this level, the price began an upward move, though the trend appears very weak.
✔️ Currently, there’s a resistance zone just above the price that has previously caused multiple rejections. Once again, the price is moving toward this zone.
📊 The volume during this latest upward leg is very low, which is not a good sign for initiating a bullish trend. If the price reaches this resistance level with such low volume, there's a high likelihood of another rejection.
🔽 If that happens, we could consider opening a short position based on this rejection. However, my main trigger level for a short is the break below 6.896 — I personally would wait for this level to be breached before entering a short position.
✨ The next key support, in case 6.896 is broken, is the 6.043 zone. This is a major support level and could serve as the target for the short trade. If this level is broken as well, it could mark the beginning of a strong downward trend.
🔍 On the other hand, if volume starts to pick up and the resistance zone is broken, we could open a long position. The target for this could be around 8.678 — or even a setup in anticipation of a breakout above 8.678.
🔔 Which scenario you choose depends largely on your market perspective. If you're looking for a short-term trade, the first scenario is more appropriate. But if you're aiming for a long-term position with a wider stop loss, the second scenario would be the better choice.
💥 In either of the long scenarios, I strongly recommend confirming the move with volume. For further confirmation, you can also check if RSI enters the overbought zone.
📝 Final Thoughts
This analysis reflects our opinions and is not financial advice.
Share your thoughts in the comments, and don’t forget to share this analysis with your friends! ❤️
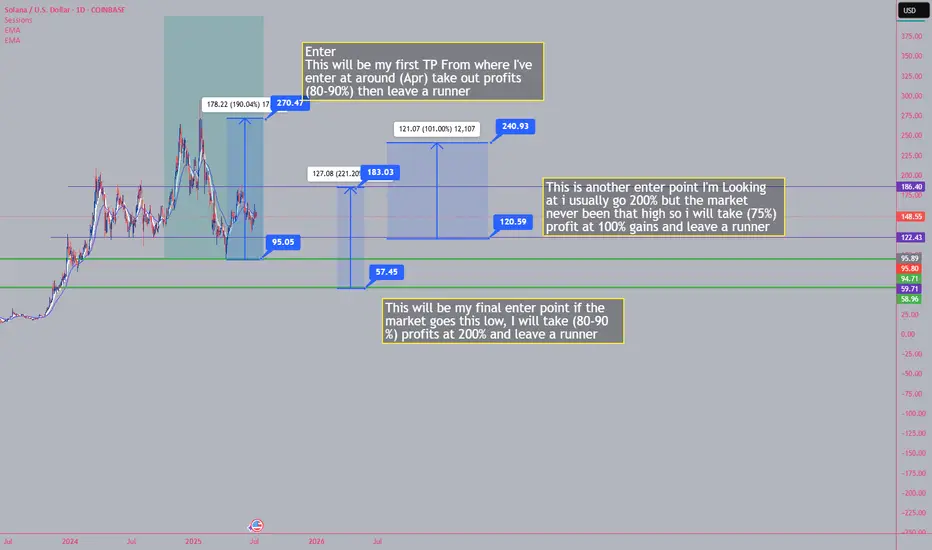
What I See on SOLUSD Crypto Hi, I'm making this simple, so SOL coin had a crazy run in 2024 now it's in a dip faze and ranging era so therefore I'm buying low and dips area don't make profits complicated
not a Financial Advisor so please take at your own risk
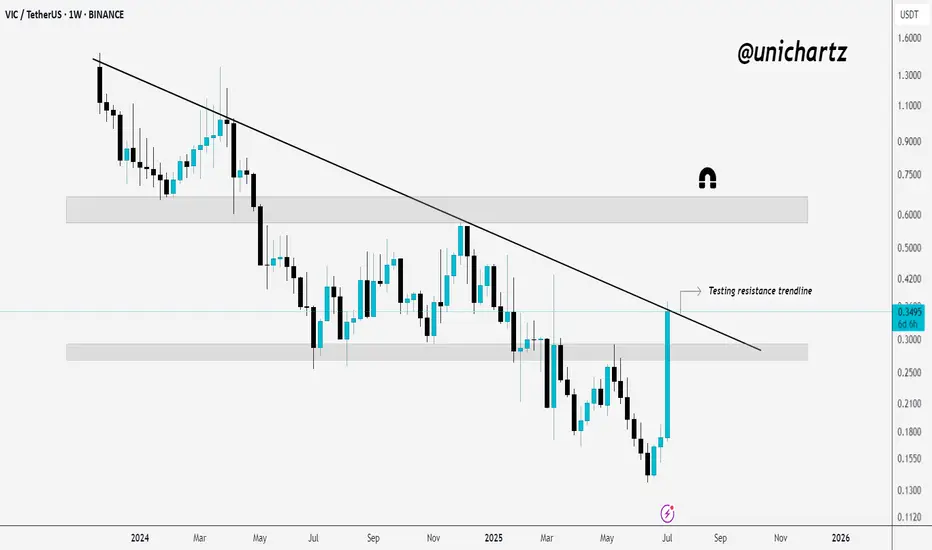
VIC Faces Crucial Resistance Test After Explosive RallyVIC just popped over 100% and is now testing a key resistance trendline.
After weeks of sideways chop and downside pressure, VIC has made a strong bounce off the demand zone and is now pushing right into the falling resistance trendline.
This is a crucial level, if it breaks and holds above this trendline, we could see a shift in structure and more upside toward the next supply zone.
But if it gets rejected again, price might cool off and retest lower supports.
DYOR, NFA
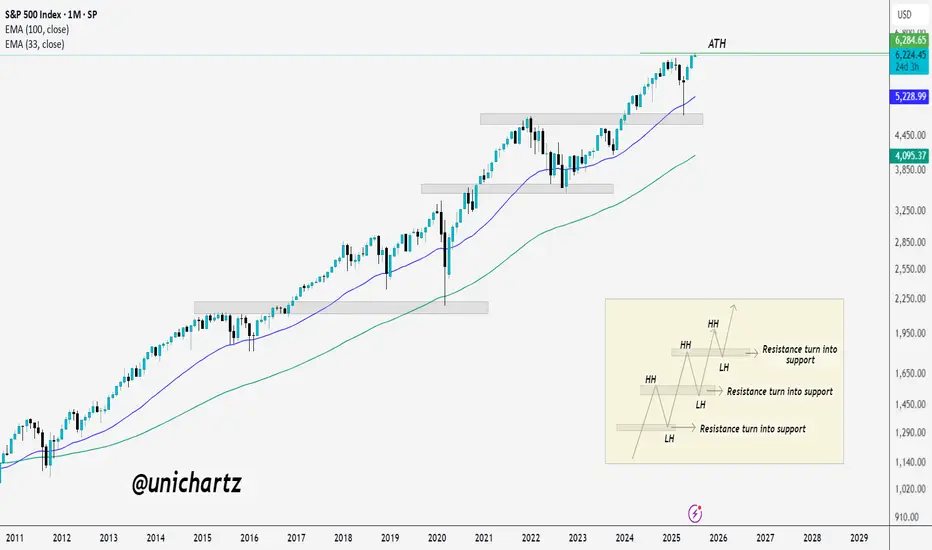
Decade-Long Uptrend Holds Strong – SPX Hits Fresh HighsS&P 500 Just Hit a New All-Time High (ATH) 🚀
The index has been in a strong uptrend for over a decade, consistently printing higher highs (HH) and higher lows (HL).
Every major resistance level has flipped into support, classic bull market structure.
Even during corrections, the 33 EMA and 100 EMA have acted like dynamic support zones.
Now that SPX has cleared its previous ATH, the structure remains intact, unless a strong breakdown occurs, momentum is still with the bulls.
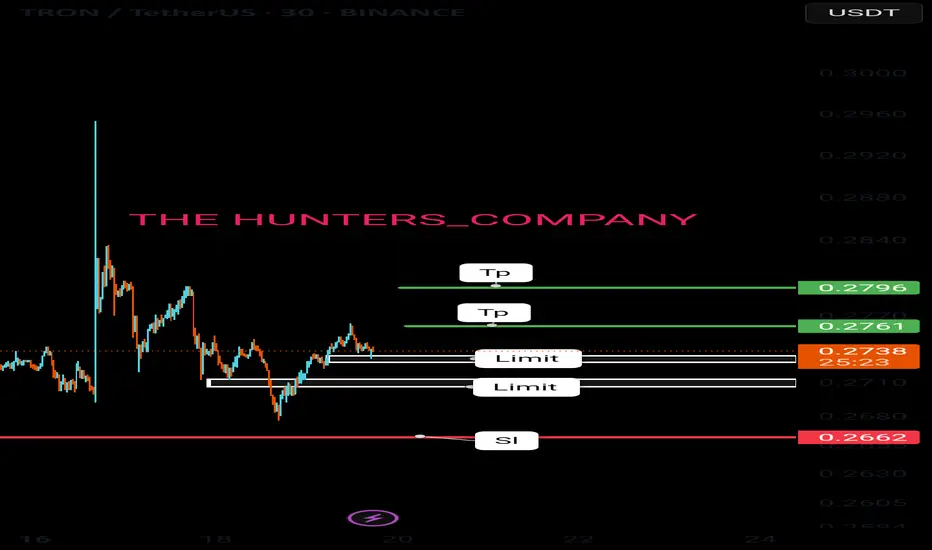
Free signals: today (TRX)hello friends✋️
Considering the drop we had, you can see that the price was well supported in the specified area and buyers came in. Now in the return of the price, we can buy step by step in the specified support areas and move with it until the specified goals, of course, with the management of shame and risk...
*Trade safely with us*
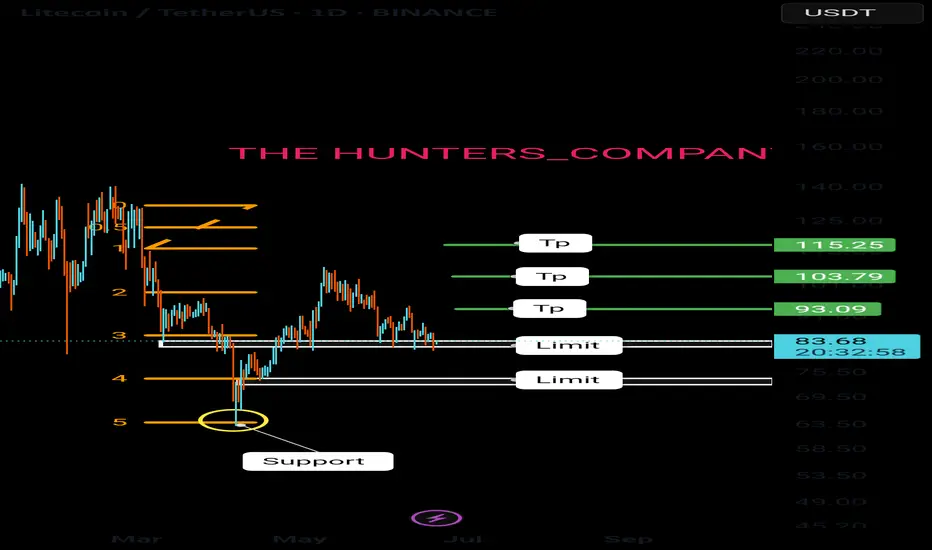
Litecoin:Is the main climb coming?hello friends👋
As you can see, the price, after falling in the support area specified by the buyers, has been supported and returned, forming an upward pattern.
Now we don't enter into a transaction with just one pattern, we also check the entry of buyers and the amount of currency and other factors and draw conclusions.
According to the points we have said, we have identified very important support points for you to buy step by step with capital and risk management and move to the specified goals.
🔥Follow us for more signals 🔥
*Trade with us safely*
Live tradehello friends👋
✅️Considering the drop we had, now the price has reached an important and good support and the price is supported by the buyers, and the downward trend line has broken and the ceiling has been raised. Considering this, we entered into the transaction with capital and risk management.
🔥Join us for more signals🔥
*Trade safely with us*
Live trade hello friends👋
Considering the fall that we had, you can see that the buyers supported the price at the support point and caused it to grow. Now with the return of the price and the construction of an upward pattern, you can see that we can enter into the transaction with capital and risk management and move to the specified goals with it.💰
🔥Join us for more signals🔥
*Trade safely with us*
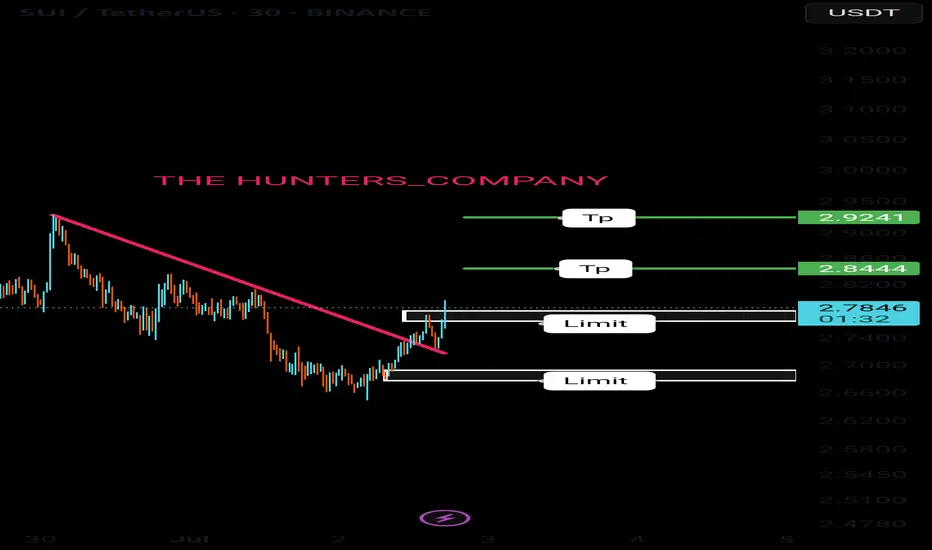
Sui update hello friends👋
✅️Considering the drop we had, now the price has reached an important and good support and the price has been supported by the buyers and the downward trend line has broken and the ceiling has been raised. Considering this, it was possible to enter into the transaction with capital and risk management and move to the specified goals with it.
🔥Join us for more signals🔥
*Trade safely with us*