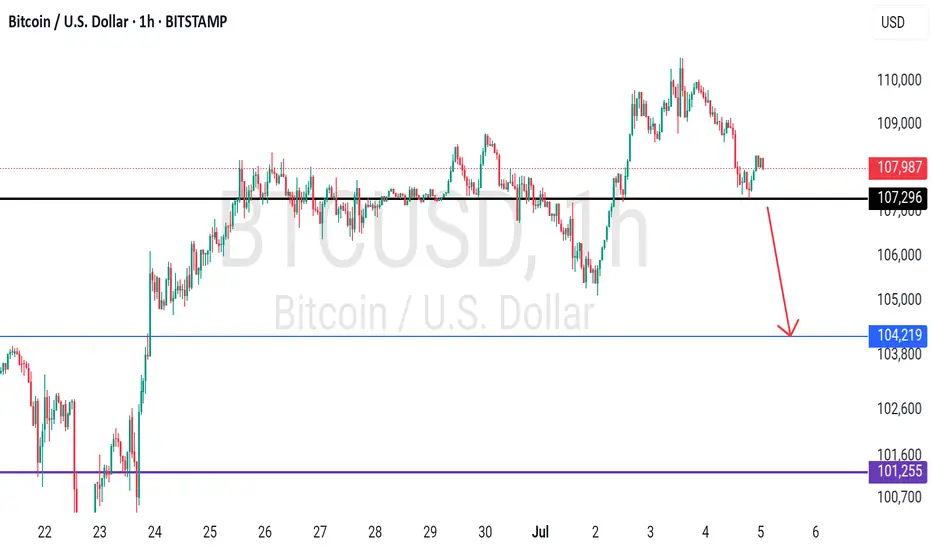
BTCUSDT - single support, short below.#BTCUSDT.. .market placed a very reasonable low tha tia around 107200
Keep close it and short below that only.
Good luck
Trade wisely
Cryptomarket
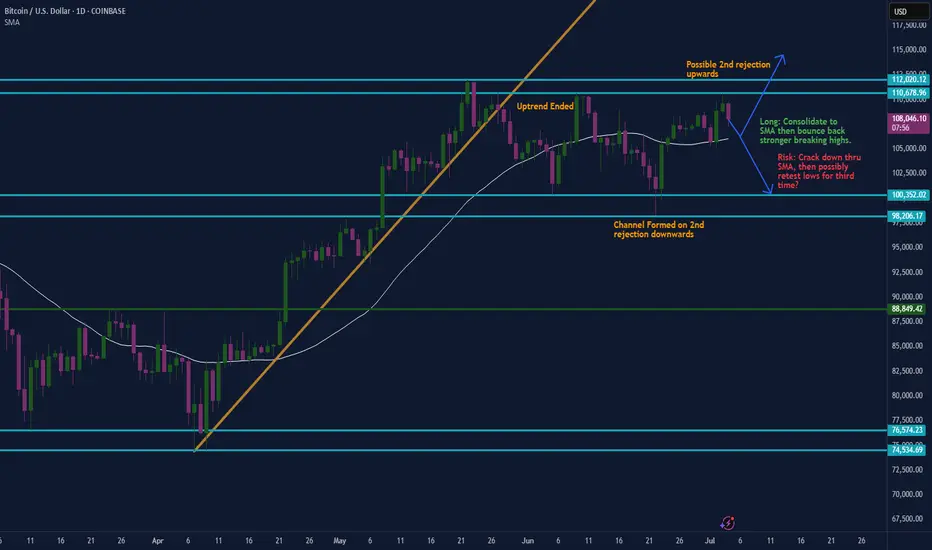
Are we still in an oscillator?Been over a month in this channel now. Now clear signs of breaking up or down. We are likely headed back to the 30 day SMA, and from there who knows. I tend to like the upside here being above the SMA, but we all know it can crack down and retest the lows yet again. I'm saying we retest the highs first.
Free signal hello friends👋
✅️Due to the price reaching the important weekly back support, the price is expected to grow, so you can enter into the transaction with risk and capital management and move to the specified goals.
🔥Follow us for more signals🔥
*Trade safely with us*
Bitcoin Euro is €82,000 nextIn this video I go through an idea that may take bitcoin down to the €82,000 region .
I cover the current price action and run through a scenario of bitcoin coming down to the Newley spawned quarterly pivots and faking out at the value area low before coming back up into the range .
The tools I used in the video are quarterly pivots , anchored vwap , Fibonacci, fixed range volume profile and a tpo chart .
Appreciate your following and Good luck with your trading !

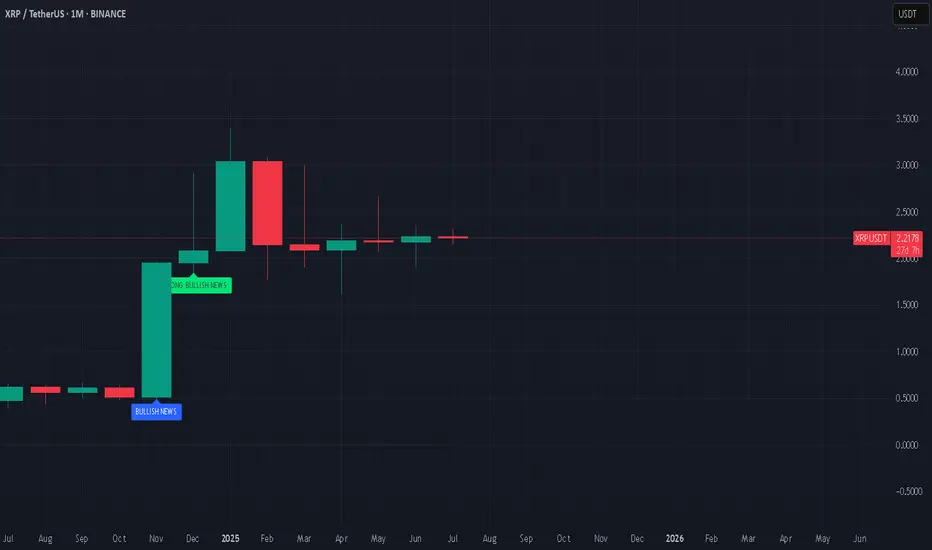
Will Ripple "leave a dent in the universe"?They called us crazy, when we bought xrp at the bottom, in the midst of court cases. What they don't see is that, many TODAY major companies that changed the world (e.g. Apple, Amazon, MSFT etc.) had long term court cases with the SEC before "leaving a dent in the universe". In our opinion, Ripple is next in line.
#xrp #crypto #bitcoin #ripple #banking #blockchain #finance #money #stablecoin #financialsystem
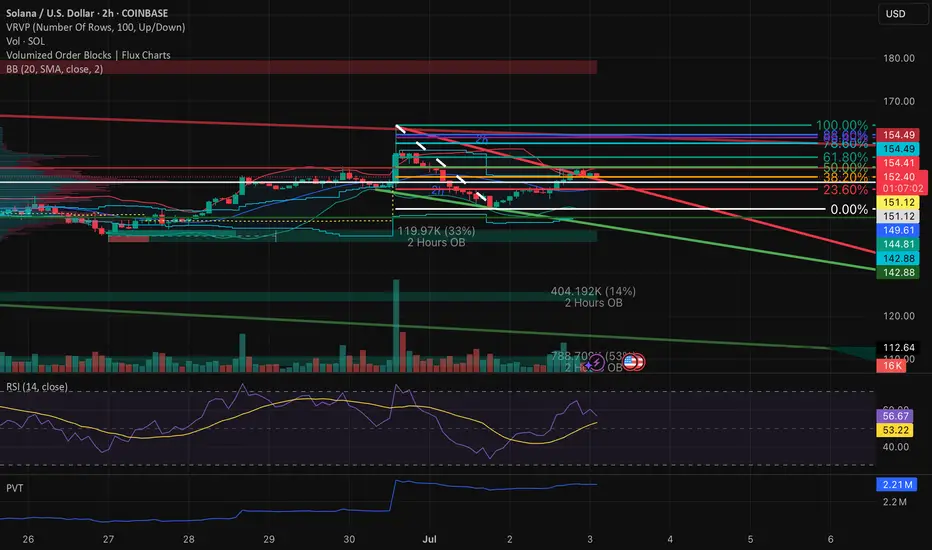
SOL – Compression at ResistanceAfter retracing up toward the 50% Fib level (around 154.3–154.4 on the daily chart), SOL/USDT has now stalled beneath key resistance and is rolling back into the reaction range. A close look at both the 1D and 2H charts reveals a clear case of a failed swing high rather than a trend reversal.
1. Structural Context
SOL remains inside its broader downtrend channel (green lines). The bounce off the June low carved out a higher low, but the subsequent rally ran into:
The daily descending trendline (red) from the June high
The 50% Fib retracement of the June down-leg (154.3–154.4)
A sell-side order block (red volume bars on the left VPVR)
The daily 20-period SMA and upper Bollinger Band
Because price could not clear these layers, the move shows the characteristics of a lower high inside a downtrend rather than a genuine breakout.
2. Multi-Timeframe Confirmation
Daily (1D) Chart
Retracement: Peaked at 50% Fib then reversed.
Volume Profile: Thick VPVR node at 154–156 acted as a supply shelf.
Bollinger Bands: Upper band contained the rally.
RSI: Pulled back from ~55 and printed a lower high as price challenged 50%.
PVT: Flat, indicating no real net buying during the bounce.
2-Hour (2H) Chart
Trendlines: A shorter-term red downtrend line capped the local rally near 154.
Order Blocks: Green buy-block around 137–140 held the low; red sell-block around 154–157 limited upside.
RSI: Printed a lower high on the second leg up, even as price revisited prior highs.
Volume: Tapered off on the approach into the 50% Fib zone, then increased on the pullback — a sign of distribution.
3. Key Levels & Next Moves
Immediate Support:
152.2–152.5 (38.2% Fib)
151.1–151.9 (23.6% Fib & daily BB midline)
Structural Support Zones:
146.1–144.6 (prior consolidation & lower Bollinger band)
141.5–140.9 (secondary order block)
134.0–137.0 (major demand cluster)
Immediate Resistance:
154.3–154.4 (50% Fib + daily trendline + SMA)
156–158 (78.6–100% Fib band + higher-timeframe supply)
If SOL fails to hold 152.2–152.5, look for a retest of the 146–144 zone. A breach below 144 opens the path back toward the 137–134 order block. Conversely, a sustained reclaim of 154.4 on volume would be needed to shift the short-term bias neutral.
4. Conclusion
This sequence—bounce into 50% Fib, capped by overlapping resistance, followed by divergence in momentum and rising volume on the pullback—confirms another lower high in SOL’s downtrend. Until price can clear 154.4 with conviction, the path of least resistance remains downward.
BTC shorting opportunity comes againBTC climbed above 108000 again, and the short-term bullish power was slightly stronger. According to the current strength, BTC still has room for growth, but it is still under pressure in the 109000-110000 area in the short term; if there is no major positive news, BTC may find it difficult to break through the resistance area in the short term under the current conditions, and may even experience stagflation and retreat again after approaching the resistance area.
Therefore, I think shorting BTC with the help of the resistance area is still the first choice for short-term trading. We can boldly short BTC in the 108500-109500 area and look towards the target area around 106000 again.
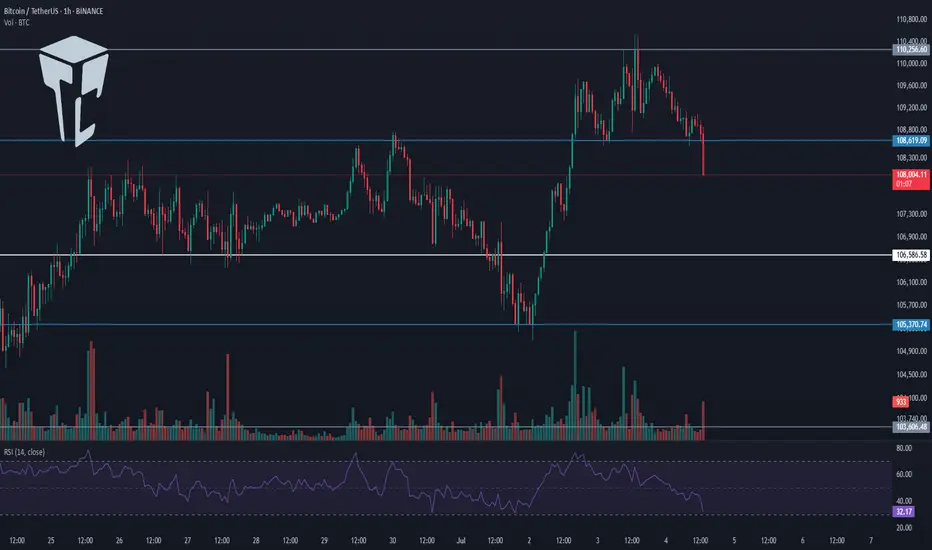
TradeCityPro | Bitcoin Daily Analysis #118👋 Welcome to TradeCity Pro!
Let’s dive into the Bitcoin analysis and key crypto indexes. As usual, in this analysis, I’ll review the futures triggers for the New York session.
⏳ 1-Hour Timeframe
On the 1-hour timeframe, the price remains within the same range box between 108619 and 110256, and it is currently sitting at the bottom of that box.
✔️ Since yesterday, market volume has significantly declined — as you can see, there's practically no real volume in the market.
⭐ On the other hand, it seems the 108619 trigger is about to be activated, and price may move downward. However, personally, as long as market volume stays this low, I prefer not to open any positions.
📊 If we see selling volume entering the market following a break below 108619, I’ll consider opening a short position. But in the current situation, as mentioned, I prefer to stay out of the market.
💥 The RSI oscillator is steadily and gradually declining like a waterfall. This is also due to the lack of volume in the market, which has led to very low price volatility.
⚡️ So for now, it's better not to rely on RSI data because without volume, RSI readings won't be useful.
📈 If the price gets supported at the 108619 level with a good buying volume and starts moving toward 110256, the chance of breaking that level will increase significantly.
👀 If that happens, I’ll personally try to open a long position once 110256 breaks. But I think today, Saturday, and Sunday will remain the same in terms of market conditions, and real volume will likely return starting next week.
👑 BTC.D Analysis
Moving on to Bitcoin Dominance, a descending trendline can be drawn here, which has been tested twice and is now being approached again.
☘️ If BTC dominance gets rejected from this trendline and moves downward, it will likely reach the 65.04 support level. If the trendline breaks, the next resistance will be 65.64.
📅 Total2 Analysis
Looking at Total2, you’ll notice it’s showing more bearishness than Bitcoin and has lost the support it formed at the 1.15 level.
💫 This happened because BTC dominance has been rising since yesterday, which means more money has been flowing into Bitcoin than into altcoins.
🔼 The next support level for Total2 is at 1.13, and a potential downside move may reach this zone. The suitable long trigger remains a break above 1.17.
📅 USDT.D Analysis
Finally, USDT Dominance has exited the range box it had formed and climbed back above the 4.78 level.
🎲 If this upward move continues, the next major resistance will be 4.90. However, if this move turns out to be fake, the short trigger for a bearish reversal will be a break below 4.72..
❌ Disclaimer ❌
Trading futures is highly risky and dangerous. If you're not an expert, these triggers may not be suitable for you. You should first learn risk and capital management. You can also use the educational content from this channel.
Finally, these triggers reflect my personal opinions on price action, and the market may move completely against this analysis. So, do your own research before opening any position.
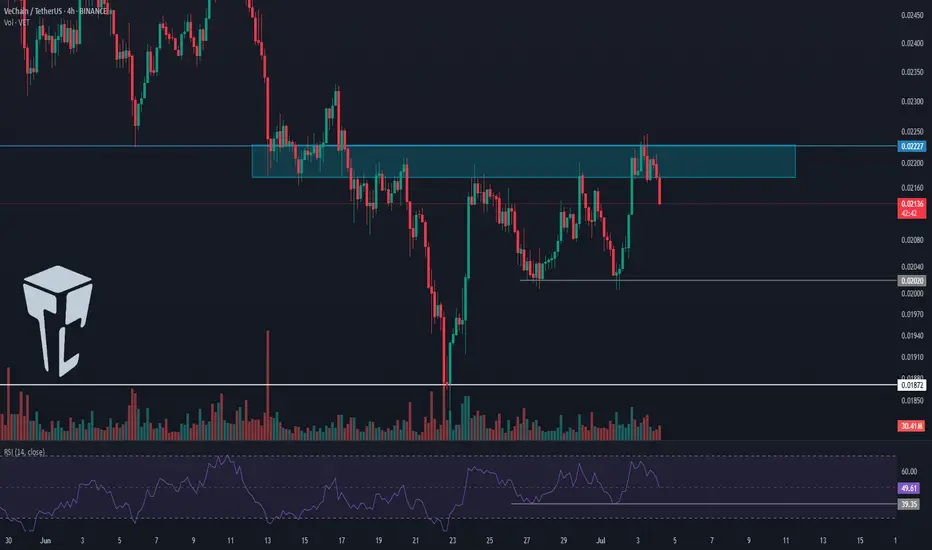
TradeCityPro | VET Battles Key Resistance Amid Buyer Momentum👋 Welcome to TradeCity Pro!
In this analysis, I’m going to review the VET coin for you. VET is a Layer1 and RWA project with a market cap of 1.84 billion dollars, currently ranked 44 on CoinMarketCap.
⏳ 4-Hour Timeframe
On the 4-hour timeframe, as you can see, this coin experienced a downtrend and eventually reached the 0.01872 bottom. It then received support from that level and began a bullish move.
✨ Right now, a significant resistance is located at 0.02227, which I’ve marked on the chart as a supply zone. So far, it seems the price has been rejected from this area.
🔍 Price has attempted to break this zone three times already. Each time, although it managed to penetrate further, it still failed to break through and got rejected.
💥 With each rejection, the RSI oscillator has also been rejected from near the 70 level and moved downward. If, in future attempts, the RSI enters the Overbuy area, the probability of breaking 0.02227 will significantly increase.
📊 Currently, market volume favors buyers. The buying volume on green candles has increased noticeably. Meanwhile, during the rejection from the resistance zone, the selling volume was very low, which signals strong buyer control.
⚡️ If the downtrend continues and price fails to form a higher low above 0.02020, we can enter a short position upon the break of 0.02020. A break of 39.35 on the RSI would be a solid momentum confirmation for this setup.
📉 The main short position can be opened upon the break of 0.01872. This would confirm the continuation of the downtrend and could lead to a sharp downward move.
📝 Final Thoughts
This analysis reflects our opinions and is not financial advice.
Share your thoughts in the comments, and don’t forget to share this analysis with your friends! ❤️
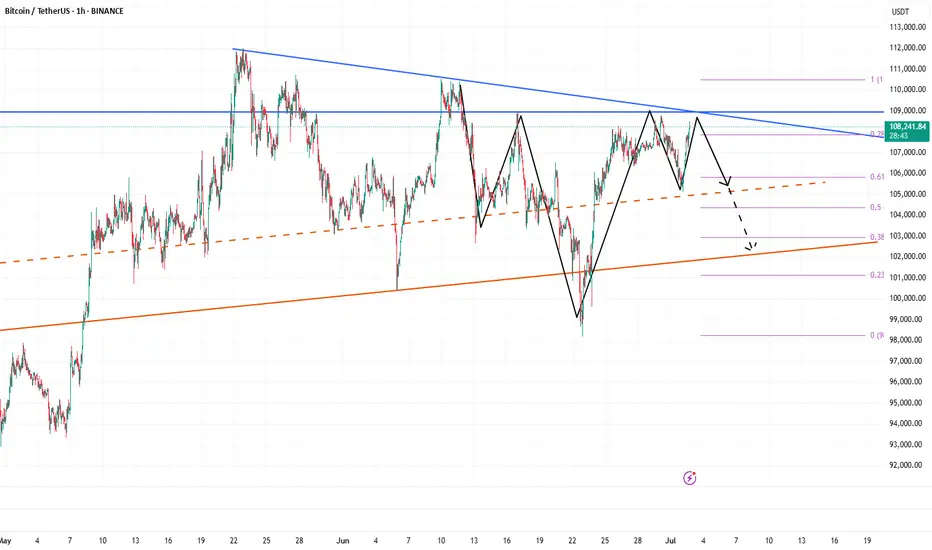
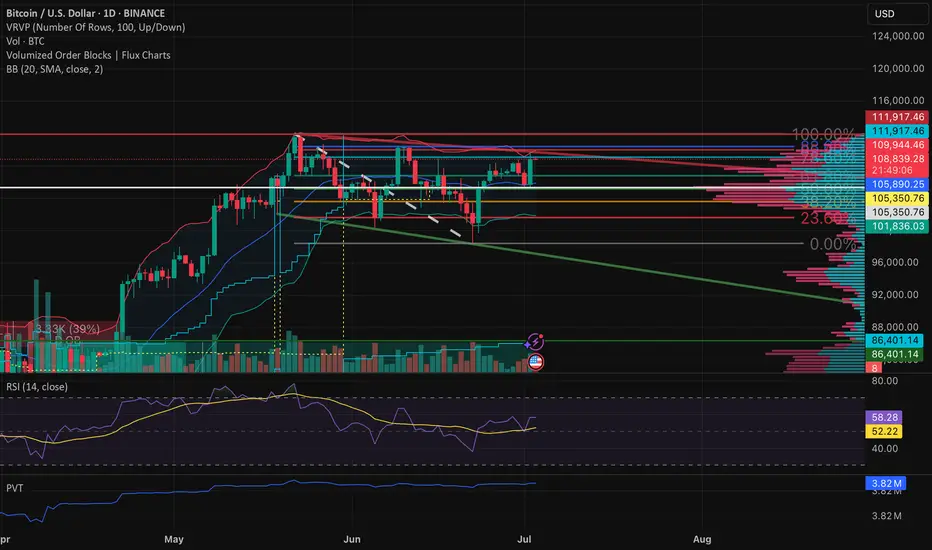
BTC – Holding or Rolling?BTC has pushed up from the late June low and is now testing the 78.6% Fibonacci retracement zone from the prior downswing. Price is currently sitting around 109.5K–110K, directly in a high-confluence rejection area. This level aligns with the top of the recent range, 78.6% retracement, Bollinger Band resistance, and the zone where the last breakdown began.
While the move resembles a double bottom or W-pattern on first glance, structure invalidates the bullish case:
The second low was lower than the first, breaking symmetry.
The second high is still lower than the June high near 111.9K.
RSI made a lower high while price made a higher high — classic momentum divergence.
Volume has not increased meaningfully on the bounce, suggesting a lack of strong buyer commitment.
Until BTC reclaims and holds above 111.9K on strong volume, this looks like a lower high inside a broader downtrend.
Short Setup Thesis
Entry Zone:
109.5K–110.5K (zone of rejection, aligned with 78.6% Fib and prior supply)
Stop Loss Zone:
Above 112K–113K (a full reclaim of prior highs would invalidate the setup)
Target Zones:
TP1: 102K–100K (local support range and prior consolidation area)
TP2: 97K–95K (Fibonacci cluster and volume shelf)
TP3: 91K–88K (structure low and potential sweep zone)
Break Trigger / Confirmation:
A daily close below 106K–105K would confirm bearish continuation. Weak retests into this zone would provide additional short entry opportunities.
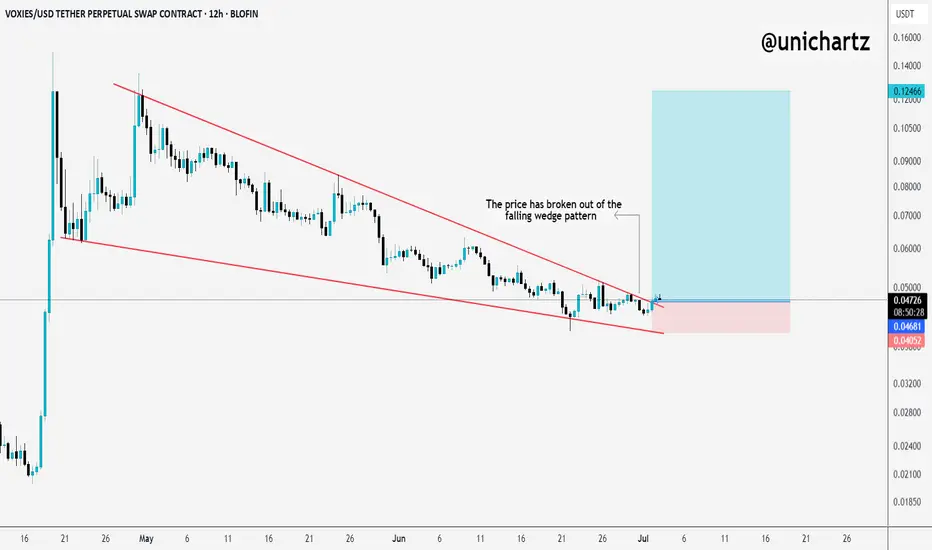
VOXIES Breakout Alert: Falling Wedge Pattern ConfirmedVOXIES has finally broken out of the falling wedge pattern, a bullish signal.
Price was getting squeezed inside this wedge for weeks, but now it’s showing signs of strength. If momentum continues, we could see a solid move toward the next resistance zone.
The breakout looks clean, and as long as it holds above the wedge, upside potential remains intact.
Keep an eye on it, this might just be the start.
DYOR, NFA
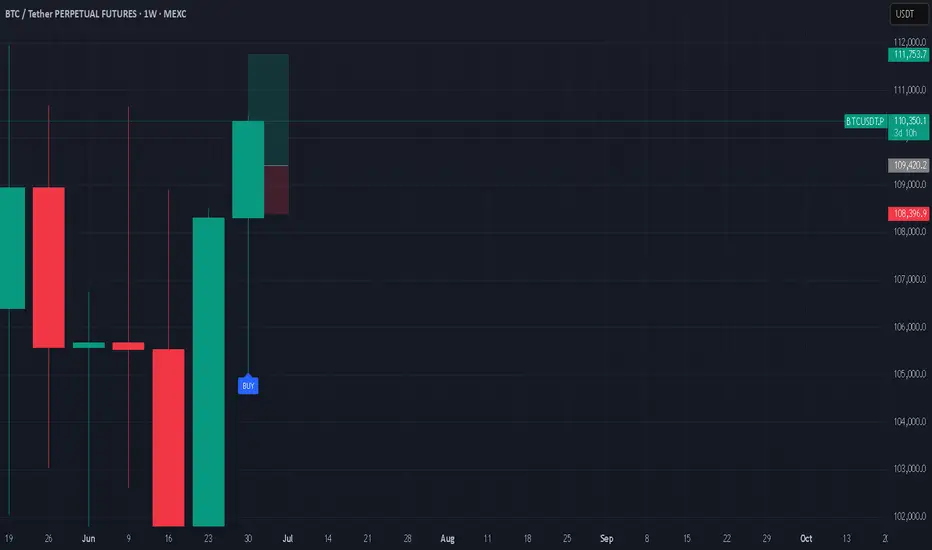
BTC: Long Position1W buy signal at $109K. Entered Long Position & currently 10 per cent in profit. BTC is going for a new ATH in the next days.
#crypto #bitcoin #trading #buysellsignals #algorithm #bot
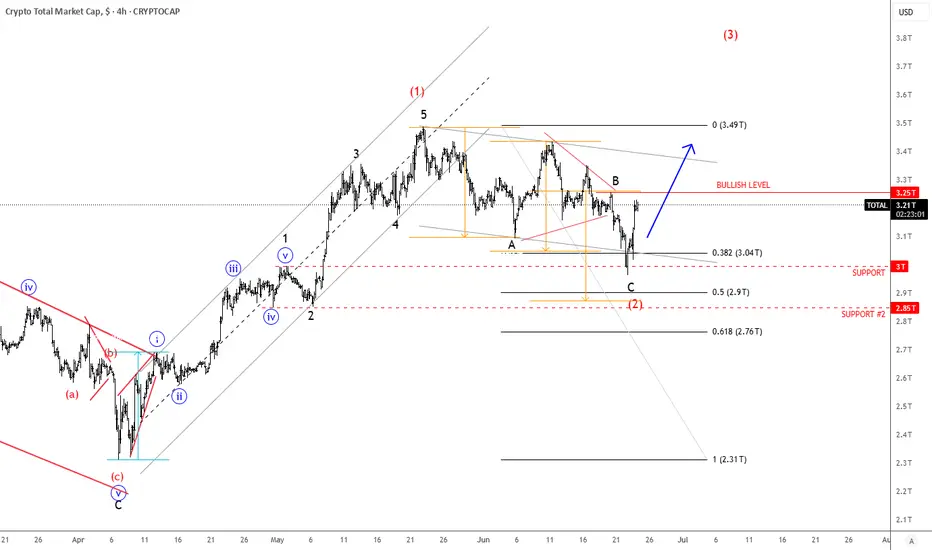
Crypto Market Completes A Correction Within Bullish TrendGood morning Crypto traders! We got a nice bounce and recovery in the Crypto market along with stock market rally after US President Donald Trump announced that Iran and Israel had agreed to a ceasefire, calling the conflict “The 12-Day War.”. Crypto TOTAL market cap chart now shows that correction is completed, support is in place and bulls back, so more upside can be seen in upcoming days/weeks, just be aware of short-term intraday pullbacks.
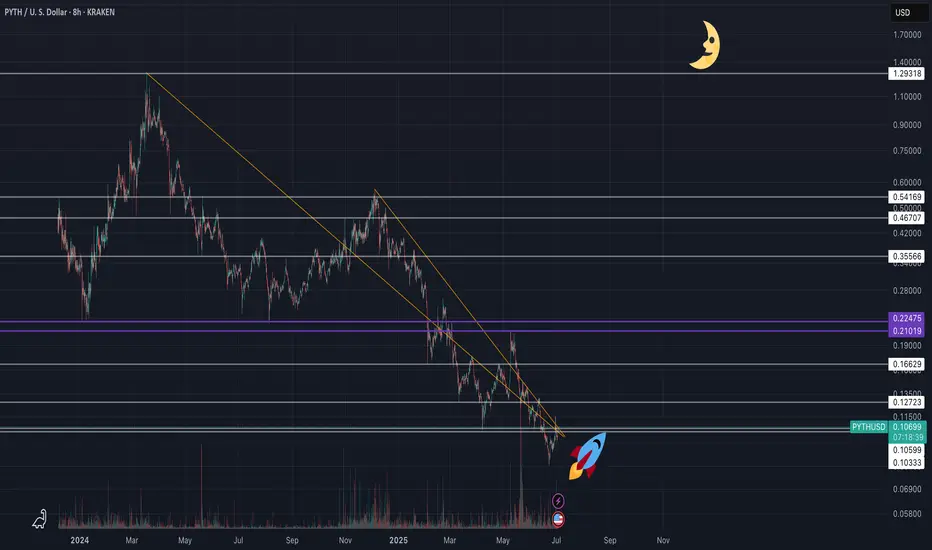
PYTH NETWORK (PYTHUSD) - (10X - 50X Potential)Pyth Network is an oracle protocol originally built for Solana, optimized for ultra-low latency and first-party data directly from exchanges and market makers. Unlike Chainlink’s node-aggregator model, Pyth enables real-time price feeds (as fast as 400ms) sourced directly from over 100 institutional providers, including Binance and Cboe.
🧩 Why Pyth?
DeFi apps need fast, accurate pricing to avoid exploits and ensure fair trading. Pyth delivers high-frequency, high-integrity data, especially valuable for derivatives, perpetuals, and high-speed DeFi protocols.
🌐 Massive Expansion
What started on Solana now powers 100+ blockchains, including Ethereum L2s, Cosmos, Sui, Aptos, TON, and more. As of 2025, over 420 protocols integrate Pyth, with over $48B+ monthly trading volume secured. It has become the #2 oracle in DeFi by usage, dominating ecosystems like Solana, Sui, and Injective.
📊 Tokenomics & Unlocks
Max supply: 10B PYTH
Circulating: ~5.75B (mid-2025)
Next major unlock: May 2026 (~2.1B tokens)
Utility: Governance, staking, publisher rewards, and oracle integrity
Pyth’s decentralized governance is growing, with a DAO now guiding key protocol parameters. It’s also expanding beyond price feeds, launching products like randomness (Entropy) and MEV mitigation tools (Express Relay).
Disclaimer: This is not financial advice. Always do your own research before making investment decisions.
TOTAL2 – Battling MA Resistance
TOTAL2 on the daily found support at the 0.382 Fib level on June 22. Since then, it has been moving upward.
Now it’s fighting the 50MA and 200MA resistance zone.
If this resistance is cleared, the 0.236 Fib level could be the next target.
Always take profits and manage risk.
Interaction is welcome.

BTC.D Daily – Bearish ShiftBTC.D on the daily is turning bearish.
PSAR has flipped bearish, and MLR < SMA < BB center — a clear sign we could see lower levels ahead.
The next possible support is the 50MA.
Always take profits and manage risk.
Interaction is welcome.

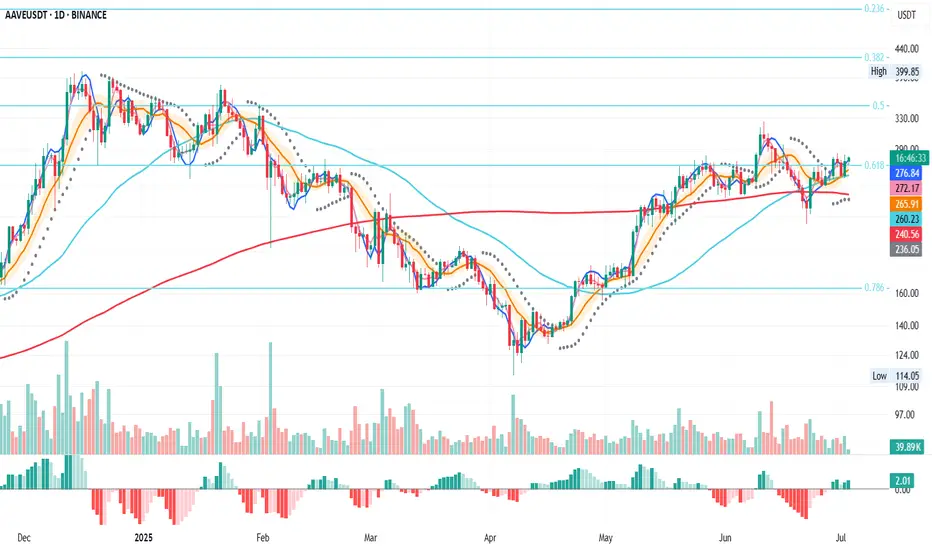
AAVE Daily – 0.618 Fib Reclaimed
AAVE on the daily has reclaimed the 0.618 Fib level after dropping below it and retesting the 200MA.
MLR > SMA > BB center — structure looks constructive.
If price holds this Fib level, there’s a good chance of targeting the 0.5 Fib around $350.
Always take profits and manage risk.
Interaction is welcome.
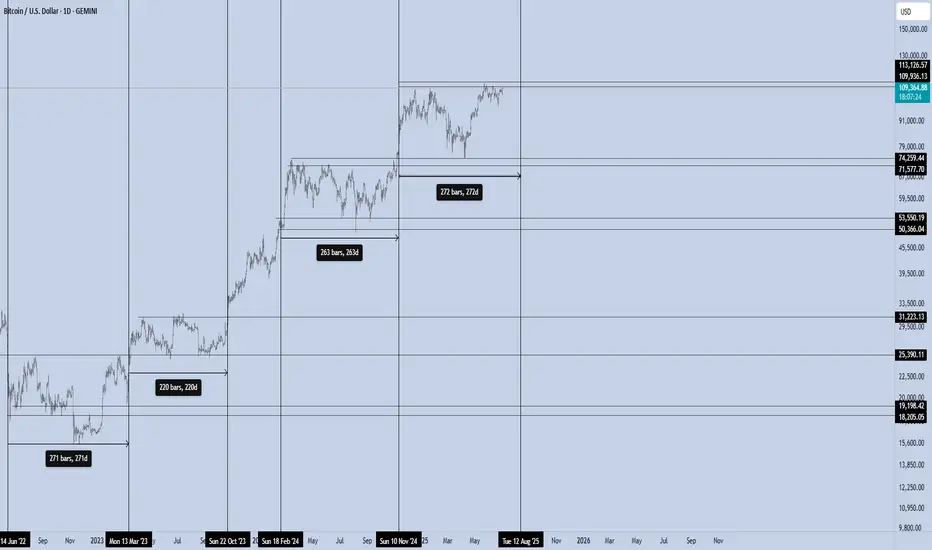
Bitcoin – The 270/100 CycleBitcoin isn’t just trading. It’s pulsing — in cycles that reward those who understand timing as much as price.
Over the last two years, BTC has shown a repeating pattern with surgical precision:
Range Phase:
Each macro consolidation lasts ~220 to 270 days, where price builds structure, absorbs supply, and prepares for its next expansion. This is the quiet phase — the zone where conviction is tested, and weak hands exit.
Impulse Phase:
What follows is a ~100-day vertical leg, where BTC surges between +50% to +80%, targeting the next macro resistance. We’ve seen this repeatedly:
Accumulate → Expand → Re-accumulate → Expand.
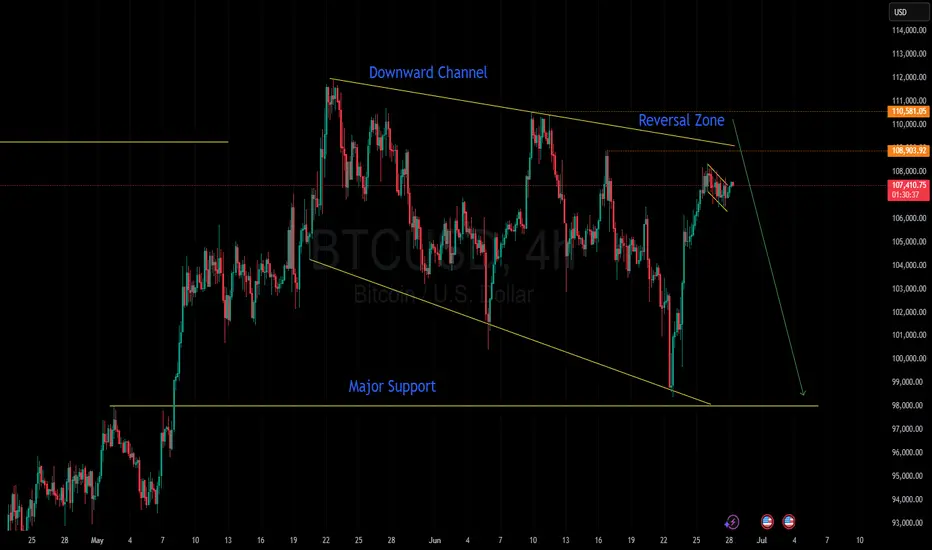
Bitcoin’s not done dropping. Selling pressure’s still on!Welcome aboard ✌️
In order for Bitcoin to climb higher, we first need a deeper correction.
Right now, price is stuck inside a channel — and it’ll take stronger momentum to break out.
🔻 So for now, I’m expecting further downside. Stick with me and don’t miss this bearish wave!
BINANCE:BTCUSD OANDA:BTCUSD
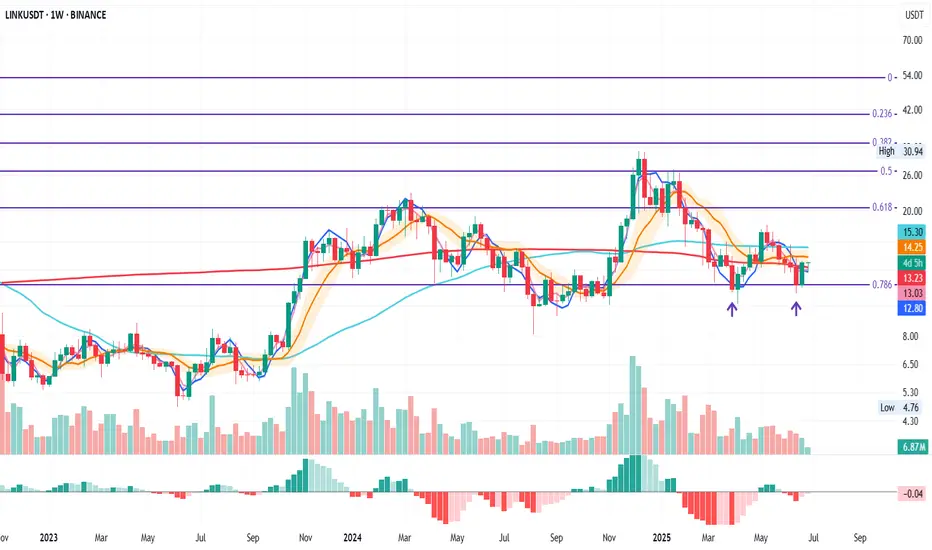
LINK Weekly – Double Bottom Confirmed
LINK on the weekly has confirmed a double bottom formation right at the 0.786 Fib level.
Remember, this Fib level is the last major support — so price is basically at bottom levels.
Last week closed above the weekly 200MA.
The next resistance zone is the BB center line and the 50MA.
If price clears this zone, it could push toward the 0.618 Fib level.
Always take profits and manage risk.
Interaction is welcome.
ETH 50MA Reclaims 0.5 FibInteresting take on ETH daily using just the 50MA and Fib levels.
Notice how the 50MA has interacted with the Fib levels since June 2021.
In May 2025, the 50MA crossed below the 0.618 Fib level, marking the bottom of the December 2024 drop.
The 0.5 Fib acted as support in October 2024 during the double top formation at the 0.236 Fib.
Now, the 50MA has crossed back above the 0.5 Fib.
As long as price holds above this 0.5 Fib level, the odds of further upside remain stronger.
Always take profits and manage risk.
Interaction is welcome.

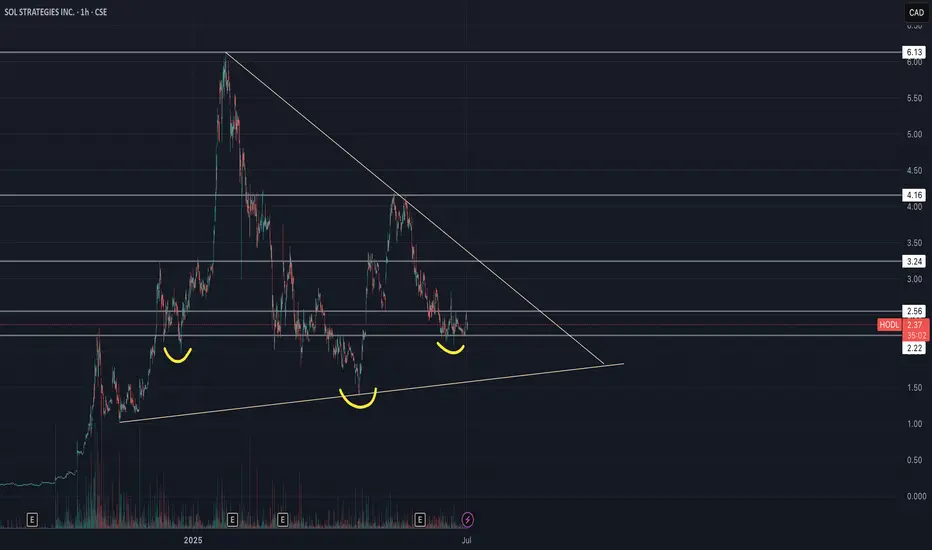
Sol Strategies Inc (HODL) - Inverse H&S🚀 SOL Strategies (HODL) – Public Market Gateway to Solana Yield
SOL Strategies (CSE: HODL) is a publicly traded company laser-focused on the Solana ecosystem. With nearly 395,000 SOL held (most of it staked) and over 3.7 million SOL delegated to their validators, they generate consistent income through staking rewards and validator commissions.
Their business model is simple:
📌 Accumulate SOL → Stake it → Run institutional-grade validators → Earn yield
📌 Expand through partnerships (3iQ, Neptune, BitGo, Pudgy Penguins)
📌 Hold strategic Solana ecosystem tokens like JTO and jitoSOL
📌 Operate with SOC 2-certified infrastructure and pursue a Nasdaq listing
SOL Strategies is not just holding crypto – they are building core infrastructure for Solana, giving equity investors direct exposure to staking economics in one of the fastest-growing blockchain networks.
📊 For traders: HODL stock offers a pure-play vehicle for Solana exposure, with an income-generating twist.
⚠️ Always do your own investment research and make your own decisions before investing.
Analysis on circle using tpo and regular chart longs and shortMust watch video giving 2 really nice Risk reward entries on the Newley listed stock Circle
In this video I highlight a region using limited data of where to get filled if you missed the IPO and want to buy some circle .
We are currently in a no trade zone for buyers as I anticipate that price will gravitate down to the .786/.886 level over time .
In this video I also use the TPO chart "Time price opportunity" and demonstrate what i am looking for from using this type of chart to add to my confluences for a high probability trade .
Also identified in the chart is a short trade off of the weekly pivots and the value area high of the range .
Thankyou for watching and i welcome any questions
