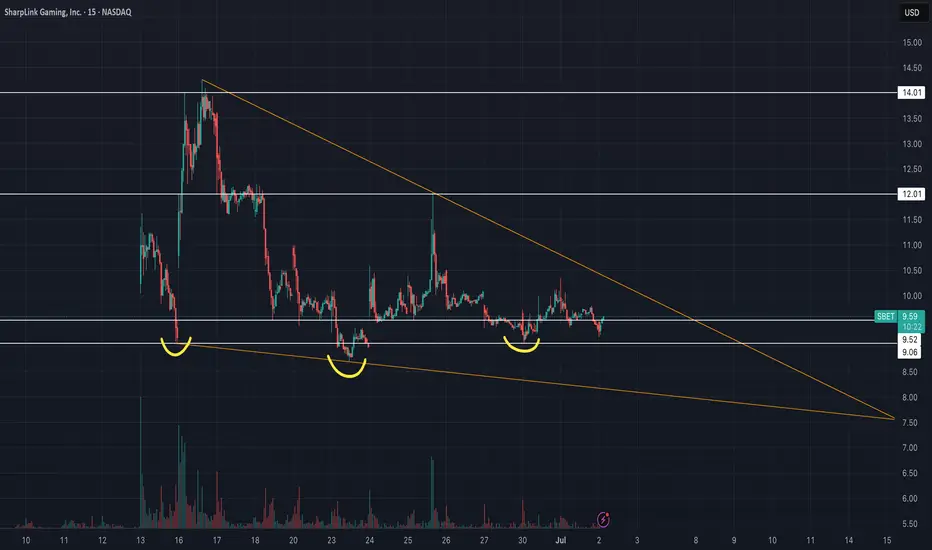
SharpLink Gaming Inc (SBET) - Falling Wedge & Inverse H&S🚀 SharpLink Gaming ( NASDAQ:SBET ) – Ethereum, Joe Lubin & a Bullish Setup
SharpLink Gaming has undergone a bold transformation: the company is now the largest public holder of Ethereum (ETH), with ~198,000 ETH acquired since June 2025. Over 95% of it is staked, already earning 200+ ETH in rewards – turning ETH into a yield-bearing treasury asset.
Driving this shift is Joe Lubin, co-founder of Ethereum and CEO of ConsenSys, who recently became Chairman of SharpLink. Under his leadership, SBET is betting big on Ethereum as “digital capital”, aiming to merge iGaming and Web3.
📊 Technical Setup:
SBET is forming a falling wedge and an inverse head and shoulders – both classic bullish reversal patterns. After a post-announcement retracement, the chart suggests growing potential for a breakout as fundamentals strengthen.
🧠 My thesis: This is MicroStrategy playbook 2.0 – but with ETH instead of BTC. SharpLink gives equity exposure to Ethereum + staking yield + visionary leadership.
🔔 Worth watching closely.
⚠️ Always do your own investment research and make your own decisions before investing.
Cryptomarket
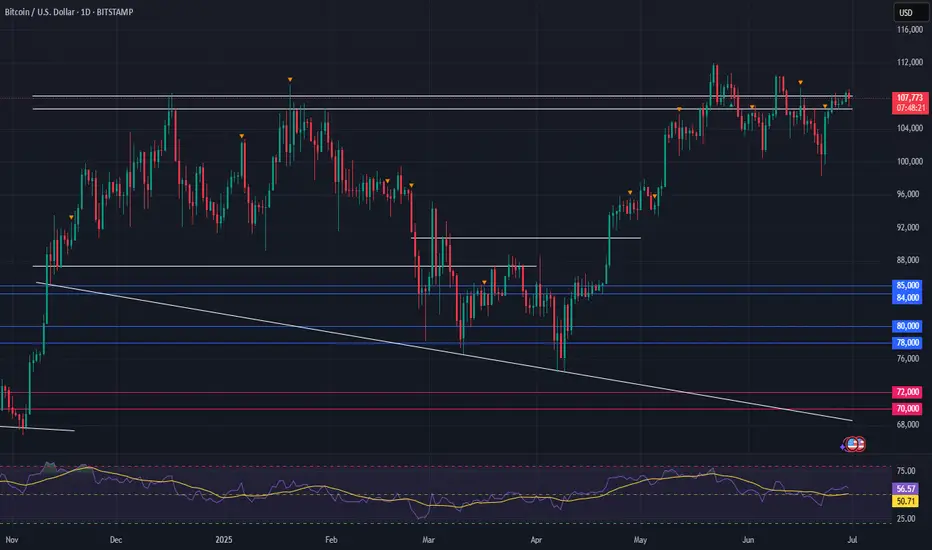
Bitcoin Set to Break All-Time High: Market Consensus Is BullishAs we enter the second half of 2025, Bitcoin (BTC) is on the verge of breaking its all-time high (ATH), with analysts, institutional investors, and market data all pointing toward an imminent surge. The convergence of technical strength, robust institutional inflows, and favorable macro trends is fueling widespread optimism that BTC will soon surpass its previous records.
Key Drivers Behind Bitcoin’s Imminent ATH Breakout
Institutional Investment & ETF Approvals:
The surge in institutional interest, highlighted by record inflows into Bitcoin ETFs and major asset managers ramping up exposure, is a pivotal force behind BTC’s upward momentum. Recent ETF approvals and growing allocations by corporate treasuries are reshaping the liquidity landscape and boosting confidence in Bitcoin as a mainstream asset.
Technical Indicators & Market Structure:
Bitcoin’s price action is consolidating near critical resistance levels ($107,000–$109,000), with technical analysts identifying bullish formations such as the inverted head-and-shoulders pattern. A decisive move above $109,000 is expected to trigger a rapid ascent to new highs, with targets ranging from $112,000 in the short term to as high as $135,000–$200,000 by year-end, according to leading forecasters.
Historical Cycles & Macro Trends:
Unlike previous halving cycles, where corrections followed price spikes, this cycle is marked by sustained demand from ETFs and corporate buyers. Standard Chartered and other major institutions now project BTC to reach $135,000 in Q3 and potentially $200,000 by late 2025, citing a fundamental shift in market dynamics
BUT...A drop to 90k is considered possible before the rally.
#crypto #bitcoin #portfolio #analysis
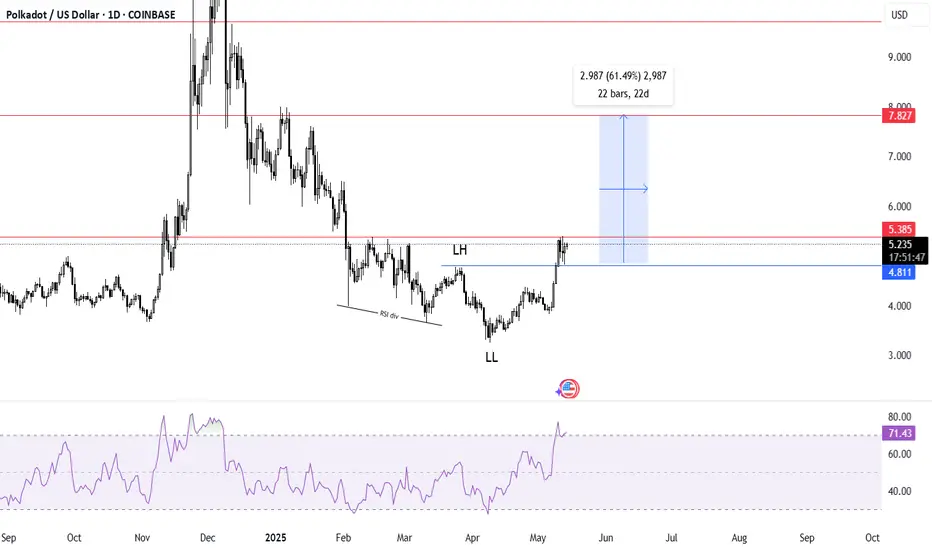
Dot have potential to catch move like EthereumBullish trend making HH may go down for HL
Rsi divergence
Reversal pattern falling wedge
Manage your risk before entering position in real account.
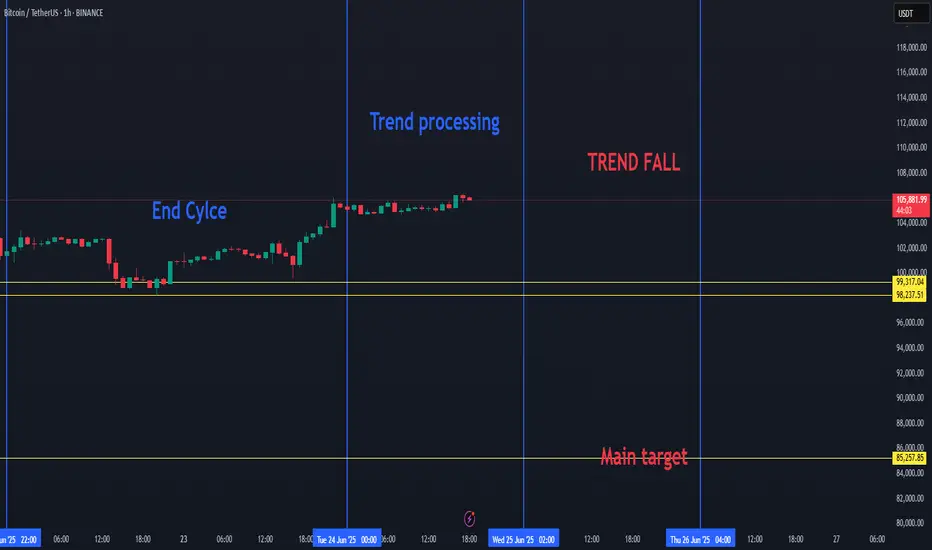
BTC HIGH DATA SHOW BREAKDOWN TO 85K FOR BITCOIN SOON.Bitcoin Market Update
BTC SEEMS TO ENTER A NEW CORRECTION PHASE SOON.
Recent data suggests that the current Bitcoin (BTC) cycle is coming to an end. As a result, we may soon see a downward move in BTC's price. The key target in this potential drop is around $85,000, with expectations that BTC will fall below $100,000.
This week, Bitcoin completed its cycle trend and is now entering a processing or transitional phase. Once this phase ends, we anticipate another decline in price.
This outlook is based on recurring patterns seen in previous BTC cycles, which have shown similar behavior in the past.
BTC can play on the low time frame with uptrends and downtrends, but if we will choice a side, then it will be the red trend.. since BTC cycle is ending.
Ethereum - This structure decides everything!Ethereum - CRYPTO:ETHUSD - trades at a key structure:
(click chart above to see the in depth analysis👆🏻)
After Ethereum retested the previous all time high in the end of 2024, we saw quite a harsh move lower. This move was followed by an expected recovery, however Ethereum is still trading below a key structure. Either move is still possible and will shape the future of Ethereum.
Levels to watch: $2.500, $4.000
Keep your long term vision!
Philip (BasicTrading)

Bitcoin (BTC/USDT) – 4H Analysis UpdateBTC is currently holding above the key resistance-turned-support zone of $106,057, after a clean breakout from the symmetrical triangle last week. Price is consolidating just below $107,000, signaling a potential pause or minor pullback before the next leg.
Technical Overview:
Trendline support from May is intact
$106K zone flipped into support — critical for bulls to hold
Price action is compressing under resistance at $107,000
Holding here may lead to a retest of $108,895, then $111,785
Key Levels to Watch:
Support:
$106,057 – Immediate support
$101,409 – Mid-range demand zone
$98,898 – Rising trendline
$93,343 – Strong base zone
Resistance:
$107,000 – Minor resistance
$108,895 – Major resistance
$111,785 – Upper breakout target
Outlook:
Bulls need to defend the $106K zone to maintain momentum. Failure to do so could cause the price to pull back toward $101K. On the flip side, strong volume above $108900 may trigger a rally toward $111K+.
DYOR | Not Financial Advice

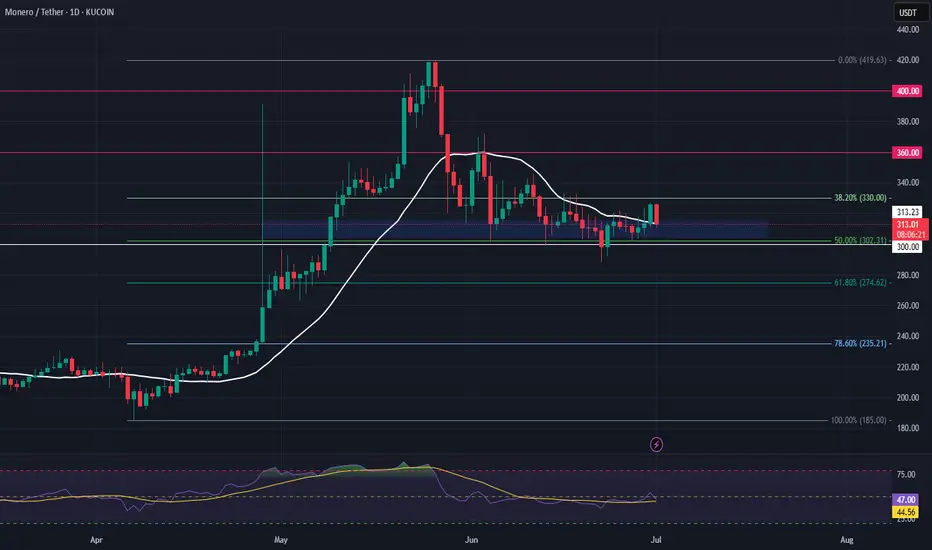
XMR Long Swing Setup – 50% Retrace with Structure ShiftXMR rallied from $200 to $400 and has now pulled back 50% of that move. With price reclaiming the 20-day SMA and a recent structure shift, there’s a solid setup forming with ~60% probability of continuation.
📌 Trade Setup:
• Entry Zone: $305 – $315
• Take Profit Targets:
o 🥇 $360
o 🥈 $400
• Stop Loss: Daily close below $300
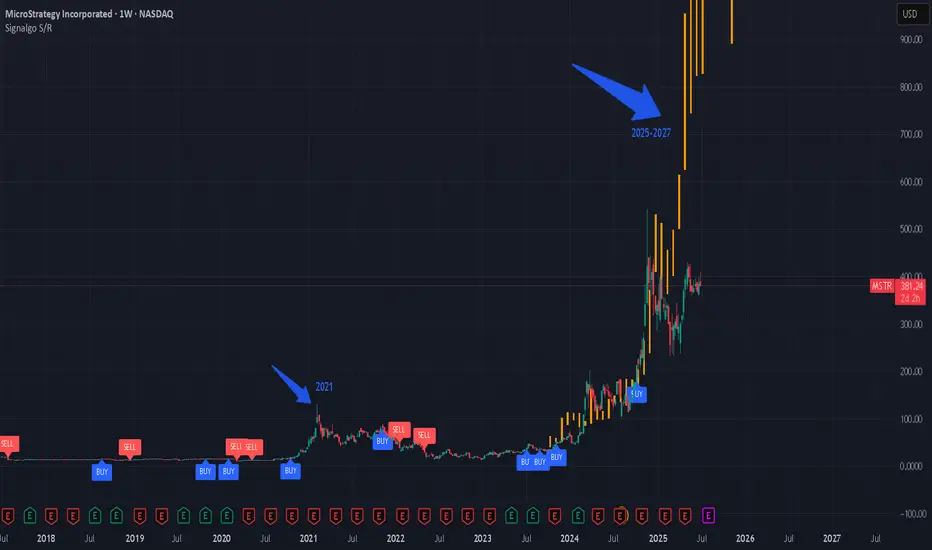
Crypto Stocks to the moon?NASDAQ:MSTR , along with numerous other publicly traded companies with significant cryptocurrency exposure, experienced a remarkable rally during the previous crypto bull market. There are indications that a similar dynamic could be emerging once again.
#bitcoin #crypto #stocks #stockmarket #portfolio
BITCOIN - under resistance since 2011-Birth of a new cycle soon
The Chart Clearly explains itself
Since before Bitcoin PA went into its current channel, it was under a Huge Arc that resisted any move higher...strongly, Every single ATH, Every one, even the most recent
This is Easily seen by the Blue Arc
And as you can see, maybe THIS is the real reason why PA is struggling to break higher....It just cannot break over that Arc.
The main chart is Monthly, Lets look at the weekly.
You can clearly see what happened in 2021, rejected twice and again this cycle.
And you can see how, by December This year, 2025, PA will be squeezed very tight.
And PA usually moves before the APEX>
And, if we are going to repeat the previous cycle moves, the 1st year after a New ATH usually sees a decline in price, as can be seen by the red boxes.
But PA needs to break OVER that Arc first. and then remain ABOVE IT.
This would then create a new cycle pattern.
And we need it.
Currently, we can go back to Lows of 88K before we loose support on that lower trendline but from there, we need to break over.
A Strong move in SEPTEMBER / OCTOBER would be Ideal
Just saying

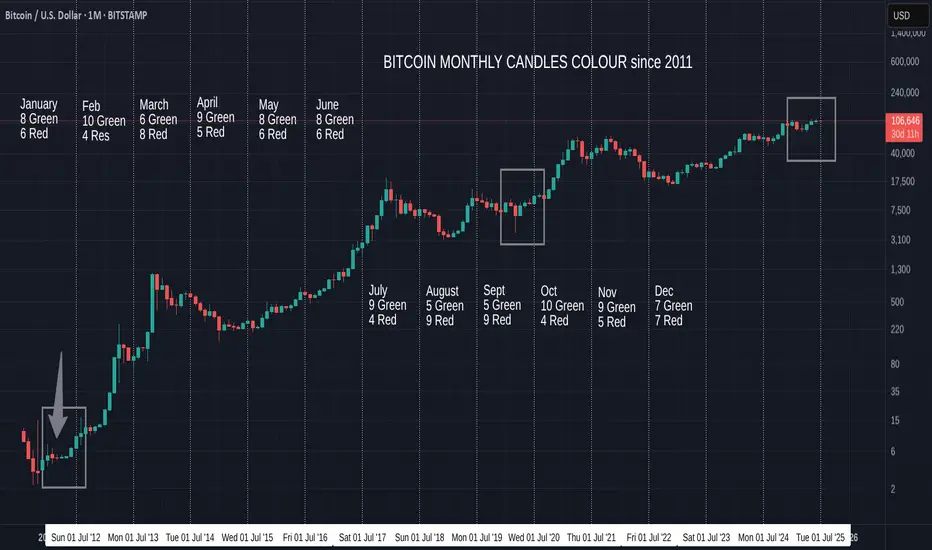
Bitcoin Monthly Candle Close colour and patterns since 2011
At the beginning of June , I wrote this
""On only 2 occasions have we had a GREEN JAN, RED FEB, RED MARCH, GREEN APRIL
And Both of them were on the way to ATH. (Boxes )
On both those occasions we also had a GREEN MAY, though the gains were minimal and one was followed by a Green June and the other by a Red June."
We just got the GREEN June and so this draws my eye to the sequence on the left, ( arrow )
If we are to follow this, then July should be a larger Green (Arrow) - BULLISH
In-fact, in both the sequences we have been following ( boxes), July was GREEN- BULLISH
And using just the month candle colours, we have a higher chance of another Green candle, with July having had 9 Green to 4 Red previously. - BULLISH
However
Of the previous 8 Green June Closes , only 3 went to a Green July - BEARISH
And I have to say, on NONE of the previous Green Junes were we so close to the current ATH.
July 2021 being the closest with a price at 41K, around 18K below the current ATH at the time.
We are currently only around 200 usd below Current ATH
This adds enormous resistance to the ability to rise
I wanted a RED June because I felt it was more sustainable and would lead to a cycle ATH at the end of the year. As can be seen in the middle Box
If we look back toward the 2012 Box on the left, we may now get a Hot July / August , September and then a Cool off for October, November & December.
But something tells me this will not happen.
The Candles for our current cycle in April, May and June are diminishing in size, the opposite of 2012
But they are similar to the 2020 box, except for the red June close.
This could lead to the desired "Cooling" in August & September and a new lift off in autumn.
And if you look at the chart Candle Colour Count, , August and September are usually RED by some majority
This also gives us the Bigger Green July candle that the "Odds" point towards.
So, as ever, we have to wait and see how this plays out.
Odds in favour of a Green July using previous cycle Data
PA position just below current ATH could lead to a slightly Bearish out look in the short term.
And if you are hoping to see ALTS Rally, PLEASE keep your eye on the BTC.D chart
This also points to wards BTC ATH in Q4 this year
And then, we have the BIG question.......Will we ever see a Classix Bear again ?
With so many Holding Bitcoin LongTerm.....How would a Bear market arrive ?
BUY BITCOIN
HOLD BITCOIN
But, as ever, we just have to wait and see,
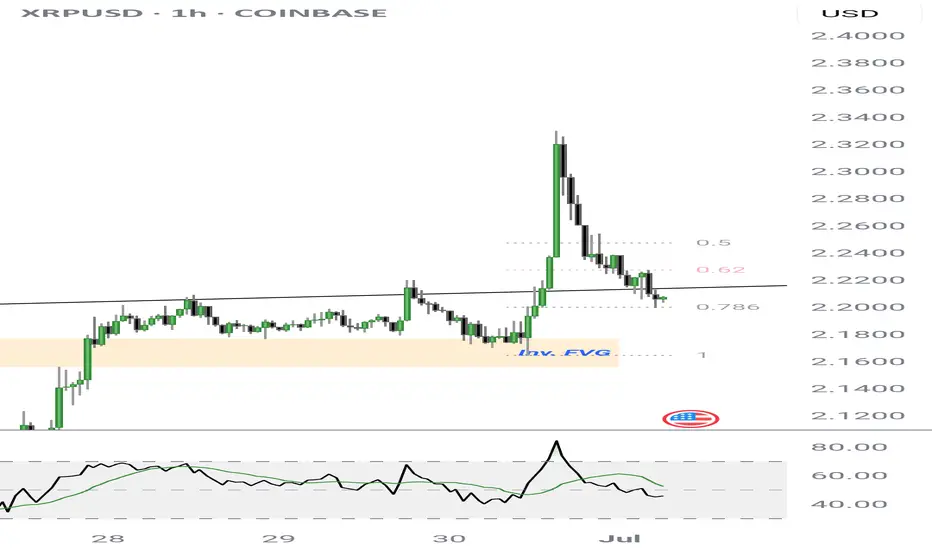
XRP - calm before the stormWe've got our bullish reversal sitting at the Golden Ratio price of $2.20. Fed Chairman Jerome Powell speaks today with many speculating that this will be the meeting that sends the markets soaring.
With over 17 ETFs, SWIFT update, Banks offering crypto services, BIS, XRPL EVM side chain, and many more catalyst. This could be the beginning to the largest bull run witnessed in our lifetime.
Have profits targets, an exit strategy, and plan for long-term reinvestments that will continue to make you money.
LOCK IN 🔐
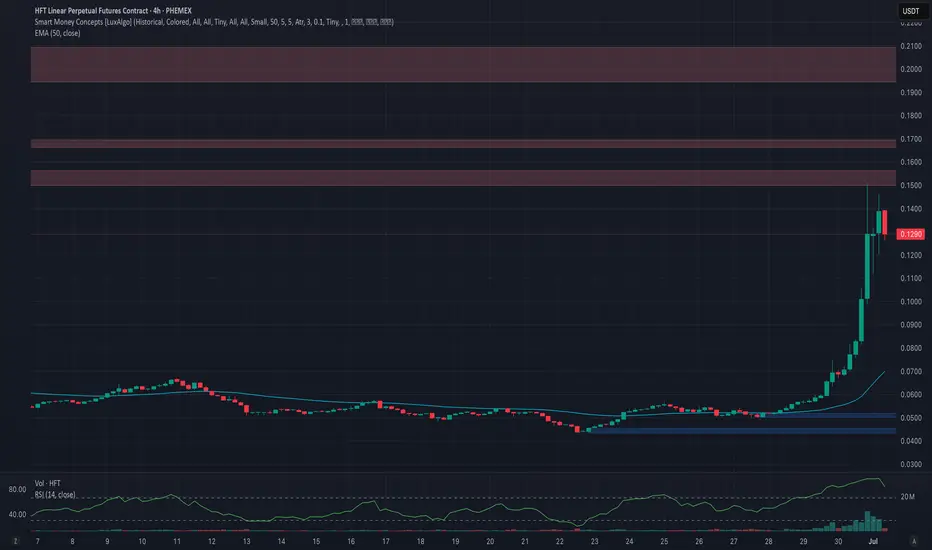
Phemex Analysis #93: Is it Time to Enter Hashflow (HFT)?Hashflow ( PHEMEX:HFTUSDT.P ) is a decentralized trading protocol designed to facilitate seamless, secure cross-chain asset swaps with zero slippage and protection against MEV (Maximal Extractable Value) exploits. Unlike traditional decentralized exchanges, Hashflow enables users to trade across various blockchains without relying on external bridges or synthetic assets. Trades execute precisely at the quoted price without hidden commissions, enhancing transparency and efficiency.
Recently, HFT experienced an impressive bullish rally, surging approximately 190% within 48 hours, currently stabilizing around the $0.12 mark. This rapid appreciation naturally raises questions among traders: is now the ideal entry point, or is caution warranted following such sharp movements? To assist traders in making informed decisions, let's examine a few potential scenarios closely.
Possible Scenarios
1. Bullish Continuation (Positive Scenario)
Currently, the HFT price faces significant resistance around $0.15. A bullish continuation scenario involves HFT consolidating briefly above the $0.10 support area, gathering strength before making another attempt at breaking through the critical $0.15 resistance.
Pro Tips:
Entry Strategy: Consider carefully entering positions only after a confirmed breakout above the resistance at $0.15, accompanied by strong volume.
Profit-Taking Targets: Short-term profit-taking levels to monitor closely are at $0.156, $0.17, and $0.21.
Risk Management: Implement a clear stop-loss strategy slightly below the $0.10 area to mitigate potential downside risk.
2. The Hype Is Over (Bearish Scenario)
Given the broader market consolidation, there's a realistic risk that recent bullish momentum may fade quickly. If the price falls decisively below the $0.10 support, this scenario could trigger further declines towards key support levels such as $0.067, or even back down to $0.05.
Pro Tips:
Stay Cautious: Traders should remain on the sidelines if prices fall below $0.10 with increased selling volume, as it could indicate a broader sell-off.
Long-Term Accumulation: For long-term investors interested in HFT, wait patiently for price stabilization at or near support areas ($0.067 and $0.05) before gradually accumulating positions.
3. Consolidation between $0.10–$0.15 (Neutral Scenario)
A third possibility involves HFT price remaining range-bound, consolidating between the immediate support at $0.10 and resistance at $0.15. Such consolidation would represent market indecision as traders and investors await further market cues.
Pro Tips:
Range Trading: Employ range-trading techniques to profit from short-term price fluctuations between these clearly defined boundaries.
Observe Breakout Signals: Closely watch volume patterns, as increased volume accompanying a breakout from either end of the range could signify the next significant directional move.
Conclusion
Hashflow (HFT) has recently demonstrated significant volatility, creating multiple opportunities and risks for traders. By closely monitoring the outlined scenarios—particularly the critical levels of $0.10 and $0.15—and employing strategic risk management, traders can confidently position themselves to optimize potential returns. Always prioritize clear confirmation of market signals and adapt your strategies according to the unfolding price action.
🔥 Tips:
Armed Your Trading Arsenal with advanced tools like multiple watchlists, basket orders, and real-time strategy adjustments at Phemex. Our USDT-based scaled orders give you precise control over your risk, while iceberg orders provide stealthy execution.
Disclaimer: This is NOT financial or investment advice. Please conduct your own research (DYOR). Phemex is not responsible, directly or indirectly, for any damage or loss incurred or claimed to be caused by or in association with the use of or reliance on any content, goods, or services mentioned in this article.
Quantitative Trading Models in Forex: A Deep DiveQuantitative Trading Models in Forex: A Deep Dive
Quantitative trading in forex harnesses advanced algorithms and statistical models to decode market dynamics, offering traders a sophisticated approach to currency trading. This article delves into the various quantitative trading models, their implementation, and their challenges, providing insights for traders looking to navigate the forex market with a data-driven approach.
Understanding Quantitative Trading in Forex
Quantitative trading, also known as quant trading, in the forex market involves using sophisticated quantitative trading systems that leverage complex mathematical and statistical methods to analyse market data and execute trades. These systems are designed to identify patterns, trends, and potential opportunities in currency movements that might be invisible to the naked eye.
At the heart of these systems are quantitative trading strategies and models, which are algorithmic procedures developed to determine market behaviour and make informed decisions. These strategies incorporate a variety of approaches, from historical data analysis to predictive modelling, which should ensure a comprehensive assessment of market dynamics. Notably, in quantitative trading, Python and similar data-oriented programming languages are often used to build models.
In essence, quantitative systems help decipher the intricate relationships between different currency pairs, economic indicators, and global events, potentially enabling traders to execute trades with higher precision and efficiency.
Key Types of Quantitative Models
Quantitative trading, spanning diverse markets such as forex, stocks, and cryptocurrencies*, utilises complex quantitative trading algorithms to make informed decisions. While it's prominently applied in quantitative stock trading, its principles and models are particularly significant in the forex market. These models are underpinned by quantitative analysis, derivative modelling, and trading strategies, which involve mathematical analysis of market movements and risk assessment to potentially optimise trading outcomes.
Trend Following Models
Trend-following systems are designed to identify and capitalise on market trends. Using historical price data, they may determine the direction and strength of market movements, helping traders to align themselves with the prevailing upward or downward trend. Indicators like the Average Directional Index or Parabolic SAR can assist in developing trend-following models.
Mean Reversion Models
Operating on the principle that prices eventually move back towards their mean or average, mean reversion systems look for overextended price movements in the forex market. Traders use mean reversion strategies to determine when a currency pair is likely to revert to its historical average.
High-Frequency Trading (HFT) Models
Involving the execution of a large number of orders at breakneck speeds, HFT models are used to capitalise on tiny price movements. They’re less about determining market direction and more about exploiting market inefficiencies at micro-level time frames.
Sentiment Analysis Models
These models analyse market sentiment data, such as news headlines, social media buzz, and economic reports, to gauge the market's mood. This information can be pivotal in defining short-term movements in the forex market, though this model is becoming increasingly popular for quantitative trading in crypto*.
Machine Learning Models
These systems continuously learn and adapt to new market data by incorporating AI and machine learning, identifying complex patterns and relationships that might elude traditional models. They are particularly adept at processing large volumes of data and making predictive analyses.
Hypothesis-Based Models
These models test specific hypotheses about market behaviour. For example, a theory might posit that certain economic indicators lead to predictable responses in currency markets. They’re then backtested and refined based on historical data to validate or refute the hypotheses.
Each model offers a unique lens through which forex traders can analyse the market, offering diverse approaches to tackle the complexities of currency trading.
Quantitative vs Algorithmic Trading
While quant and algorithmic trading are often used interchangeably and do overlap, there are notable differences between the two approaches.
Algorithmic Trading
Focus: Emphasises automating processes, often using technical indicators for decision-making.
Methodology: Relies on predefined rules based on historical data, often without the depth of quantitative analysis.
Execution: Prioritises automated execution of trades, often at high speed.
Application: Used widely for efficiency in executing repetitive, rule-based tasks.
Quantitative Trading
Focus: Utilises advanced mathematical and statistical models to determine market movements.
Methodology: Involves complex computations and data analysis and often incorporates economic theories.
Execution: May or may not automate trade execution; focuses on strategy formulation.
Application: Common in risk management and strategic trade planning.
Implementation and Challenges
Implementing quantitative models in forex begins with the development of a robust strategy involving the selection of appropriate models and algorithms. This phase includes rigorous backtesting against historical data to validate their effectiveness. Following this, traders often engage in forward testing in live market conditions to evaluate real-world performance.
Challenges in this realm are multifaceted. Key among them is the quality and relevance of the data used. Models can be rendered ineffective if based on inaccurate or outdated data. Overfitting remains a significant concern, where systems too closely tailored to historical data may fail to adapt to evolving market dynamics. Another challenge is the constant need to monitor and update models to keep pace with market changes, requiring a blend of technical expertise and market acumen.
The Bottom Line
In this deep dive into quantitative trading in forex, we've uncovered the potency of diverse models, each tailored to navigate the complex currency markets with precision. These strategies, rooted in data-driven analysis, may offer traders an edge in decision-making.
*Important: At FXOpen UK, Cryptocurrency trading via CFDs is only available to our Professional clients. They are not available for trading by Retail clients. To find out more information about how this may affect you, please get in touch with our team.
This article represents the opinion of the Companies operating under the FXOpen brand only. It is not to be construed as an offer, solicitation, or recommendation with respect to products and services provided by the Companies operating under the FXOpen brand, nor is it to be considered financial advice.
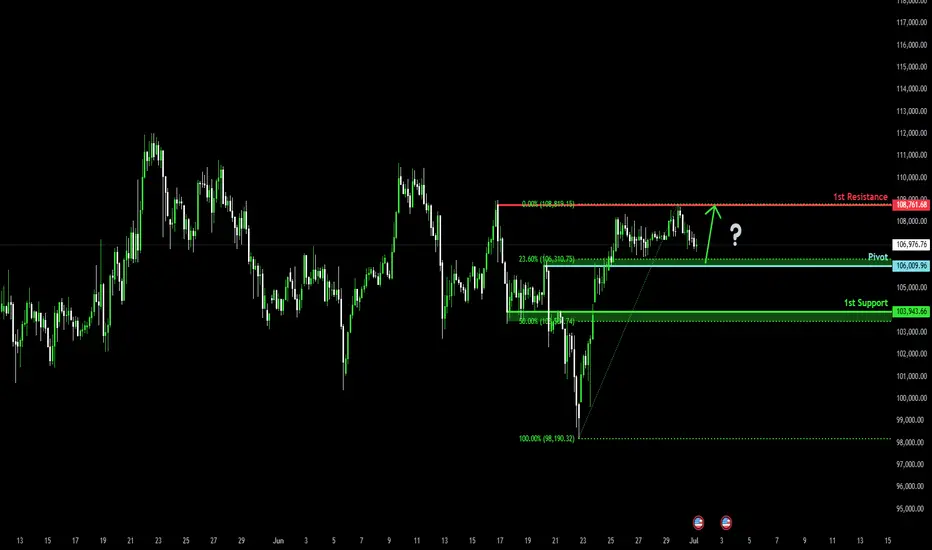
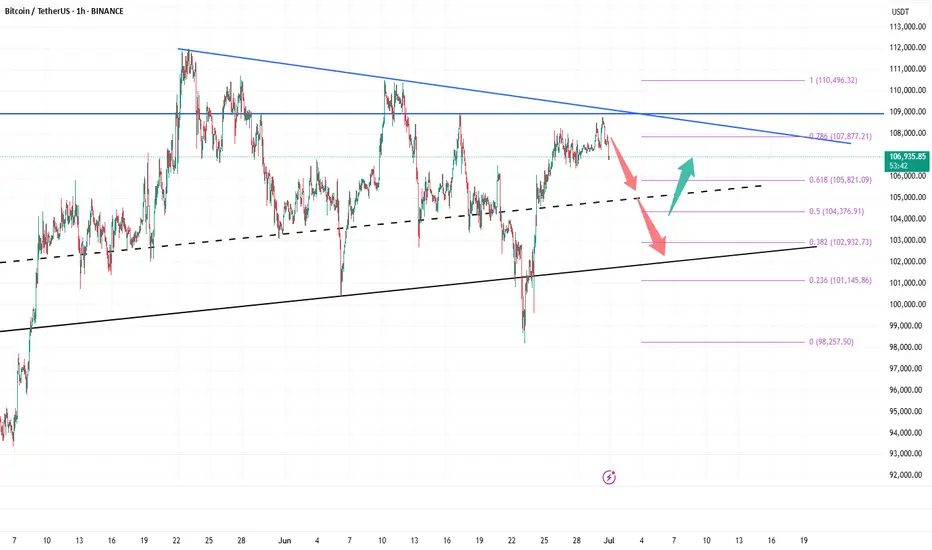
Bullish bounce?The Bitcoin (BTC/USD) is falling towards the pivot which acts as a pullback support and could bounce to the 1st resistance.
Pivot: 106,009.96
1st Support: 103.943.66
1st Resistance: 108,761.68
Risk Warning:
Trading Forex and CFDs carries a high level of risk to your capital and you should only trade with money you can afford to lose. Trading Forex and CFDs may not be suitable for all investors, so please ensure that you fully understand the risks involved and seek independent advice if necessary.
Disclaimer:
The above opinions given constitute general market commentary, and do not constitute the opinion or advice of IC Markets or any form of personal or investment advice.
Any opinions, news, research, analyses, prices, other information, or links to third-party sites contained on this website are provided on an "as-is" basis, are intended only to be informative, is not an advice nor a recommendation, nor research, or a record of our trading prices, or an offer of, or solicitation for a transaction in any financial instrument and thus should not be treated as such. The information provided does not involve any specific investment objectives, financial situation and needs of any specific person who may receive it. Please be aware, that past performance is not a reliable indicator of future performance and/or results. Past Performance or Forward-looking scenarios based upon the reasonable beliefs of the third-party provider are not a guarantee of future performance. Actual results may differ materially from those anticipated in forward-looking or past performance statements. IC Markets makes no representation or warranty and assumes no liability as to the accuracy or completeness of the information provided, nor any loss arising from any investment based on a recommendation, forecast or any information supplied by any third-party.
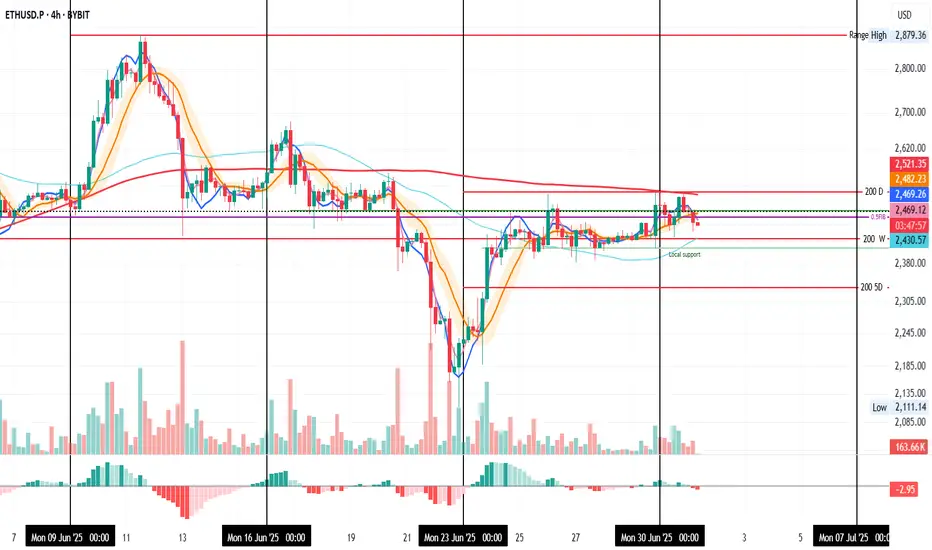
ETH Pushed Back, Support in Sight
ETH on the 4H just closed below the last daily close and the 0.5 Fib again, after getting pushed back from the 4H 200MA and daily 200MA resistance zone.
The next key supports are the weekly 200MA and the local support zone.
Also worth noting: Trump and Musk are stirring things up again. The last time this dynamic appeared, it triggered a selloff a few weeks ago, even before the conflict began.
Always take profits and manage risk.
Interaction is welcome.
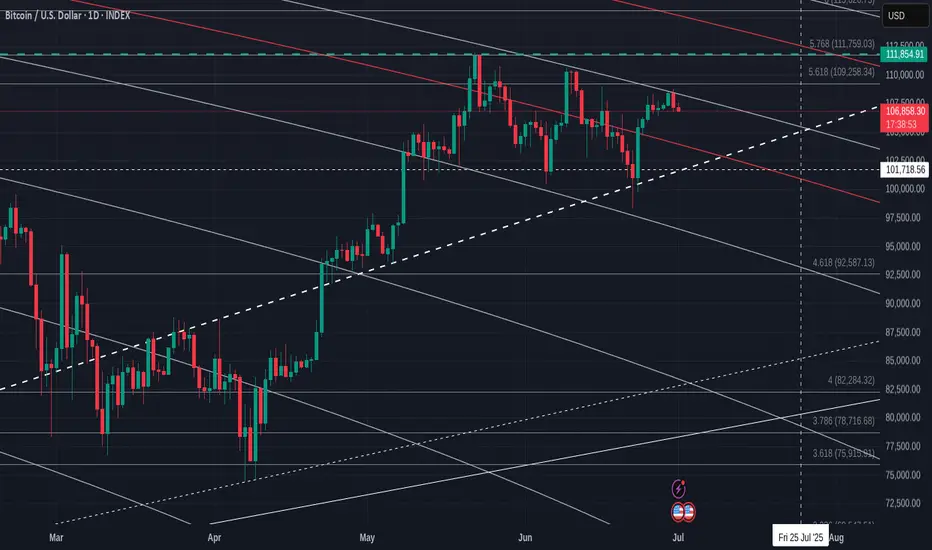
Bitcoin Daily in a large pennant with apex end of July
Bitcoin is once again getting rejected off the Fib circle just above.
This is also just under a 618 Fib extension and so a combined rejection zone.
Beneath this, we have support on that Bold dashed line. This is a Local line of supprt but has strength.
And so, we find outselves in apennant again and that apex is around 22 July.
PA tracts before the apex.
As will be explained in the monthly chart I iwll post later, this all points towards a Calm July, possibly RED month.
PA does however, have the ability and strength to push higher if the Bulls decide to make a move.
The MACD
The Daily MACD is just above Neutral and has enough room to move.
So, if we drop, support is arouns 103K
If we loose that then 100K and then we land on that red 236 Fib circle that will offer a sliding line of support.
But I do not think we will get there just yet
Enjoy
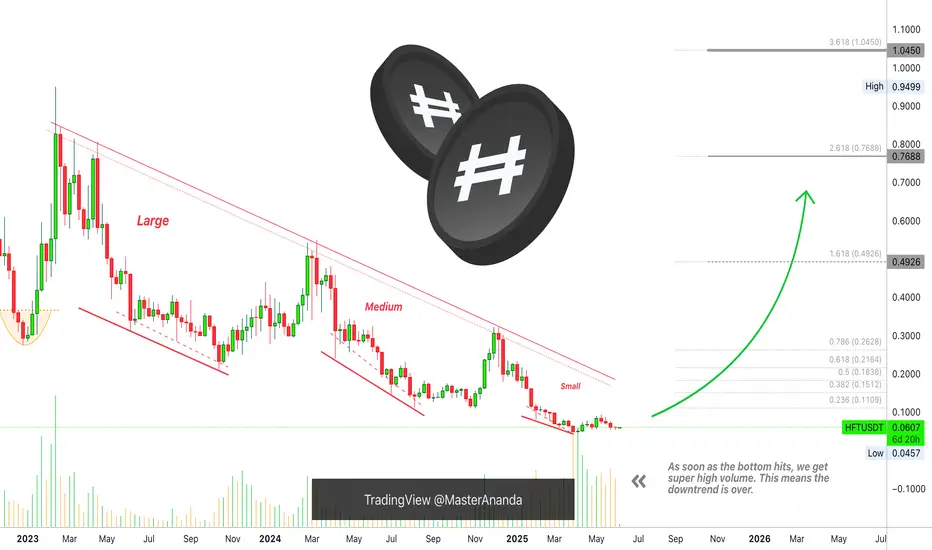
Hashflow Hits Bottom... Notice The Waves... The Large Bull RunNotice the waves... It all starts in January 2023 with a strong advance. 243% total growth. Mid-February 2023 we have a price peak and this signals the start of a bearish trend. Notice the waves...
It all starts with a large wave. As the downtrend unravels, the waves become smaller. Then we have a medium wave and finally a small wave.
As the market hits bottom, you guessed it, 7-April 2025, there is a very strong increase in trading volume. This uptick in volume signals that the bottom is in. Once the bottom is in we can prepare for a change of trend. Long-term growth.
Now we will have the same dynamics but in reverse. First a small wave... The initial bullish breakout. Then a medium wave and finally a large wave which is the end and the bull run.
Namaste.
Short BTC, it is about to retrace and test 100000 again!As BTC gradually fell back, the rebound did not stand above 110,000 in the short term, proving that there is strong selling pressure above, and the trend line formed by the technical high point 111,000 and the second high point 110,000 formed an important resistance area, which limited the rebound space of BTC and strengthened the demand for BTC's short-term retracement.
According to the current trend, the short-term oscillation bottom area of 106,000 may be broken at any time. Once it falls below the oscillation area, it may arouse a certain degree of profit-taking chips and stimulate BTC to accelerate its decline. I think BTC will at least test the 105,000-104,000 area again during the retracement, and may even test the 100,000 integer mark again.
Therefore, shorting BTC is still the preferred option for current short-term trading.
Consider shorting BTC in the 108,000-109,000 area, and the target area in the short term is 104,500-103,500. After breaking this area, the target can be extended to 101,000-100,000.
BINANCE:BTCUSDT BINANCE:BTCUSDT BITSTAMP:BTCUSD
Xrp - The expected rally of +50%!Xrp - CRYPTO:XRPUSD - is still clearly bullish:
(click chart above to see the in depth analysis👆🏻)
Ever since Xrp rallied more than +550% in the end of 2024, we have been witnessing a quite expected consolidation. However Xrp still remains rather bullish and can easily retest the previous all time highs again. Maybe, we will even see another parabolic triangle breakout.
Levels to watch: $3.0, $10.0
Keep your long term vision!
Philip (BasicTrading)

BTC Consolidates Above $100K — Bullish Structure Remains IntactKey Support Holding Firm:
Bitcoin is consolidating above the critical $100,000–$105,000 support zone, a former resistance area from early 2025. Holding this level preserves the broader bullish structure.
Short-Term Noise, Long-Term Strength:
While recent price action shows some lower highs and lows, the long-term uptrend that began in April remains fully intact. This is typical consolidation behavior within a strong bull market.
Wedge Formation Points to Breakout:
A six-month wedge pattern continues to develop, often a precursor to a powerful breakout. If resolved to the upside, the next leg could target the $130,000–$135,000 range.
Outlook Remains Bullish:
As long as Bitcoin holds above $100,000, there’s no technical basis for a bearish scenario. This remains a constructive pause within a dominant uptrend.
#Bitcoin #BTC #CryptoMarket #TechnicalAnalysis #Bullish #SupportAndResistance #WedgeBreakout #LongTermTrend #MarketOutlook #PriceAction
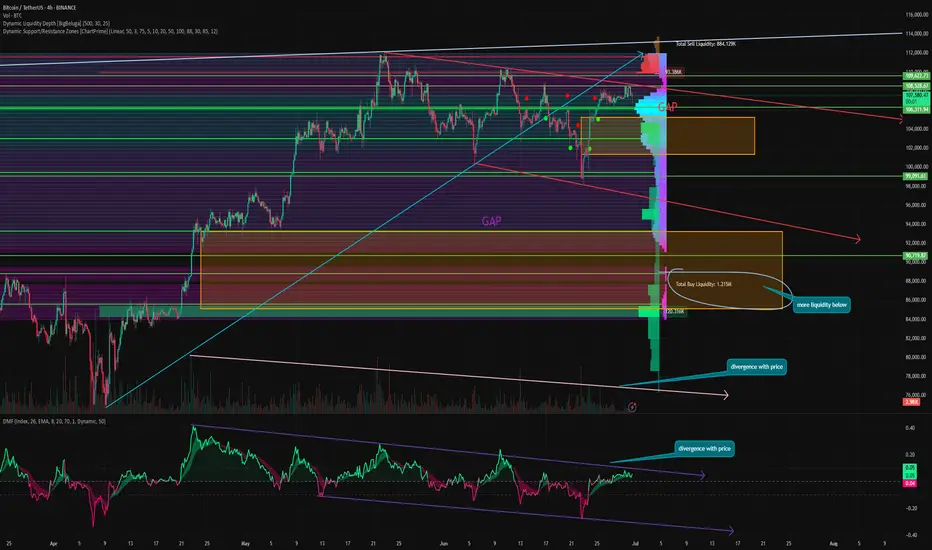
Bitcoin will no longer update ATH, and here's why⚡️ Hello, everyone! I decided to update my idea about Bitcoin. Let's see what awaits us!
Bitcoin rebounded strongly over the weekend and is now trying to consolidate at the $107,000 level. This is a key level, which is the MSB level for the entire current momentum since May, and as long as the price remains below it, it is a bearish movement.
Last week, we also closed the GAP to the $98,000 level from the previous movement, but on the way up, we formed a new one at $105,250 - 101,360. And as we know, 99% of GAPs close sooner or later.
📉 Bitcoin also continues to move in a descending flag, which, although it is a bullish pattern in an upward impulse and more often breaks through upwards, has not been working that way for a long time. Trading based on technical analysis is the basis of crypto and has become very widespread, which is actively used by many whales and counterplayers. As a result, many pattern signals have long lost their relevance and now often give false signals.
⚙️ Metrics and indicators:
Volume - divergence with price since the end of April. Throughout this upward momentum, purchase volumes continued to decline. This indicates a lack of liquidity and demand for Bitcoin at present.
Money Flow - also divergence with price. Also, since the end of April, positions have continued to close and liquidity has continued to decline. This indicates a lack of interest in the asset.
Liquidity Depth - we know that the price moves from liquidity to liquidity, which serves as its fuel. And now there is much more liquidity at the bottom than at the top.
Support/Resistance - Based on the volume of interest, it is clear that the $106,000 level is a major zone, and if it is lost, the nearest support level will only be at $103,004, but with significantly lower volumes.
📌 Conclusion:
Despite all the huge inflows into ETFs, there is now even less liquidity in Bitcoin than in November 2024, when Trump became president.
This suggests that everyone is actively closing their positions and there is no new money coming in. Search queries for the tags “crypto” and “bitcoin” are not even close to last year's levels, let alone 2021 levels. This means that there is no new retail interest in crypto right now.
I don't see any catalysts right now that could keep the price at this level. And ETFs are not an indicator at all; we've already seen how these “smart money” buyers bought at 110k on ATH and sold even more at 70k.
🔥 So, right now, I recommend sitting back and watching. Let the market sort itself out and indicate the direction of movement going forward.
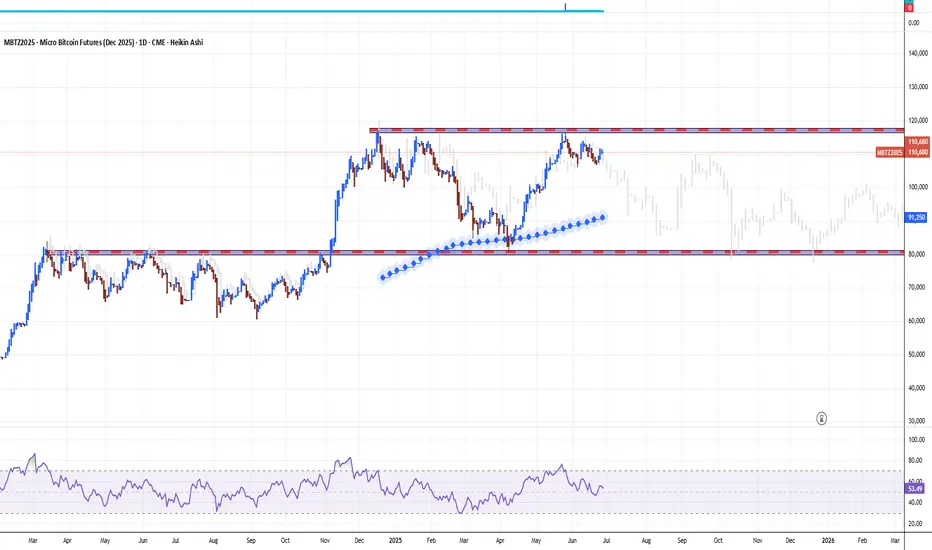
Strategy H2 2025. BTC Airless Plot Near $100'000 Choking PointOver the past 6 months, Bitcoin (BTC) has demonstrated a very mixed up/down performance, marked by significant price fluctuations, appreciation and volatility.
From late December 2024 to June 2025, BTC's price rose from approximately $92,000 to around $108,000, representing a gain of about 17.26% over this period.
On the other hand. the price fluctuated between last price in 2024 $92,000 and BTC' low near $74,491 achieved in early April 2025, posting the similar, nearly 20 percent year-to-date decline.
Bitcoin's price trajectory during this time was influenced by several factors. Early in 2025, BTC reached a new all-time high near $109,000 but faced a pullback triggered by profit-taking and macroeconomic uncertainties, dropping nearly 30% to about $74,000 by April. This decline was short-lived, as Bitcoin quickly rebounded by roughly 24%, climbing back to mid-$90,000 levels and eventually surpassing $100,000 again by June, signaling wide range fluctuations are getting for longer.
The technical setup suggests that Bitcoin is poised for further swings around $100'000 choking point.
In summary, Bitcoin’s performance over the last six months has been characterized by sharp correction, mixed technical buy and sell signals, with no any solid fundamental support from institutional investors.
These factors collectively indicate a mixed outlook for BTC, with further price fluctuations in wide range, as a mid-term pricе action perspective for H2 2025 and for longer.
Similar like a year ago 52-week SMA could be considered as major support level.
--
Best wishes,
@PandorraResearch Team 😎
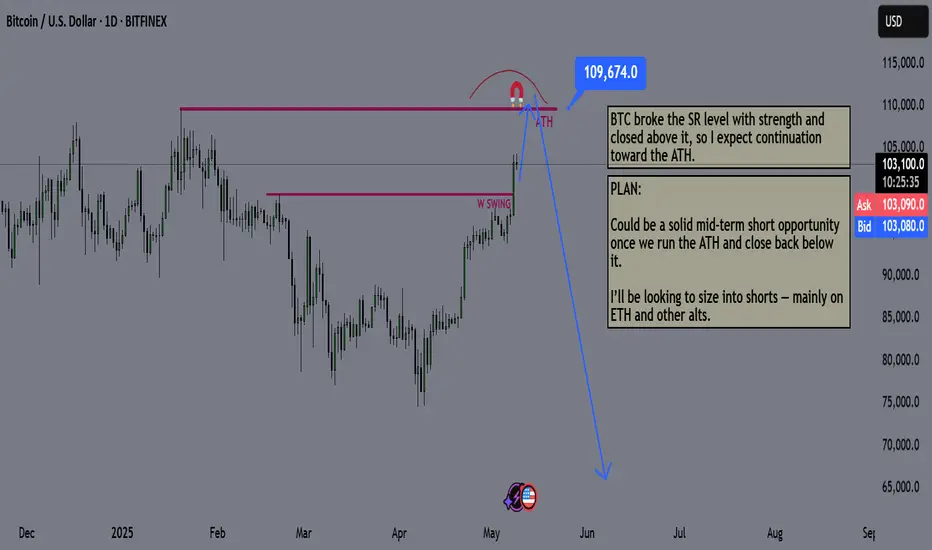
Bitcoin Mid Term Game Plan - BTC PLANBitcoin just broke a key resistance level with strength.
I expect a new all-time high soon, likely the summer top.
Summer markets are usually weak for risk assets and strong for gold. Seasonality matters, keep that in mind.
I expect risk markets to sell off until mid-July to early August. I’ll start buying once we break structure again.
The plan:
Wait for BTC to hit $110K
Look for a reversal from that level
Start aggressively shorting alts, beginning with ETH and memecoins
Hold shorts until late July / early August
Close positions and shift back to buying