BTC at Make-or-Break: Rejection or Liftoff to $130K?
Bias/Summary
BTC is at a critical zone between 109K–112K. Price is currently showing hesitation after initial rejection at the Yearly L3 (112K), and I’m leaning short unless we see a strong breakout and hold above that level. However, if bulls reclaim it, we could see a fast move to 130K before many can react.
Technical Context:
Yearly L3 sits around the $112K zone – a historically significant level.
Price faced rejection at $112K and is now hovering near $109K.
Lower timeframe showing indecision, possible bearish bias.
Watching for:
Rejection + lower high below $112K = short setup.
Clean breakout + retest of $112K = shift to long bias.
Trade Idea / Setup:
🟥 Scenario A – Short Bias (Current Leaning):
Entry: 110K–111.5K (if rejection confirms)
Stop Loss: Above 112.5K
Targets:
TP1: 104K
TP2: 99K
TP3: 94K
R:R: Up to 3.5:1 depending on entry and target
🟩 Scenario B – Breakout Long (Contingent Setup):
Entry: 113K+ (after breakout and solid retest)
Stop Loss: Below 111K
Targets:
TP1: 120K
TP2: 130K
R:R: ~3:1 or more if momentum confirms
Risk & Patience Reminder:
⚠️Let price lead. No breakout = no long. No clear rejection = no short. Wait for confirmation, and don’t force entries in the chop.
Patience > Prediction.
NFA. DYOR. Manage your risk.
Cryptomarket

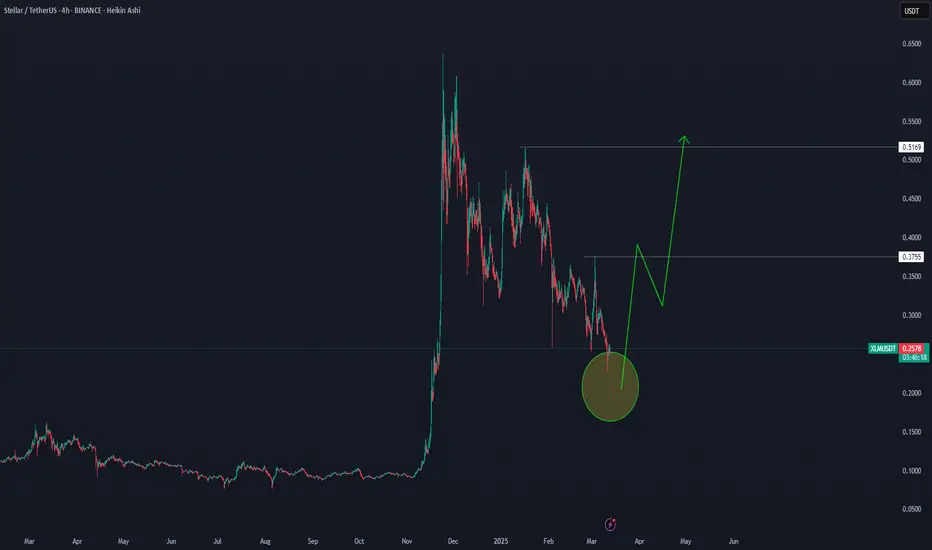
XLMUSDTXLMUSDT From the specified range (of course, now) it should reach the price of 0.5169, in the middle of the way it will correct at the price of 0.3755 and then it will rise towards the target, this is certain
Market geometry is right
ETH 4H | Eyes on Support |ETH on the 4H
Bears are having their moment — and that’s fine.
Price is heading lower, with the 200MA around $3200 as the next support. If that breaks, the 0.382 Fib near $3000 is the last line before things get ugly.
My plan? Watch RSI for signs of bullish divergence.
Until then, hold tight.
Always take profits and manage risk.
Interaction is welcome.

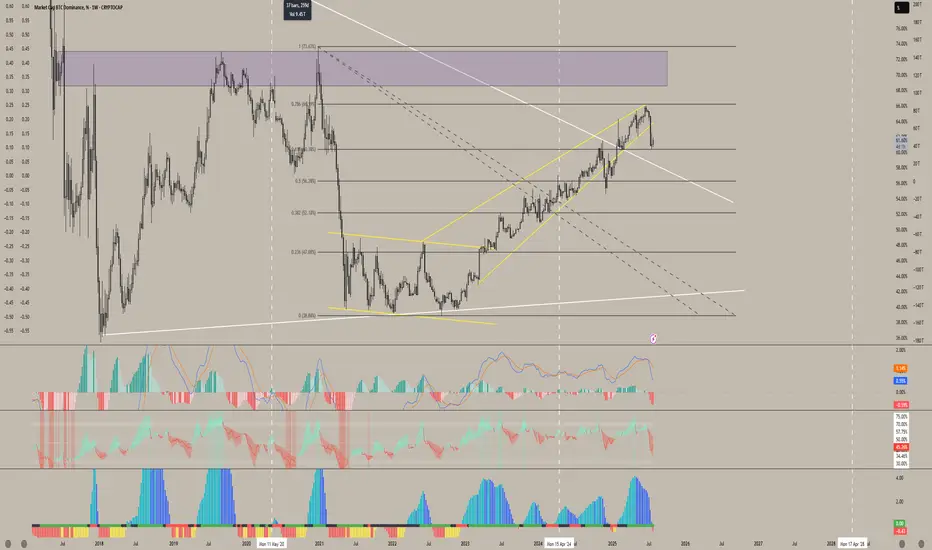
Smart Money Watching BTC Dominance – Rotation to Alts IncomingAfter a deep correction, BTC Dominance has entered a corrective upward phase inside an ascending channel.
Wave A rallied from 60.5% to 62.3%, followed by Wave B retracing to 60.74%.
Currently, Wave C is developing and has reached around 62.2%.
The key resistance sits near 62.7%, exactly at the upper trendline of the channel. This could act as a reversal point, potentially ending Wave C and triggering a bearish move.
💡 Implication:
If dominance drops from this zone, we could see capital rotation into altcoins, supporting a bounce across the broader altcoin market.

LTCUSDT | Daily Chart Analysis | Bullish Structure UnfoldingLTCUSDT | Daily Chart Analysis | Bullish Structure Unfolding
🔍 Let’s break down LTC/USDT’s technical setup, focusing on volume, Elliot Wave structure, and key target levels for this bullish scenario. If you're following this channel, be sure to react and let us know your thoughts on the roadmap!
⏳ Daily Overview
LTCUSDT is moving within a defined ascending channel, supported by increasing bullish momentum and clear Elliot Wave progression. The recent wave count points to a textbook impulse, setting up the next key move.
🔺 Long Setup:
The market has completed Waves (1) through (4), and we’re now looking at the development of Wave (5) to the upside.
- Wave (5) Target Zones:
- $130.00
- $144.44
These are the next resistance levels based on previous highs and channel dynamics.
- Key support to watch:
- $105.30 — this zone may act as a springboard for the next rally if tested.
📊 Key Highlights:
- Volume has shown a clear bullish divergence as price advances, signaling growing interest and strength heading into Wave (5).
- The bullish channel remains intact, and each dip has been met with higher lows, confirming the ongoing uptrend.
- Elliot Wave structure suggests further upside, with the $130.00 and $144.44 levels as potential targets.
🚨 Conclusion:
LTC bulls should keep an eye on price action as it approaches support at $105.30 — a bounce here could ignite the next leg higher toward our target zones. Reaction from the channel community will be crucial as Wave (5) unfolds. Show your support with a reaction below if you’re riding this wave!

BTC; Heikin Ashi Trade IdeaAfter a correction, price may have a good reaction from first demand area I have marked.
Lower demand zone is even more valid, since we see manipulation and then impulsive move to the oposite side.

Aimonica / UsdtGATEIO:AIMONICAUSDT
### **Aimonica Brands / TetherUS (1h) - Gate.io**
- **Price**: 0.001769 (+0.17%, +0.000003)
- **High/Low**: 0.001781 / 0.001752
- **Buy/Sell**: 0.001769 (BUY/SELL at same price)
- **Key Levels**:
- **Resistance**: 0.001972, 0.002000
- **Support**: 0.001700 (D), 0.001608
- **Market Sentiment**: Neutral/minor bullish (no strong momentum).
**Summary**: Slight uptick, low volatility. Watch for breakout above 0.001972 or dip below 0.001700.
---
### **⚠️ Disclaimer**
This analysis is for informational purposes only and does not constitute financial advice. Cryptocurrency trading involves high risk, and past performance is not indicative of future results. Always conduct your own research (DYOR) and consult a financial advisor before making investment decisions.

Sui chance for +60% on this zoneSui continue to grap liquidation but on the monthly and weekly timeframe we are still bullish.
I just saw good zone for trade. At 3.15 we have daily EMA + fibonacci 0.64 + Daily FVG.
I will suggest to add some leverage because invalidation is close to 2.9.
In this mid term bull market of altcoins we can see that SUI has good performance.
Ivan

WeBull Look Ahead $BULLRecently took a look at WeBull and I believe there is a huge arbitrage opportunity from NASDAQ:HOOD to $Bull.
Although RobinHood is building something much much bigger than anticipated, including banking, I think WeBull can take some of $HOODS market share depending on their direction.
-Webull's total revenues grew 32% year-over-year to $117 million in the first quarter of 2025, according to SEC filings
-Customer assets increased 45% year-over-year, reaching $12.6 billion at the end of Q1 2025, according to Webull
-The number of registered users grew by 17% year-over-year, according to Webull
-Partnership with prediction market Kalshi will grow profits for WeBull exponentially.
www.nasdaq.com
This Might be the best price to get in today depending on WeBull's Success.

BTC is likely to resist falling below $112000BTC is likely to resist falling below $112000
If the confluence between the yellow trendline and the top green horizontal support level dont hold strong, we are likely to see BTC retrace to $100K
Please trade with care.
My thoughts are shown on the chart technically
I hope to connect with you.
Please like, share, comment and follow me.

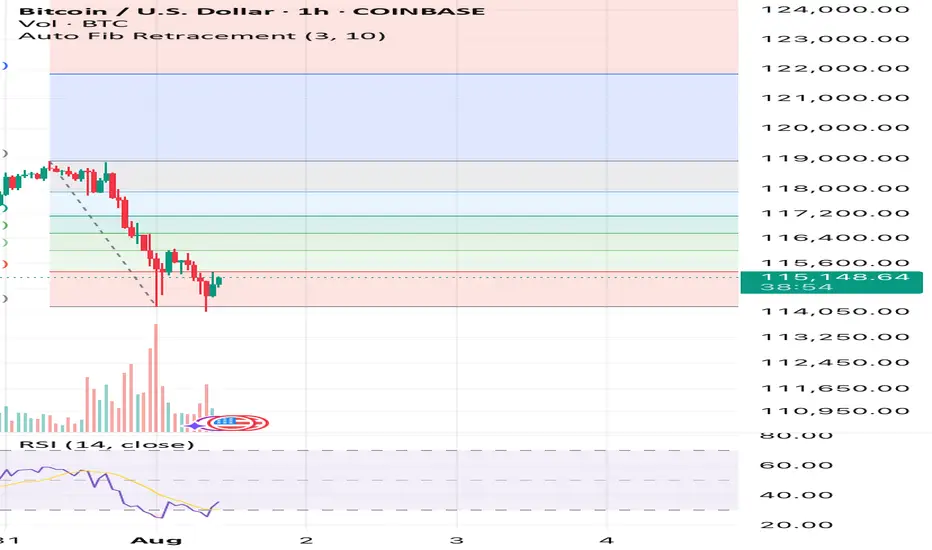
Bitcoin has an upside to it if we hold above $14,900See what you think it’s simple Auto Fib Retracement and RSI. That’s all I’m using here and also past times and other data outside of this image but inside the CRYPTOCAP:BTC market.
What you think? Up to $118k again before down or sideways? Or will this be the end of the large bull flag formation? We’ll soon find out!
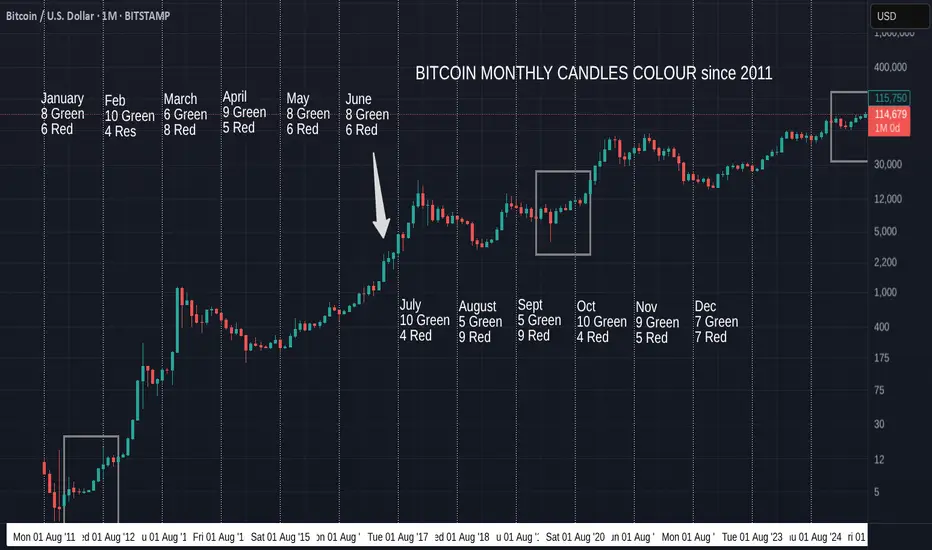
Bitcoin Monthly Candle Colour patterns and Colours since 2011
We got the expected GREEN July and so, amazingly, we continue to repeat the pattern from January to July 2012. ( Left Box )
It is almost the same pattern as 2020, apart from the Red May candle in that Year. (Right box)
The Large Arrow points towards another occasion where we had a series of consecutive Green candles from March to July, though these candles sizes are nothing like the ones we are currently experiencing.
The Boxes show us The only 2 occasions where we have had a Green December, Red January, Red February, Green March, Green April.
Then we had a Green May 2012 and a Red May 2020
Then both repeated a Green June, Green July.
The thing to note here is how all these are en-route to Cycle Highs.
So, August count currently is 5 Green to 9 Red, so the Odds are, while looking at BTC History, that we will get a RED August
HOWEVER, if we continue this run of following previous patterns, we will see a GREEN August.
In fact, 3 of those 5 Green August closes were in these 3 patterns mentioned.
Every single one of the 5 Green previous August followed a Green July, the last time was in 2021.
As mentioned in last months report, the size of the candles currently in this pattern are more like those in 2020 than the other 2 patterns talked about here.
With this in mind, we may expect a smaller Green candle close for August , Followed by a small Red candle in September. This did also happen in 2017 ( Arrow).
This August has opened Red but so far this year, many month opens were red and then changed.
So, My expectation id for a small Green August as markets cool off over the holidays and we wait for the start of Q4 in October.
We will have to wait and see as ever
Stay safe
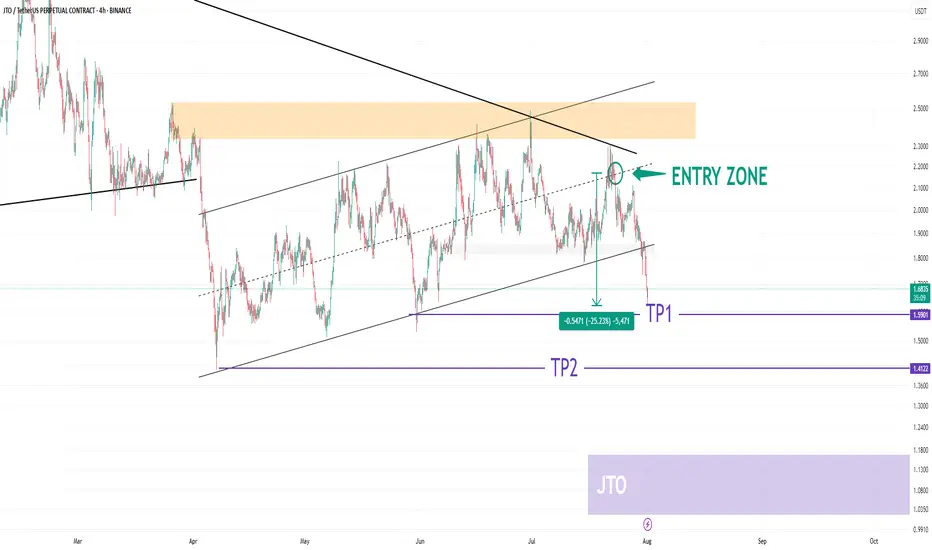
JTO USDT UpdateHELLO 😍
JTO Update
💁♂️ -25% 🔥
I shared this analysis when it was in the entry section. It would be nice to have an update of this analysis.
The JTO cryptocurrency has corrected 25% since the entry zone.
We saw a very good analysis together. What do you think? 😊💖
You can save some profit from the position in this area. 🐱
Please don't forget to like, share, and boost so that I can analyze it for you with more enthusiasm. Thank you. 💖😍
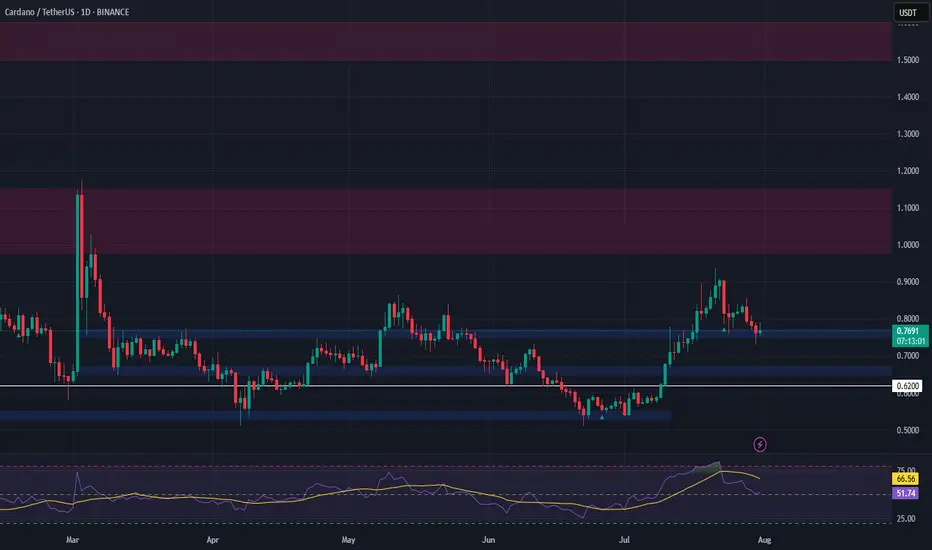
ADA Setup – Eyeing Entry After 70%+ RallyCardano (ADA) has surged over 70% in recent weeks. A healthy pullback is underway, and we’re watching the key support zone for a potential long entry targeting the next leg higher.
📌 Trade Setup:
• Entry Zone: $0.65 – $0.67
• Take Profit Targets:
o 🥇 $0.98 – $1.15
o 🥈 $1.50 – $1.60
• Stop Loss: Just below $0.62
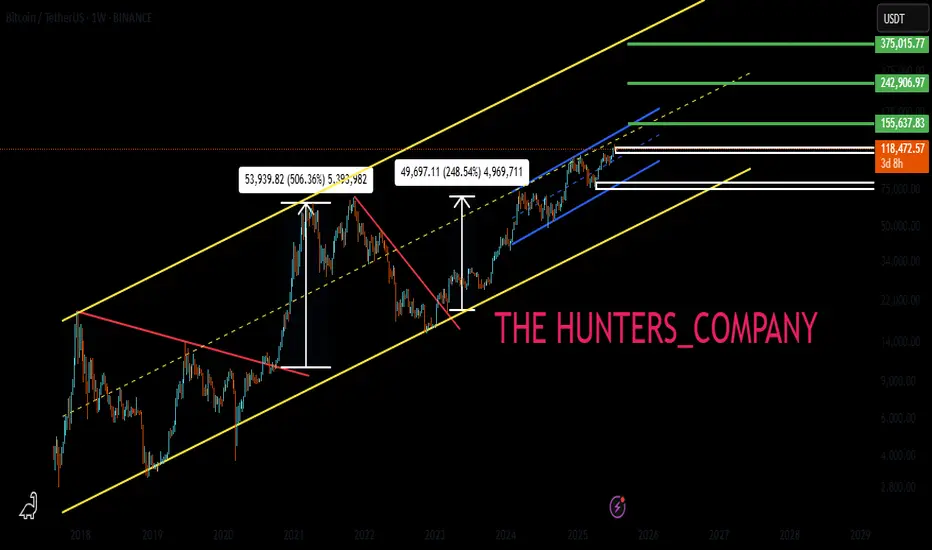
BTC : The future of Bitcoin...Hello friends🙌
👀According to the price history, the price has always been bullish and is in a long-term bullish channel.
📈Now that the price is struggling in the middle of the channel and is gathering strength for a big move, which is expected to break the middle of the channel in the form of a resistance or middle channel, the price will move to the ceiling of the channel.
⚠Don't forget risk and capital management.
🔥Follow us for more signals🔥
*Trade safely with us*
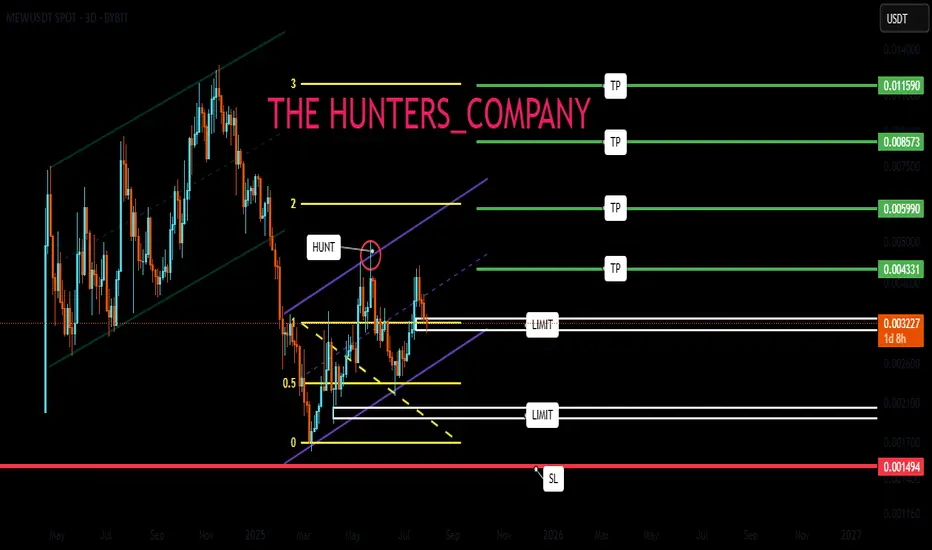
MEW : A meme coin that hasn't grown yetHello friends🙌
Given the decline we had, you can see that buyers entered the specified support area and entered the price into the ascending channel. That is why we can buy with risk and capital management and stay with it until the specified targets.
🔥Follow us for more signals🔥
*Trade safely with us*
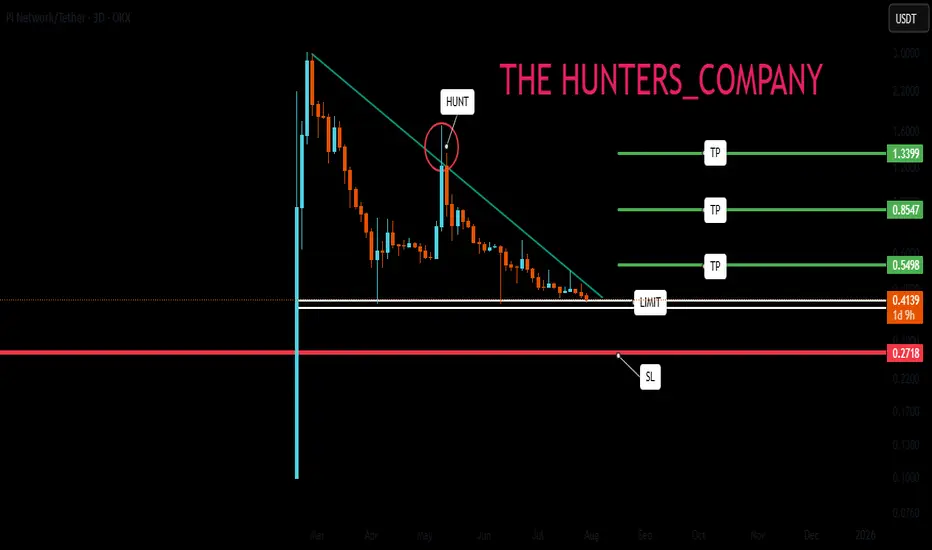
PI NETWORK : Will it finally be pumped?Hello friends🙌
👀According to the decline we had, you can see that the price has reached an important area and has formed a floor in this area. Considering the classic ego that is forming on support, you can enter the trade by breaking the resistance, of course, by managing risk and capital and moving with it to the specified goals.
🔥Follow us for more signals🔥
*Trade safely with us*
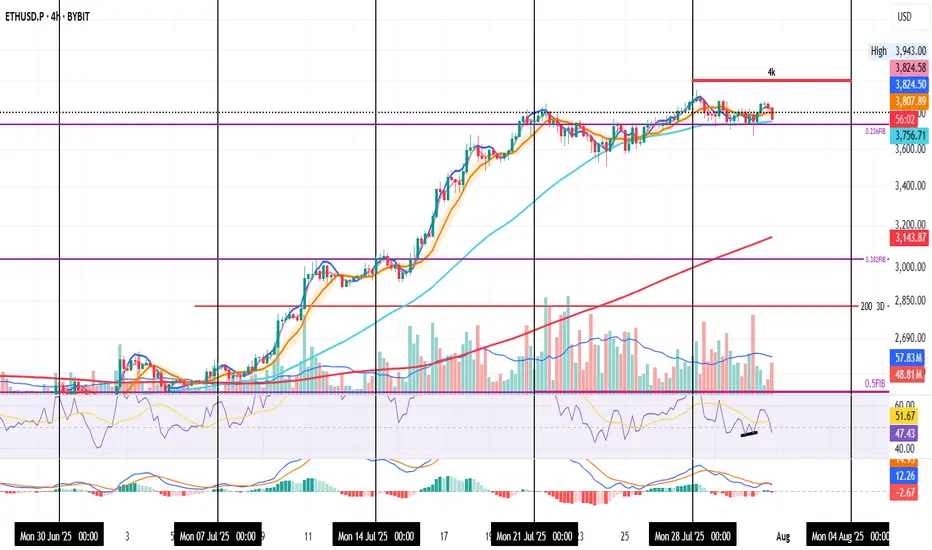
ETH Holding Steady in the Noise
ETH on the 4H
Price is pulling back again — mostly due to sticky inflation.
Even though YoY CPI came in at 2.8% (vs 2.7% expected), MoM data was on target, so the market may just be pricing in “higher for longer.”
Back to the chart — not much has changed.
ETH is still holding above both the 0.236 Fib and the 50MA.
The next real resistance is around $4,000.
Personally, I’d rather see price consolidate and gear up for a clean breakout than rush into it and get rejected.
Right now, it feels like ETH is waiting for direction.
It had a reason to drop — and didn’t.
It had a reason to fly — and paused.
Could be prepping for a boring chop before a sudden move.
I'm still bullish overall. Holding a long.
If it moves against me, I’ll scale out.
If it breaks higher, I’ll scale in.
Always take profits and manage risk.
Interaction is welcome.
TradeCityPro | Bitcoin Daily Analysis #140👋 Welcome to TradeCity Pro!
Let’s dive into the Bitcoin analysis. Yesterday, the interest rate decision by the US Federal Reserve was announced, and once again, just like the past few months, it remained unchanged. Let’s see what impact it had on Bitcoin.
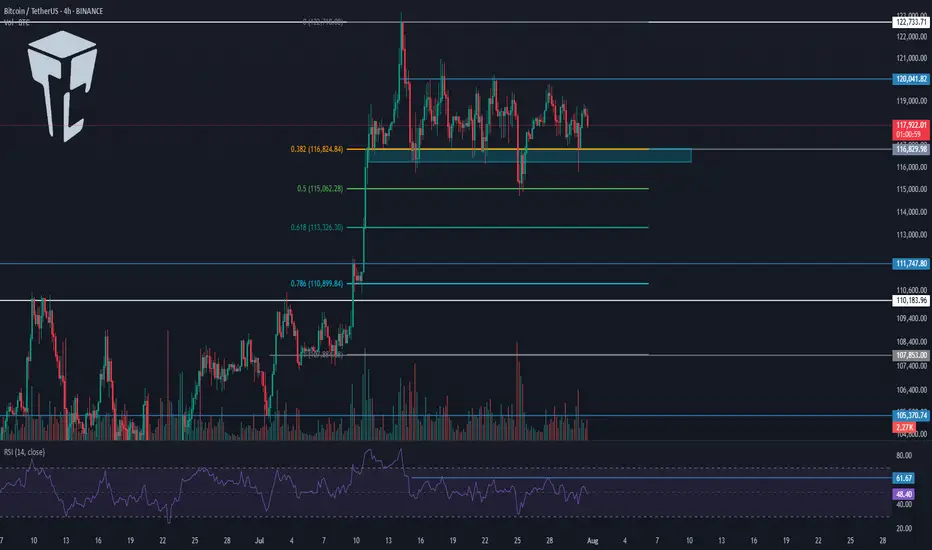
⏳ 4-Hour Timeframe
In the 4-hour timeframe, after the announcement of the unchanged interest rate and Powell’s speech, Bitcoin printed a red candle on the support zone and even wicked lower, but then recovered and the price returned back into the box.
✔️ Basically, we can say that this month’s rate decision had no real impact on the market, and Bitcoin is still moving inside its range box. The fact that the support zone wasn’t lost is a positive sign for the continuation of the trend.
⭐ But the important point is this: if the uptrend is going to continue, the price must print a higher high or at least a level equal to 120041, and in my opinion, if for any reason a lower high gets printed, the chances of breaking below 116829 significantly increase.
📊 I currently have no new position on Bitcoin, and all my entries are below 110000. But if 120041 breaks, I’ll open a long position for the next bullish wave that Bitcoin might start.
💥 A major trigger for starting a new leg is the 61.67 level on the RSI. As long as RSI remains below this level, there’s no bullish momentum in the market — and considering that the number of touches to 116829 has increased, the probability of a correction is also rising.
❌ Disclaimer ❌
Trading futures is highly risky and dangerous. If you're not an expert, these triggers may not be suitable for you. You should first learn risk and capital management. You can also use the educational content from this channel.
Finally, these triggers reflect my personal opinions on price action, and the market may move completely against this analysis. So, do your own research before opening any position.
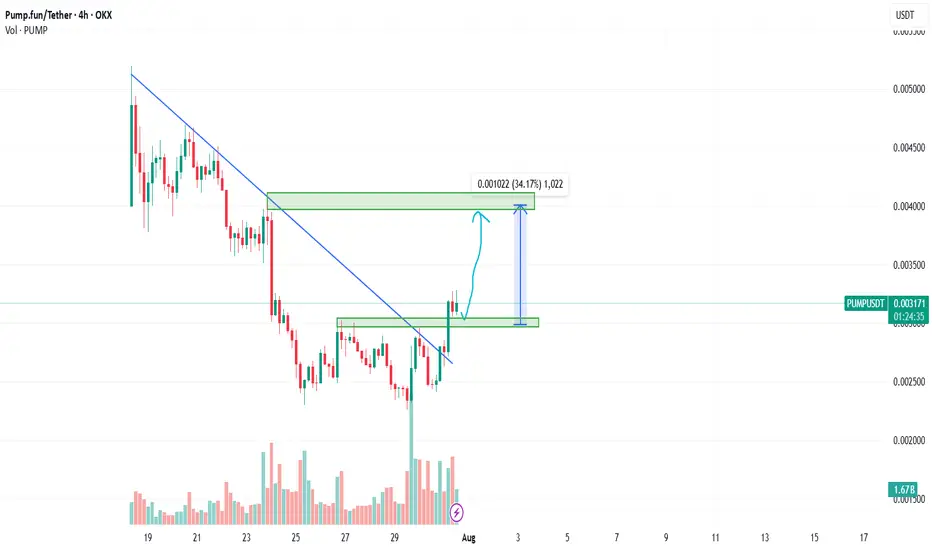
PUMPUSDT: Bullish Breakout and Retest - A Potential 34% Upside?Hello, traders!
Today we're looking at the PUMP/USDT pair on the 4-hour timeframe, and a very clean technical setup is unfolding that points towards potential bullish continuation. Let's break down the key elements of this analysis.
The Analysis
The chart presents a classic breakout and retest scenario, which is often a strong indicator of a trend reversal or continuation.
Descending Trendline Breakout: The most significant feature is the decisive breakout from a major descending trendline that had been capping the price for a considerable period. Breaking this trendline is a primary signal that the previous bearish momentum is weakening and buyers are starting to take control.
Break of Horizontal Resistance (S/R Flip): Following the trendline break, the price also successfully pushed through a key horizontal resistance zone, identified on the chart between approximately $0.002966 and $0.003044. This level has now, as expected, turned into a new support base.
The Retest: We are currently witnessing a pullback to this newly established support zone. This "retest" is a critical phase. A strong bounce from this level would confirm the breakout's validity and suggest that the market has accepted this price floor, paving the way for the next leg up.
Volume Confirmation: Notice the volume bars at the bottom of the chart. There was a visible spike in volume during the initial breakout candles, which adds conviction to the move. It indicates that the breakout was backed by significant buying interest.
The Trade Idea
Based on this structure, a potential long opportunity presents itself.
Entry: A favorable entry point could be found within the current support zone ($0.002966 - $0.003044), especially upon seeing confirmation of a bounce (e.g., a bullish engulfing candle or a hammer on the 4H or 1H chart).
Target: The analysis points to a primary target at the next major resistance level, located around the $0.004000 psychological mark. As measured on the chart, this represents a potential upside of over 34%.
Invalidation: This bullish outlook would be invalidated if the price fails to hold the current support and decisively closes back below the $0.002966 level. Placing a stop-loss below this zone is a prudent risk management strategy.
Conclusion
In summary, PUMPUSDT is displaying a textbook bullish setup. The combination of a trendline breakout, an S/R flip, and a live retest offers a compelling case for potential upside. As always, manage your risk carefully and wait for your preferred confirmation signals before entering a trade.
Disclaimer: This is not financial advice. The analysis provided is for educational and informational purposes only. Trading cryptocurrencies involves a high level of risk. Please conduct your own research and risk assessment before making any investment decisions.
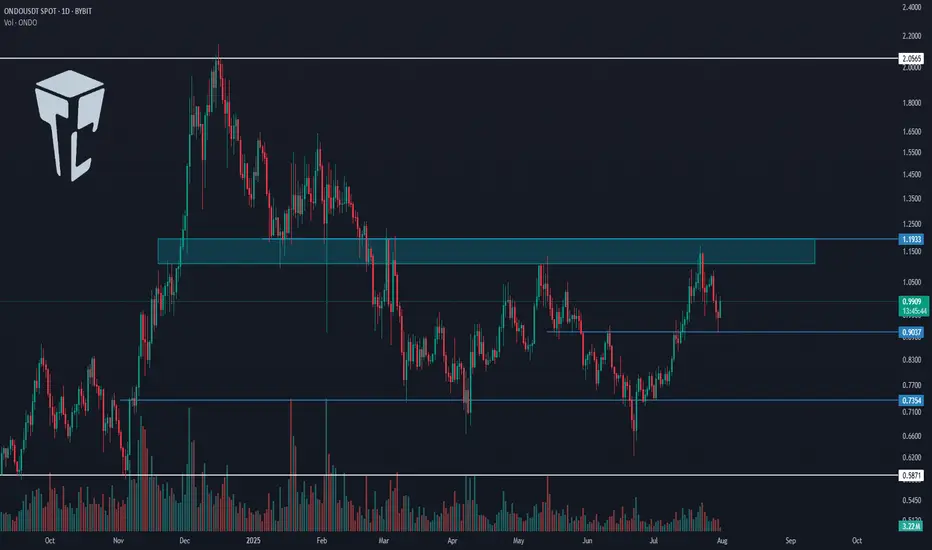
TradeCityPro | ONDO Builds Strength Beneath Key Supply Barrier👋 Welcome to TradeCity Pro!
In this analysis, I want to review the ONDO coin for you — one of the RWA projects, currently ranked 37th on CoinMarketCap with a market cap of $2.93 billion.
📅 Daily Timeframe
In the daily timeframe, as you can see, this coin has formed a range box between the levels of 0.7354 and 1.1933, and the price is currently sitting in the upper half of this box.
✔️ At the moment, the price is hovering around 0.9037, and it’s forming a higher low above 0.7354. If this low gets confirmed, the probability of breaking above 1.1933 increases.
⭐ The 1.1933 zone is a very significant supply level that was previously acting as support in late 2024, and after being broken, has since acted multiple times as resistance.
📊 If this area breaks, we can open a long position, or even buy this coin in spot. Personally, if this trigger is broken, I’ll open a long-term long position.
✨ The target for this position is 2.0565, and once the price reaches this level, we can take profits and consider a spot buy.
📝 Final Thoughts
This analysis reflects our opinions and is not financial advice.
Share your thoughts in the comments, and don’t forget to share this analysis with your friends! ❤️
Has Bitcoin become a "SAFE" asset ? These charts show that......
After we heard the US Federal Reserve hold rates yesterday, Markets Fell some.
And Bitcoin joined them for a couple of hours but Look now.
While the $ falls, the S&P Falls, GOLD is the traditional haven of safety and we can see how it Rose in Value over the last 12 hours
The $ has Fallen over the last 8 hours
S&P Stalled for the last 24 hours
And the STRONGEST positive moves over the last 12 hours were from BITCOIN rising, though it is taking a breather for the moment.
SO, has it become a SAFE HAVEN ?
Put it like this. Bitcoin has NOT lost value like it used to when under pressure.
We have yet to see what would happen once it reaches its cycle Top. Will it retreat as it has historicaly...
But for now, it does seem to be a strong store of Value and remains with potential and likelihood of further rises.
The TOTAL CRYPTO MARKET CAP chart below
This shows us that the investor market seems Very confident in the Crypto Market,,Just going from strength to strength.
The TOTAL 2 Market Cap chart shows us something very interesting.
The TOTAL2 chart is the Total Market Cap MINUS BITCOIN
Compare the 2 charts and you will see how the TOTAL chart has risen way over its previous cycle ATH but the TOTAL2 is currently being rejected off its previous ATH line.
This clearly shows us that BITCOIN is the strength in the Crypto Market.
It is the same story on the TOTAL3 chart ( TOTAL minus BTC & ETH )
It is the same on the OTHERS chart ( Top 125 coins minus top 10 by market Cap )
BITCOIN CARRIES THE MARKET
These are early days but the Future of Bitcoin does seem VERY good
So far this cycle, the largest retrace was -31%
This drop was NOT a sharp Drop over a short period of time. It was an expected and controlled drop over 112 days.
But the zoomed out version of that chart tells us something VERY GOOD
PA has risen above and Tested and held that line of resistance that had rejected PA at Cycle Top ATH in 2017 and 2021.
That is a HUGE move and we wait to see if we Hold and move higher away from this line.
SO, Is Bitcoin a Safe Haven ?
It is certainly looking more and more like it.
PA is secure, has held position well and is in Price discovery...slowly and with caution...but always moving forward.
The traditional 4 yeat Cycle would end in late Q4 this year and so we have to wait and see what happens then.
But Bitcoin PA has moved into New ground on so many fronts now.
The traditinal BEAR market may not appear, in which case, YES, Bitcoin could become a New SAFE HAVEN
Buy Bitcoin
Hold Bitcoin

BTC.D FIB Lvl RejectionI'm liking the recent pullback in Bitcoin dominance - we're finally getting a taste of those altcoin gains we last saw around December. Each time dominance hits a key level on the Fibonacci retracement, we tend to see a pullback, and this recent rejection near the 0.786 level is no exception. It's a recurring pattern worth keeping an eye on.
That said, I still believe there’s a chance for one final rally in Bitcoin dominance - a potential shakeout before the real altseason begins. Historically, when Bitcoin breaks out of consolidation and pushes to new all-time highs with strong displacement, dominance tends to dip shortly after. So if BTCUSD continues to range at these current levels, I wouldn’t be surprised to see dominance spike again before we get the real altcoin momentum everyone’s waiting for.
This can also relate to what I've been reviewing in my previous charts published on my page