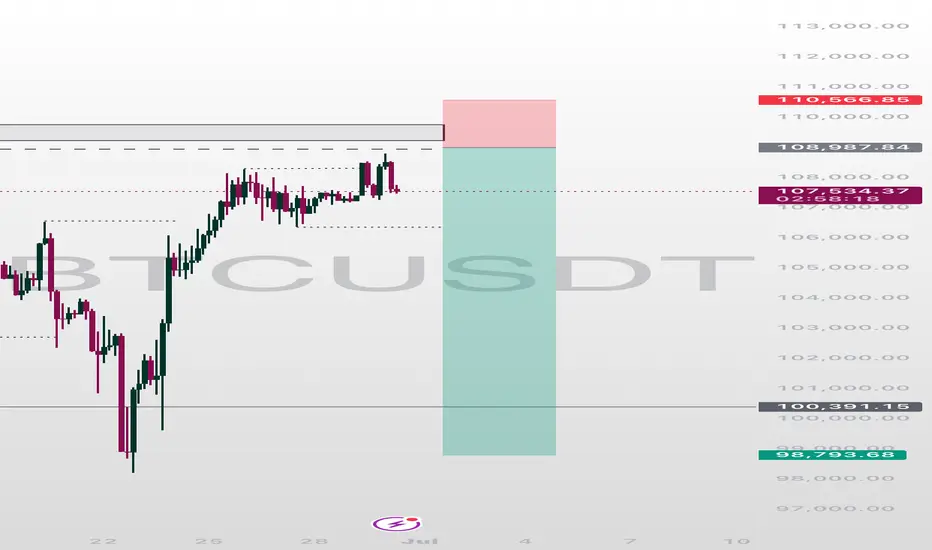
BTCUSDT in a sell zone Let's keep it simple.
The IOF is bearish on the H4 timeframe.
Price has retraced to a premium zone.
Technically, once we see a lower timeframe confirmation from these zones, we take a sell.
While I'm eyeing the liquidity at 109050, any break below 106415 will usher us into a sell towards 99000.
Use your proper entry confirmation and risk management.
Cryptomarket
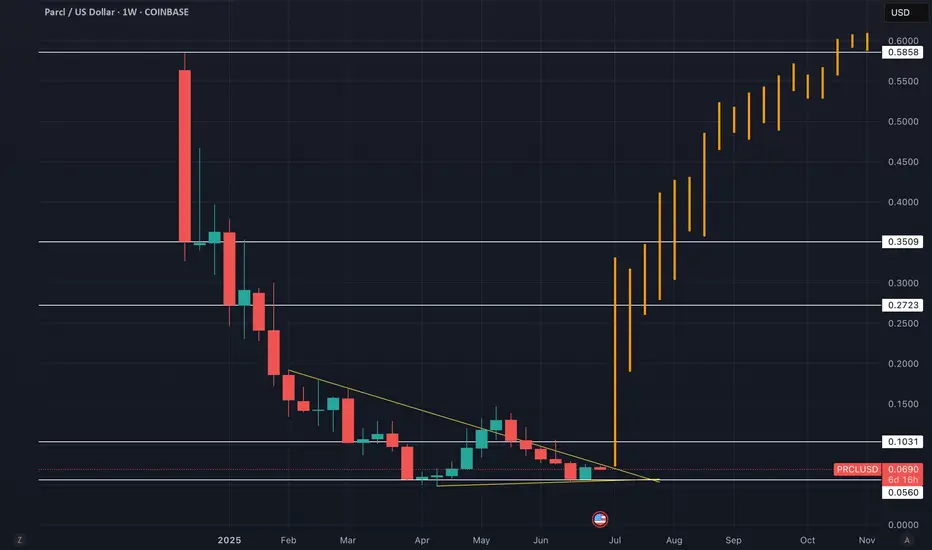
Parcl - PRCL-USD - 30 Million Market Cap (100x Potential)tradingview.sweetlogin.com
CHATGPT Research Summary:
Parcl: Unlocking Real Estate Exposure on the Blockchain
Introduction:Parcl is a groundbreaking decentralized platform that enables traders and investors to speculate on real estate market price movements much like they trade crypto or equities. By combining real-time housing data with blockchain technology, Parcl offers around-the-clock, borderless, and highly liquid exposure to global residential real estate markets. In this comprehensive blog post, we’ll explore what Parcl is, how it works, what it means to own the EGX:PRCL token, the unique opportunities it provides for investors (including AI-driven strategies), its core strengths, and the risks and challenges it faces. The tone is professional, investment-focused, and designed for the TradingView audience.
What is Parcl and How Does It Work?
Parcl allows users to trade real estate price indices for global cities without ever owning or transacting physical property. Each index represents the aggregated median price per square foot/meter for residential properties in a specific city. Users can go long or short on these indices using perpetual contracts with up to 10x leverage, entirely on-chain and settled in USDC.
Built on Solana, Parcl leverages the blockchain's high speed and low fees to offer a seamless and cost-efficient trading experience. Users only need a Solana-compatible wallet (e.g., Phantom) to deposit USDC, select a city index, and place a trade. There are no barriers such as down payments, brokers, or escrow delays — just rapid, decentralized access to global housing markets.
Data integrity is ensured through Parcl Labs, which aggregates millions of housing data points daily to generate real-time city indices. These feeds are streamed on-chain via oracles like Pyth Network, ensuring transparency and reliability.
What Does It Mean to Own EGX:PRCL ?
The EGX:PRCL token is the governance and utility token of the Parcl ecosystem. Holders of PRCL can:
Participate in protocol governance by voting on changes to platform parameters, fee structures, and market expansions.
Access premium real estate data and analytics through Parcl Labs.
Receive airdrops, rewards, or staking incentives as part of community growth and loyalty initiatives.
While PRCL doesn’t currently offer revenue sharing, it grants holders influence over protocol decisions and potential future economic alignment as the ecosystem matures.
A New Asset Class for Investors and AI Agents
Parcl opens up a completely new asset class: blockchain-native, synthetic real estate exposure. This has major implications:
For retail investors, it democratizes access to real estate, which was previously limited by geography, capital requirements, and illiquidity.
For sophisticated traders, it enables granular bets (e.g., short New York, long Miami) and high-frequency strategies previously impossible in traditional real estate.
For AI agents and algorithmic investors, Parcl provides composable, on-chain access to a diversified asset class that can be rebalanced and traded programmatically.
In short, Parcl makes real estate a liquid, programmable, and globally accessible financial primitive.
Core Strengths: Why Parcl Stands Out
Solana-native speed & cost-efficiency: Enables fast execution and micro-investments ($1+), ideal for retail users and automated agents.
Unique data infrastructure: Parcl Labs’ real-time indices provide unparalleled accuracy and granularity.
Sophisticated perpetual AMM model: Handles liquidity and market balancing with dynamic funding rates and cross-margining.
Growing community and product-market fit: With 80,000+ users and over $1.3B in cumulative volume, Parcl is becoming the most liquid real estate trading venue in the world.
Risks and Threats to Consider
Regulatory uncertainty: Synthetic real estate products may eventually face classification as securities or derivatives in some jurisdictions.
Liquidity dependencies: The AMM model depends on sufficient USDC liquidity pools; low liquidity could cause slippage or insolvency risk.
Smart contract vulnerabilities: As with all DeFi platforms, there is non-zero risk of exploits or oracle manipulation.
Platform dependency: Parcl is tightly coupled to Solana — if the chain experiences downtime or congestion, the protocol may be impacted.
Investors should also be aware of token unlocks and potential dilution from early backers and treasury allocations.
Future Outlook and 100x Potential
With a current market cap near $30 million, Parcl represents a high-upside, early-stage bet on tokenized real estate. If the project gains traction and achieves broader adoption, it’s feasible to imagine a future market cap of $2.5 to $3 billion, representing a 100x potential from current levels.
Factors that could drive this include:
Expansion to more global cities
Increased PRCL utility and staking incentives
Growing demand for real-world assets (RWAs) on-chain
Enhanced support for automated and AI-driven strategies
Final Thoughts
Parcl is redefining what it means to invest in real estate. By transforming local, illiquid property markets into a global, composable, and liquid asset class, Parcl enables both human and AI investors to access and trade the housing market like never before.
Whether you’re a trader looking for uncorrelated exposure, a long-term investor seeking innovation, or a technologist building AI agents — Parcl offers a compelling opportunity.
⚠️ Disclaimer: This is not financial advice. Always do your own research and make investment decisions based on your individual risk profile.
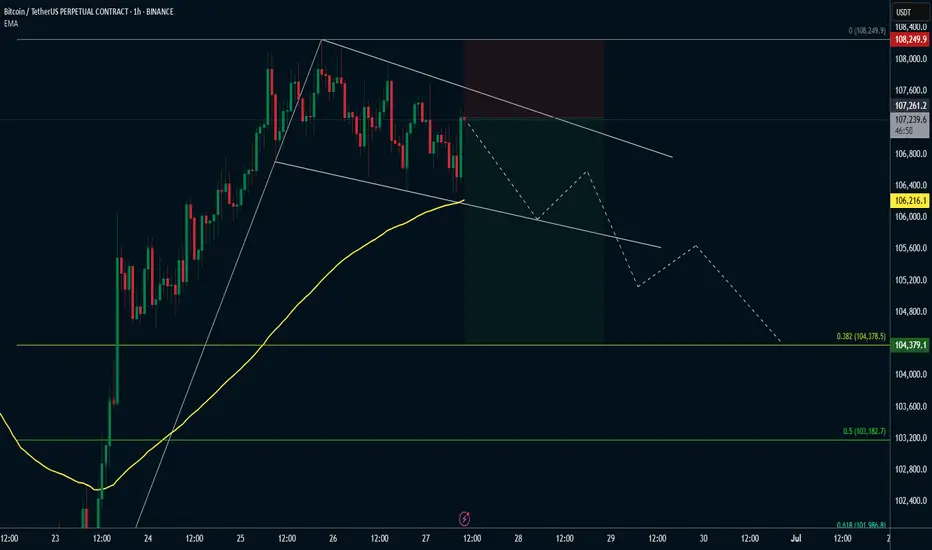
Bitcoin Closed the week with a strong Green candle...now ?PA has been trying to get over that bold trendline since Feb 2024.
It is the same line that PA used back in 2021, to bounce up to the Cycle ATH in Nov 2021.
And we have begun th e week just on Top of it, as we can see in the Zoomed in version of the chart below.
This week is a Big one in many ways.
We also have the Month close today and currently, we have a Big Green candle for that .
If we close with that, historically, it points towards an unsettled summer or a Big push en-route.
More on that tomorrow.
The weekly MACD still has room to climb but I still think we are to see a repeat of where that arrow points.
Th weekly RSI is also in Mid ground and can move in either direction
One thing that has really caught my eye however, is the Volume Delta
See how this is reducing - Could this be the Calm before the Storm ?
And that storm could be Bullish or Bearish. We do have a number of lines of resistance overhead that could prove difficult.
So, hang in there.
My personal opinion is that we are going to see apull back in the near future,,,,,and if we close the month green today, that WILL be next week

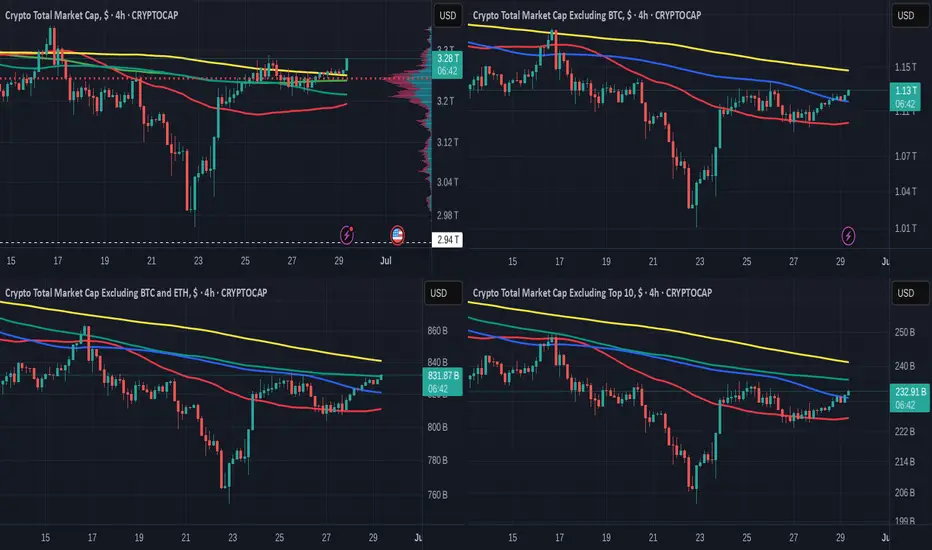
Really quick TOTALS charts - possible WARNINGS
It is Very clear when you look at these 4 charts
TOTAL - TOTAL2
TOTAL 3 _ OTHERS
The Top Left chart is the TOTAL chart and is the only one that includes BITCOIN and it is the ONLY one that is above all of its MA's
All of the other charts are heading into resistance on one or more MA's
ALT coins are sailing in to headwinds.
THIS DOES NOT MEAN THEY WILL GET REJECTEWD BUT IT OOES MEAN YOU SHOULD BE CAUTIOUS
Simple as that
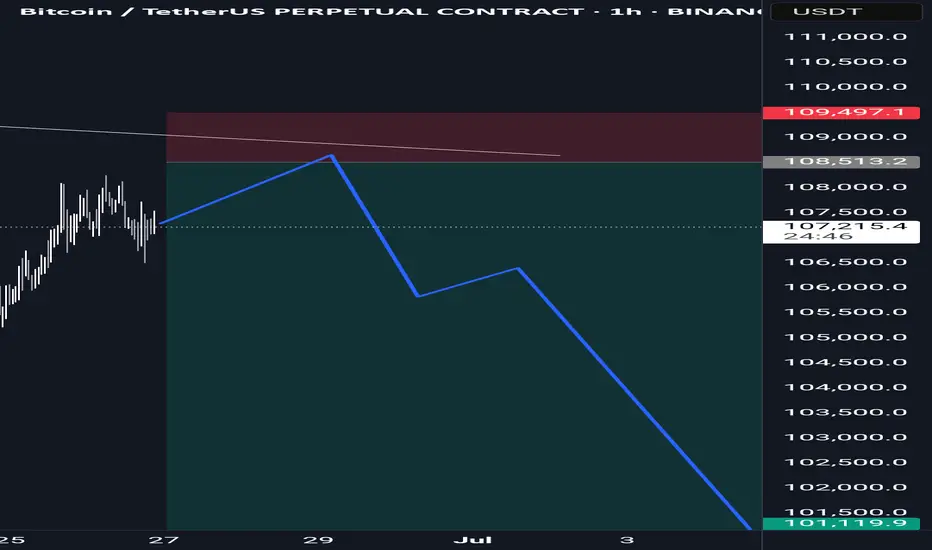
Bitcoin short position After my win streak from previous trades on btcusd I happy to give me to the people who followed me
Here's another great trade for you
Short Bitcoin with a limit order at 108,500
Take profit at 101k , stop loss at 109,500
A 7.5 to 1 risk reward ratio 🔥😉
You can never find anybody trade Bitcoin like me
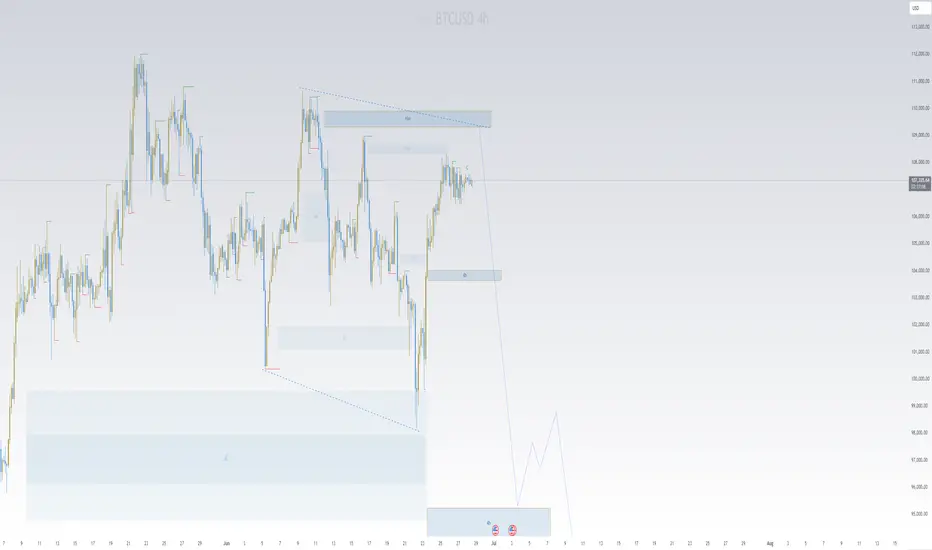
BTCUSD Trade Setup - 28/Jun/2025Hi Traders,
I expect this pair to go Down after finishing the correction.
1) Need to wait for market to show changing of the direction.
2) The first reaction zone foe me will be at 95000 level followed by 89000 level.
3) Need to observe the characteristic of the move coming down in order to understand if market is planning to go up without coming to those levels.
Current expectation for investing is to see market dropping to 89000 level and then start to look for entry.
I only invest in BTC so no shorts for me but market shows potential to give a reversal soon and give a decent down move.
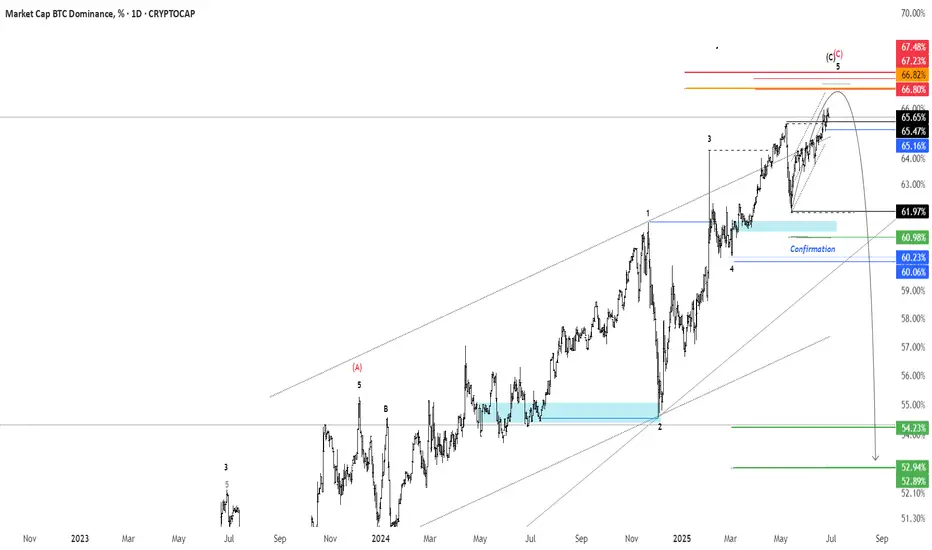
BTC.D - 1D Timeframereversal zone 66.8 : 67.2%
Confirmation : 60.23%
Targets : 52.94% / 31.03
invalid : 67.48%
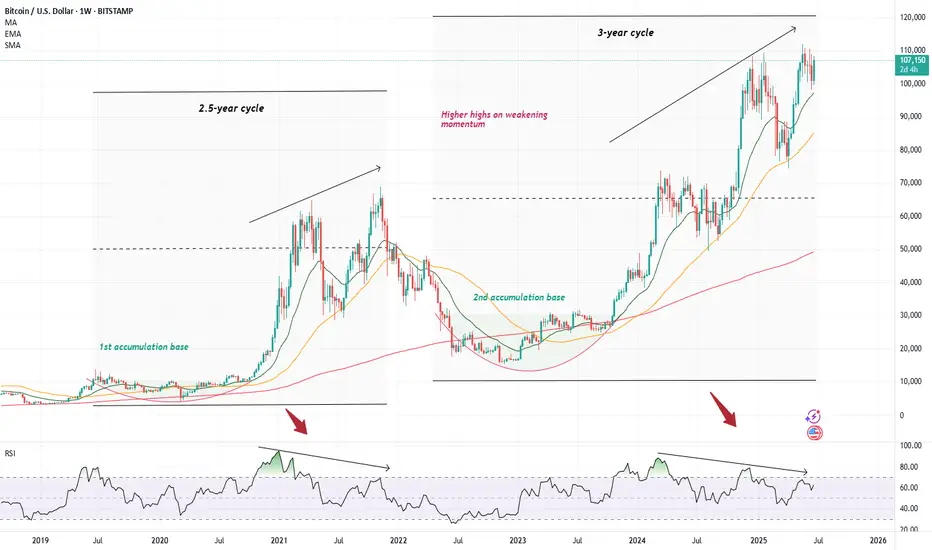
Cautionary tale on BitcoinI decided to temporarily depart from my usual trade ideas to wave a cautionary finger at the chart of Bitcoin, where I have noticed a rather worrying pattern within the weekly charts. However, before I delve in, I would like to stress that I am a very rigid believer in the long-term prospect of our monetary saviour and what I am supposed to write about only concerns the usual, inevitable cyclicality that always entails the otherwise upward-sloping trajectory of Bitcoin ( CRYPTO:BTCUSD )
Although overall this has not felt like much of a crypto bull run given the apparently absent performance of altcoins (apart from an occasional 1000x on a well-targeted memecoin), Bitcoin has, in the meantime, trod its usual path upwards. Since the '22 lows, it has mimicked its regular pattern where after a devastating plummet lower, it has spent several long months accumulating until it has burst out of its cocoon to provide a 6x return to its strong believer. However, the mimicking is almost too good as we have now started painting a very similar picture to what eventually transpired to be the '21 top. We have reached a strong above >100k top only to hit a vicious correction (announcement of tariffs), similar to what Bitcoin did in May of 2021 (China crackdown, tech selloff). The price then quickly consolidated - which I am not an avid fan of as a formation of a more robust base would be more preferable (though would take longer ) - and bitcoin shot back up again, quickly reclaiming the previous highs; just like it did in October/November 2021. This creates an unfortunate setup best represented by the series of lower highs on an RS I while the price keep climbing higher - creating the probably best-know bearish signal with higher highs built on weaker and less robust momentum.
We know how this ended in 2021, and I am not suggesting that Microstrategy should blow up, go bankrupt and sell all its bitcoin (though definitely a possibility) - however, one must admit that there are currently quite a lot of uncertainties that could unwind at any time (one such coming on July 8th with the second version of the lets-blow-up-the-stock-market day). With a stock market priced to perfection, and with what seems like a large pile of uncertainties hovering in the air, it seems like any one of these could light up the fire underneath these lovely valuations we have reached, and although I would love for cryptocurrency prices to be completely independent of the stock market, we usually know how this goes.
So, what to do about this? Preferably nothing . If you are as much of a believer as I am in the necessity of bitcoin in today's financial world, this is just another blip in an otherwise long and profitable ride. So, I won't be any selling any of it - hopefully only adding once we decline. I would also add that I am not expecting as much of a bloodbath as last time. I think Bitcoin has reached a point where the 80-90% declines become very rare. However, regarding my other allocations in crypto assets, I am not as optimistic, hence I decided to sell most of everything else. Although I love the premise of Ethereum, the chart looks pretty horrific, currently drawing a perfect head-and-shoulder on a 4h chart (which I might write about as well as a short idea).
I will end this essay the same way I started it - I know absolutely nothing, and maybe I will come back at the end of the summer, beautifully tanned and relaxed as we all are in Europe, and find everything at all-time highs. I just currently believe the risk-reward ratio is not skewed in my favour, and I don't know how about you, but I tend to listen to my probability gods, especially on the eve of another strong SPAC year .
BITCOIN - SHORT OPPORTUNITY AND LACK OF MOMENTUMBINANCE:BTCUSDT has been lacking momentum in the last few days. It looks to me that "Good News" is almost "No News" in regards to the Iran war or any crypto legislation. Summer is looking a lot like sideways movement, and due to the previous explosion in momentum and volume, I think the lack of it will bring the price down in the following days or weeks.
BTC.D ANALYSIS BTC.D – Daily Chart Analysis 🧠
Bitcoin dominance is forming a rising wedge pattern – a typically bearish structure.
We’re now at the upper resistance; a rejection here could trigger a strong move down, opening the path toward 56–57% levels.
If confirmed, altcoins might get temporary relief.
Watch for a break of the lower trendline for confirmation.
Not financial advice – DYOR

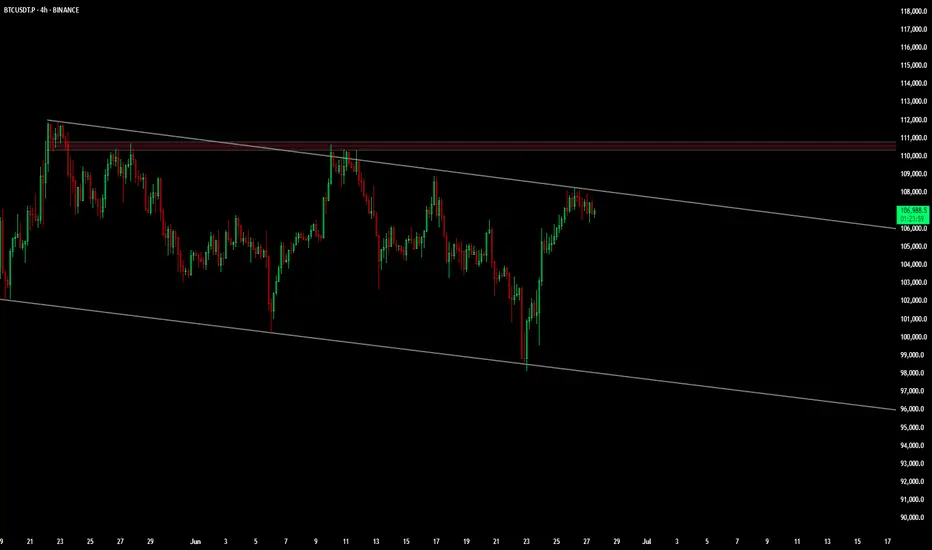
BTC 120K READY ???BTC 4H Chart Update 📉📈
Bitcoin is still trading inside a descending channel, but bulls are now testing the upper trendline for a potential breakout.
Price is consolidating just below $107K, showing strength after the recent bounce from the bottom of the channel.
🔹 Structure: Descending Channel
🔹 Current Resistance: $107K–$110K zone
🔹 Break & close above = bullish breakout confirmation
🔹 If breakout and close above 110k than this target possible
🔹 Target after breakout: $112K-120K+
⚠️ Rejection = pullback likely toward $103K–$104K support
📊 Breakout or breakdown — decision time is near!
#BTC #Bitcoin #Crypto #TechnicalAnalysis #BreakoutSetup
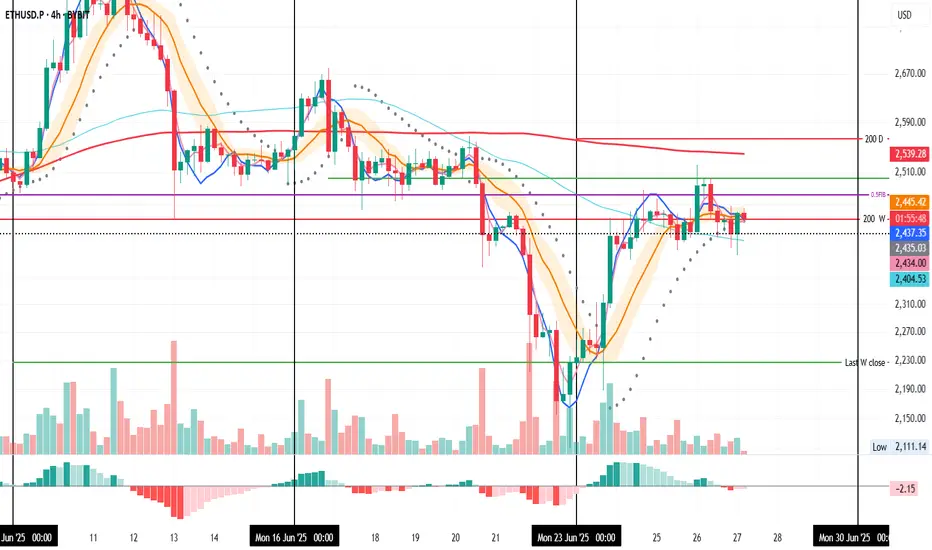
ETH 4H – Testing the 200W MA
ETH is trying to reclaim the 200-week MA on the 4H chart.
The last 4H candle closed right on top of it.
The first 4H bar from June 26 closed above the 0.5 Fib, but that level was eventually lost.
If the 200W MA holds as support, price may attempt to flip the 0.5 Fib into support again.
Always take profits and manage risk.
Interaction is welcome.
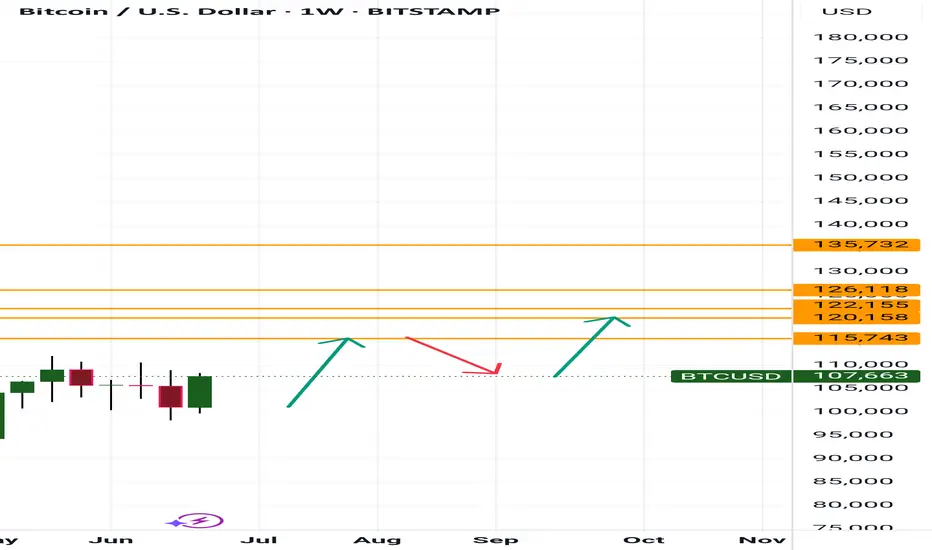
Bitcoin Drive up to 115k So currently BTC on the weekly and monthly is showing us a drive up to 115,700 then possibly seeing a correction major or minor then a drive up to 122k is what I am currently seeing at the moment
Kris Mindbloome Exchange
Trade Smarter Live Better
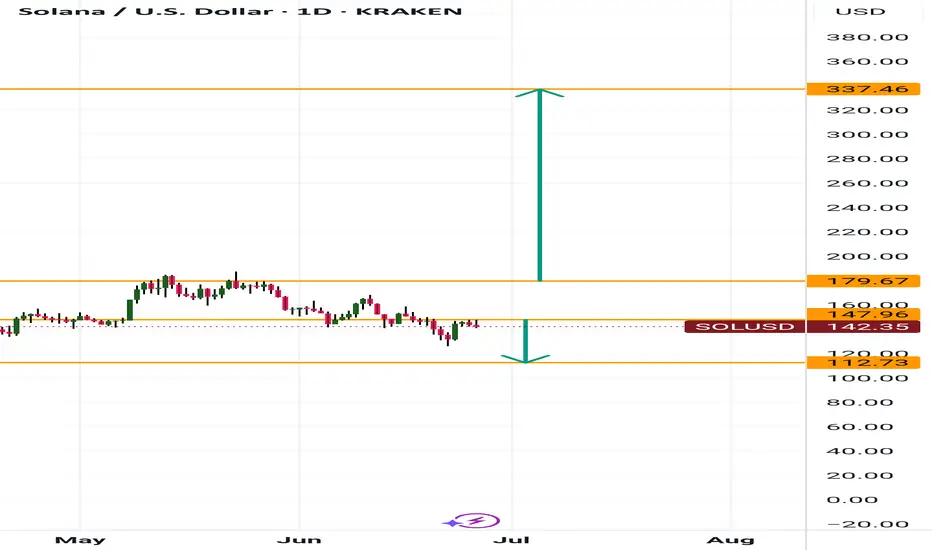
Solana Heading to 112 or 330+Hey fam
So for Solana if we hold under 148 then a drive down to 112 makes sense. However if we drive above 148 then we can possibly hit weekly targets of 330
Make sure you adjust accordingly in a smaller time frame to ensure your in the right move
Happy tradings folks
Kris Mindbloome Exchange
Trade Smarter Live Better
Under 148 we go to 112 if we break 148 we can see a drive up to 338
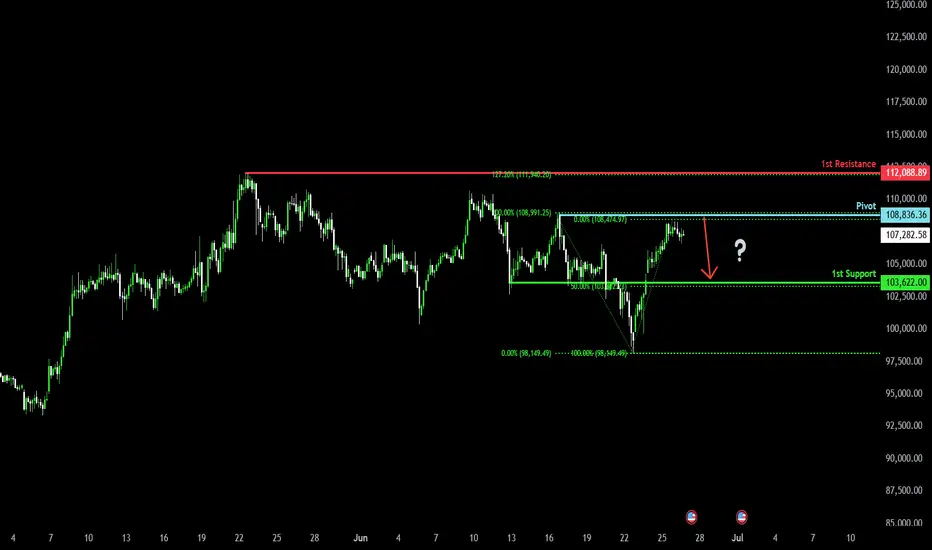
Bearish reversal?The Bitcoin (BTC/USD) is reacting off the pivot and could drop to the 1st support.
Pivot: 108,836.36
1st Support: 103,622.00
1st Resistance: 112,088.89
Risk Warning:
Trading Forex and CFDs carries a high level of risk to your capital and you should only trade with money you can afford to lose. Trading Forex and CFDs may not be suitable for all investors, so please ensure that you fully understand the risks involved and seek independent advice if necessary.
Disclaimer:
The above opinions given constitute general market commentary, and do not constitute the opinion or advice of IC Markets or any form of personal or investment advice.
Any opinions, news, research, analyses, prices, other information, or links to third-party sites contained on this website are provided on an "as-is" basis, are intended only to be informative, is not an advice nor a recommendation, nor research, or a record of our trading prices, or an offer of, or solicitation for a transaction in any financial instrument and thus should not be treated as such. The information provided does not involve any specific investment objectives, financial situation and needs of any specific person who may receive it. Please be aware, that past performance is not a reliable indicator of future performance and/or results. Past Performance or Forward-looking scenarios based upon the reasonable beliefs of the third-party provider are not a guarantee of future performance. Actual results may differ materially from those anticipated in forward-looking or past performance statements. IC Markets makes no representation or warranty and assumes no liability as to the accuracy or completeness of the information provided, nor any loss arising from any investment based on a recommendation, forecast or any information supplied by any third-party.
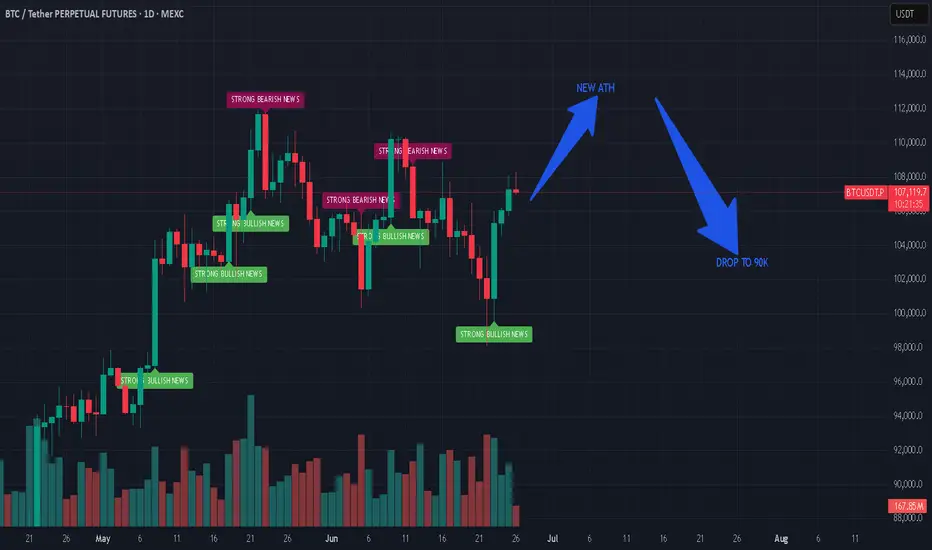
What's Next For Bitcoin?Bitcoin Eyes A New ATH In the Upcoming Days...
But Do Not Be Surprised If BTC Drops Back To 90K.
Studying Previous Cycles, Showed Massive Drop Before the Bull Run.
#bitcoin #crypto #btc #trading #trader #portfolio #technicalanalysis
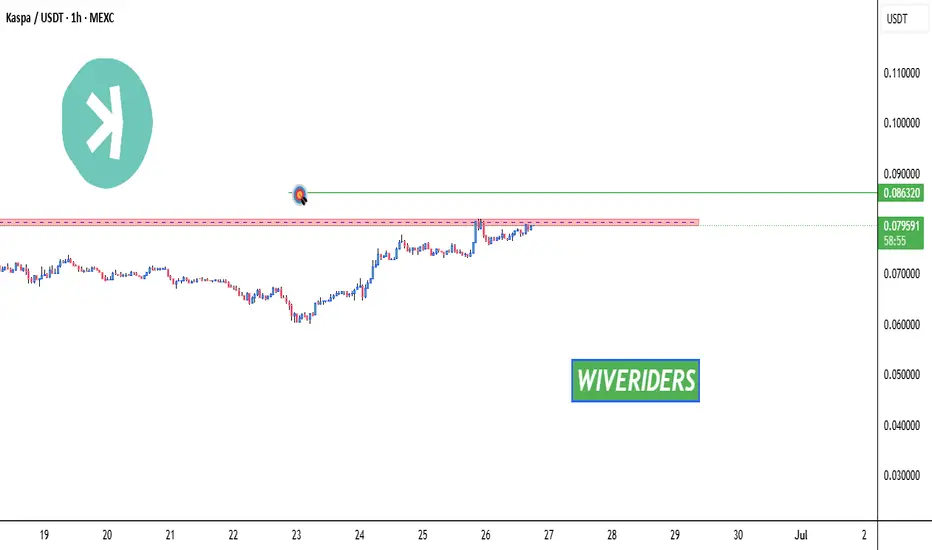
KAS IS TESTING RED RESISTANCE ZONE🚨 KAS Testing Red Resistance – Waiting for Breakout 📈
KAS is currently testing the red resistance zone.
If breakout is confirmed, the first target could be the green line level! 📊
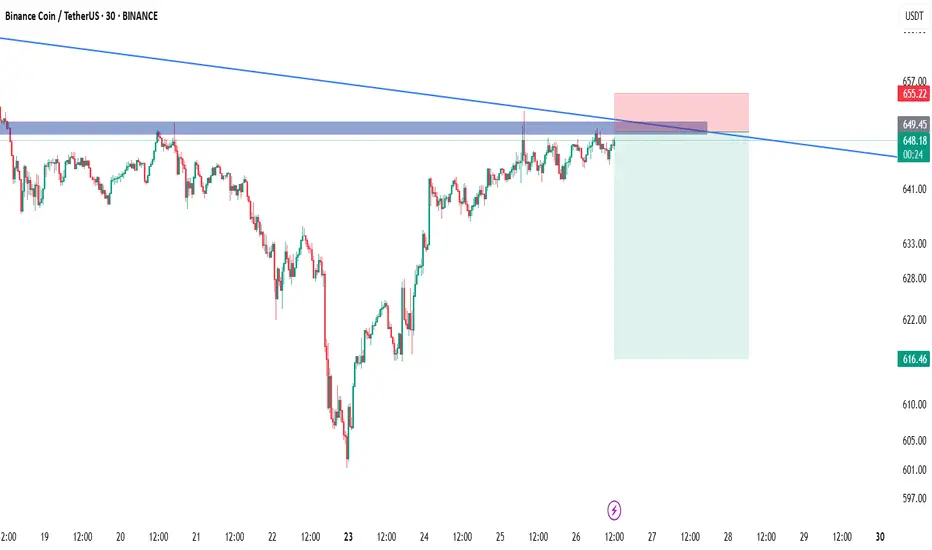
BNBUSDTPersonally, I see BNB struggling to break above that key resistance zone near 648–649. The rejection from that level, especially with decreasing momentum, makes me lean bearish in the short term. We’ve seen this zone hold back price before, and unless there's a strong breakout with volume, I think there's a higher chance we see a pullback toward the 616–618 area. I’m just watching price action closely and waiting for a clean confirmation—no need to rush a position when the structure’s already signaling hesitation.
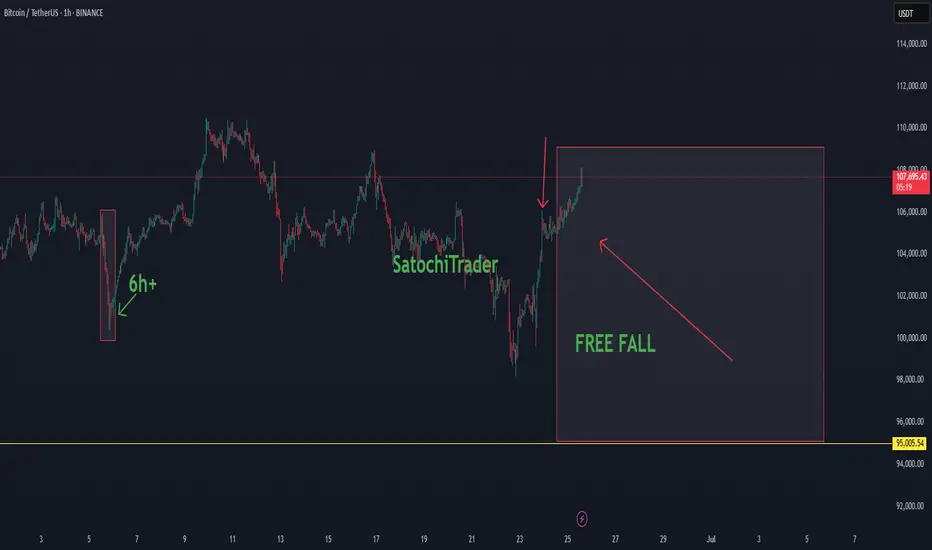
SatochiTrader Expecting a huge BTC CRASH AFTER This..BTC Market Update by SatochiTrader
EVERY CRASH DID START WITH A FALSE INCREASE TREND.
Depending on the market sentiment and price action, BTC is currently showing strength with a positive trend. However, based on deeper data and insights held by myself and a small group of early-cycle followers, this current movement may be a deceptive signal — potentially foreshadowing a major crash.
This is not trading advice. Those who are confident in the long position should continue, and those on the other side should stay prepared as well.
We have previously explained that the current cycle appears to have ended. Since 2013, BTC has consistently respected its macro cycle targets. The end of such a cycle typically leads to significant corrections.
A cycle ending implies not just a retracement, but the potential for a major crash. Hedge funds and real BTC whales understand the underlying indicators and risks at play. Our expectation remains clear: BTC may soon fall below the 100K level, with $85K identified as a critical support and target zone.
Stay sharp. Stay informed. The market may look bullish — until it isn't.
The best way to follow BTC is not the news.. but the cycle overview.
This update is an education update, which means the high expectations of the upcoming correction for BTC.
Compared to last quarter, miners are now less severely underpaid, though profitability remains low
ADA Long Swing Setup –Support Holding, Watching for Retest EntryADA has held the $0.50 support level over the past few weeks. If price retraces into the $0.53–$0.55 zone, we’ll be looking to enter a long spot trade from support for potential upside continuation.
📌 Trade Setup:
• Entry Zone: $0.53 – $0.55
• Take Profit Targets:
o 🥇 $0.64 – $0.66
o 🥈 $0.71 – $0.75
o 🥉 $0.80 – $0.84
• Stop Loss: Daily close below $0.51

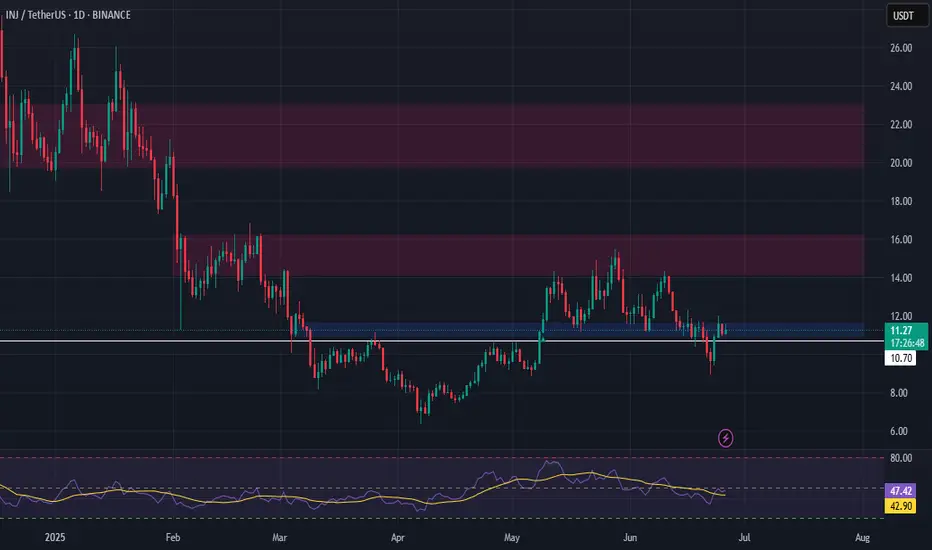
INJ Long Swing Setup – Breakout Retest Opportunity at Key LevelIf the crypto market pushes higher and INJ flips current resistance into support, we’ll be looking to enter on a retest of the $11.60 zone. This level could act as a launchpad for the next leg up.
📌 Trade Setup:
• Entry Zone: $11.60 – $11.60 (Breakout Retest)
• Take Profit Targets:
o 🥇 $14.20 – $16.25
o 🥈 $19.80 – $23.00
• Stop Loss: Daily close below $10.70
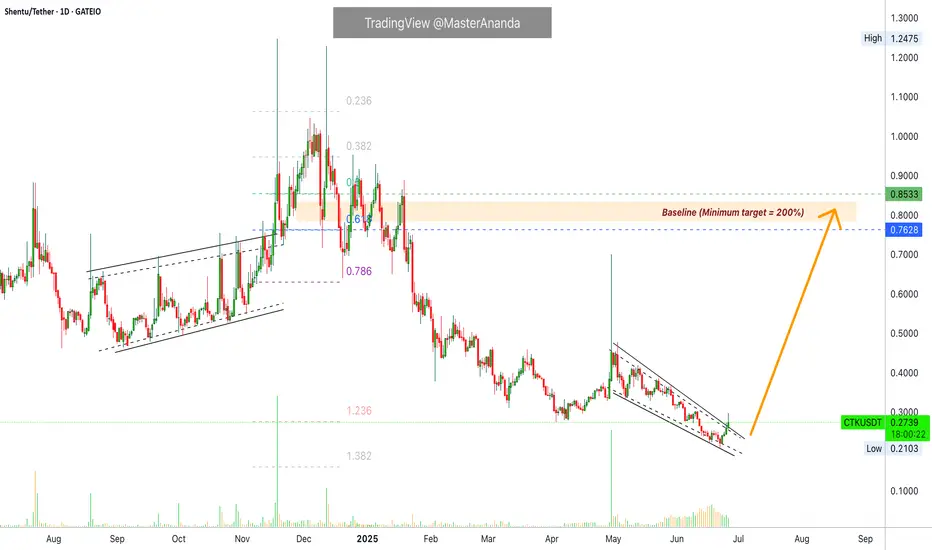
Shentu Back To Baseline, 200% Minimum, Fast!We have a very good chart setup here but I will focus on one target only and the short-term, "back to baseline."
Shentu is about to make a strong jump. One of those that can leave us with our mouths wide open. Similar to 30-April but without the rejection and lower low.
This time, the jump will result in long-term growth. Of course, there can be some daily growth first before this jump. The 200% profits potential target is the minimum, there is huge potential for growth, CTKuSDT, long-term. As well as mid-term. And I am telling you now about the short-term, so everything is pointing up.
The main low happened in April. The recent lower low is a form of consolidation with a bearish bent. This type of consolidation can produce higher lows or lower low but the end result doesn't change, which is a strong rise with a higher high compared to the last high.
This is one is good and already on the move. Four days green, but this is only the start.
Thank you for reading and good profits. It will be great.
Namaste.