EIGEN/USDT – Falling Wedge Breakout Setup | 4H ChartEIGEN is currently showing a bullish falling wedge pattern near a strong horizontal demand zone, indicating a potential reversal move.
Technical Breakdown:
Entry Zone: $1.17 – $1.18 (current market price)
Stop-Loss: Below $1.14 (last wick low/invalidation of wedge)
Target Price: $1.74, $2.51 (+118%) from CMP
Resistance 1 (Minor): $1.33
Resistance 2 (Major Target): $1.74
Support Levels:
• $1.17 (Immediate support)
• $0.749 (Major demand zone if breakdown)
Target & Risk-Reward
Target Price: $1.74, $2.51 (+118%) from CMP
Stop-Loss: $1.14
Risk per token: ~$0.03
Potential Profit per token: ~$0.56
Risk:Reward Ratio: ~1:6.5
Potential Gain: +118% from entry
Indicators:
Falling wedge breakout looks imminent
RSI (14) at 39.5 — recovering from oversold zone
Demand zone previously triggered rallies — the probability of a bounce is high
Strategy:
Wait for a 4H candle close above the wedge trendline + volume confirmation to validate the breakout. Scaling in near support with a tight stop-loss can offer a strong risk-reward play.
Not Financial Advice – This is a technical view for educational purposes. Always DYOR & manage risk accordingly.
Like & follow if you found this useful!
#EIGEN #Altcoins #Breakout
Cryptomarket

Cardano UpdateA lot of you have been DMing me asking for altcoin analysis. i hear you, but here's the truth:
- Right now, most altcoins are simply too weak to offer a reliable forecast. I prefer to post when timing makes sense, not just for engagement, but to avoid misleading anyone.
- BTC Dominance is still heavily suppressing the altcoin market, and I’d rather wait than risk rekting my followers with premature calls.
So why do I post about Cardano? :
- Simple, Cardano is one of the most established altcoins. It makes sense to track its evolution alongside Bitcoin and Ethereum. When you're analyzing the broader market cycle, starting with BTC, ETH, and ADA gives meaningful context. Newer cryptocurrencies from 2020+ don’t have the same historical data, which makes reliable analysis much harder.
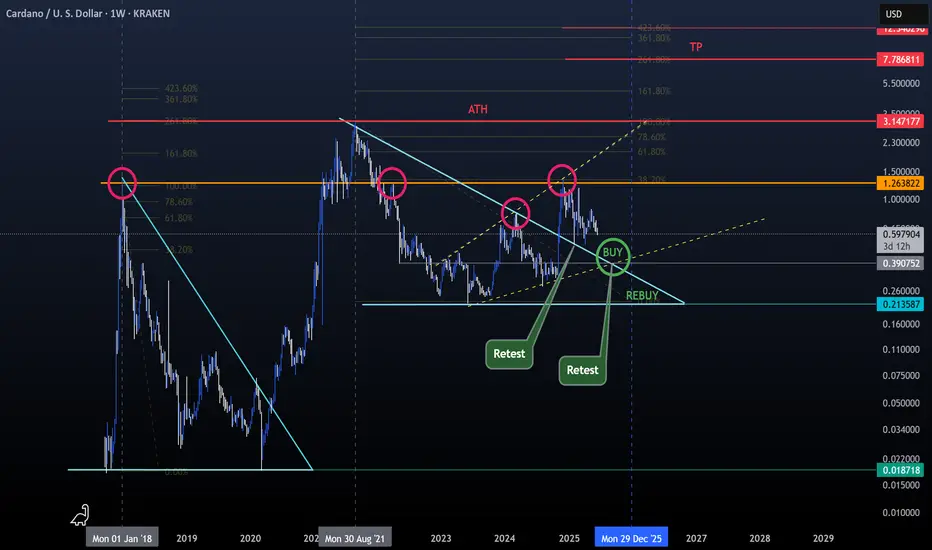
Back to Trading (Everything is marked on the chart for easier reading) :
- Cardano got rejected around $1.25, which aligns with its 2018 ATH, a key historical resistance.
- Check the bullish megaphone pattern and how it connects with the trendline and that $1.25 level (marked with yellow dotted lines).
- Also observe the minor bounces and retests above the bearish triangle trendline (light blue).
What we can do now?
- Nothing. If BTC dips, altcoins will likely follow and get rekt.
Best strategy for now:
- Consider setting a buy order around $0.41 (don’t go all in).
- Keep some dry powder in case of further downside, potentially to rebuy around $0.21 if pressure continues.
Be wise, be patient, ride the wave, don’t fight it.
Happy Tr4Ding !
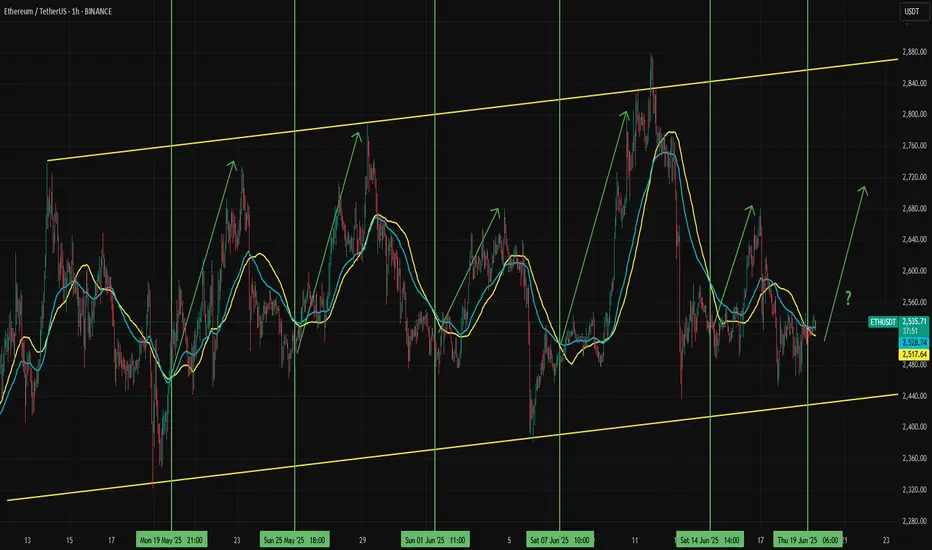
Potential Long Setup for EthereumEther stabilized in a slightly positive trend after breaking the previous uptrend. Since mid-May, this flattish trend channel has continued, offering some trading opportunities within it.
When Ethereum approaches the lower line and the 50 EMA crosses above the 50 SMA, an ETHUSDT surge has followed each time since the channel formed. Traders could expect a similar move again. However, the key risk is potential negative pressure on stock markets due to geopolitical concerns and the correlation effect on the crypto market and a break of the channel.
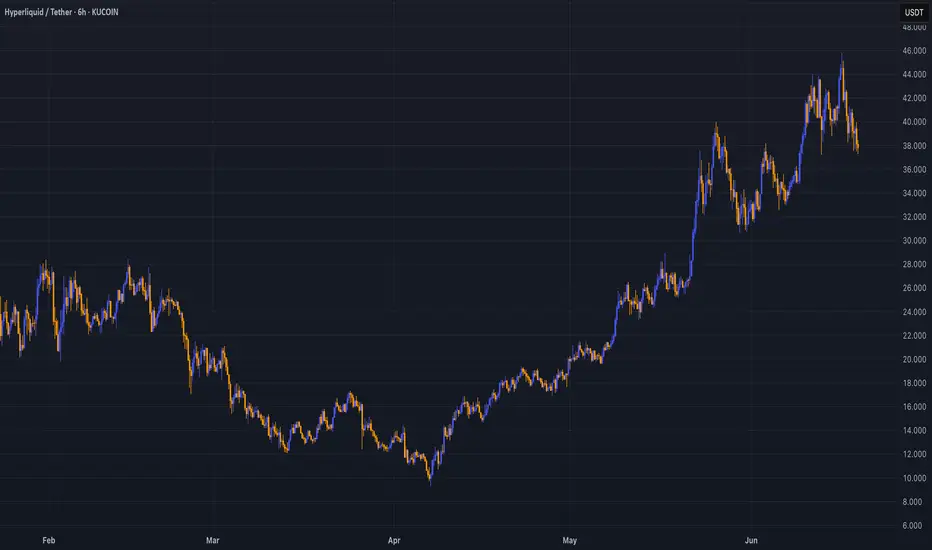
Where Is The Real HypeThis latest crypto cycle has been the hardest to navigate for even the most experienced crypto traders. No real Altcoin season has transpired, maybe best reflected by the fact that over 2 years into it, Ethereum still has not seen a new All-Time-High. That is not to say that there have not been winners. Hyperliquid, the 'decentralized' perpetuals exchange has taken the market by storm. The word 'decentralized' is in inverted commas as the extent of decentralization for the platform is debatable but starting with UX and product first, and arguably bringing in decentralization later, has so far proven to be winning strategy. The performance of the project's native token HYPE has been one of the few bright lights in this market.
HYPE, the token, launched in what is an immaculate conception in crypto terms: no VCs who got in at better price levels, an airdrop that heavily rewarded the community, revenue-driven token buybacks. The project is a case-study on how to succeed in today's crypto world. Perpetuals trading is one of the core use-cases for crypto. Enabling perpetuals trading for jurisdictions where it is banned for retail via 'decentralization' is regulatory arbitrage at its best. Luckily, regulation-wise, the stars seem to have aligned. At the same time, crypto traders have been overwhelmed by large supplies of tokens dumped on the market at unfavorable terms for retail investors. Non-crypto retail on the other hand has been burned one too many times by mingling in our industry and has so far stayed out. Consequently, the vast majority of crypto tokens has simply not gone anywhere in this cycle so far.
Where non-crypto retail funds go becomes visible when looking at the performance of various stock indices, pennystocks and even crypto-related stocks including Microstrategy. Even despite economic uncertainty and war, stocks are at all-time highs. On the institutional side, funds and tradfi have been playing the crypto-leverage game via instruments they are familiar with. We have spoken about Michael Saylor's strategy of borrowing funds to buy more Bitcoin many times in this newsletter previously. Other companies have copied the Microstrategy playbook in increasing numbers. 151 publicly traded companies now hold Bitcoin.
Meanwhile, the less 'degen' side of tradfi has focused its attention on stablecoins. The so-called 'GENIUS' Act to regulate stablecoins has just passed the US Senate with bi-partisan support. The performance of Circle's stock after its recent IPO is the best example for the growing Tradfi excitement over Stablecoins. A 5x return in a little over a week may remind crypto traders of happier days. It is certainly not the norm in Tradfi world. Stripe, the Fintech giant, has been acquiring crypto infra players including Bridge and Privy. Shopify has enabled stablecoin payments. Adoption comes slowly, then all at once.
As the worlds of crypto and Tradfi continue to merge, opportunities for traders will continue to present themselves. We may be facing a quieter period in crypto markets right now. But the lessons of HYPE's immaculate conception are being studied by teams and founders around the industry. Inevitably, the possibilities of permission-less onchain finance will sooner or later lure back the traders. Until then, good luck looking for the next hype.
SOL/USDT Rejected at Key Fib Zone – Bulls’ Last Stand at SupportRecap and Bias
The short-term bullish “orange” bounce scenario from the previous analysis failed to materialize. Solana’s price was rejected near 150, printing a lower high, and has since dropped back into the mid 140s. This confirms that the recent rally was a dead-cat bounce rather than a trend reversal.
The updated bias is cautiously bearish. This stems from rejection at resistance, weakening momentum, and a deteriorating volume profile. Unless price reclaims the 148 to 150 zone with strength, the bears remain in control. Only a decisive breakout above that level would shift the short-term outlook back to bullish.
Macro Context
Global risk sentiment remains fragile. The sudden escalation between Israel and Iran in early June, including reports of missile strikes, sparked a flight to safety. Solana’s rally quickly reversed, with price dropping over 15 percent since June 11.
Other geopolitical flashpoints also continue to weigh on investor confidence. The protracted war in Ukraine and ongoing disruptions in Red Sea trade routes have fueled broader market caution. This is contributing to periodic risk-off moves and spikes in volatility across both traditional and crypto markets.
On the economic side, uncertainty around US monetary policy is adding to pressure. Although May inflation cooled slightly, investors remain cautious ahead of upcoming Fed decisions. Crypto assets have traded weakly into these events, reflecting a wait-and-see approach.
Taken together, this geopolitical and macroeconomic backdrop is driving elevated short-term volatility and a higher risk premium in the crypto space. In this context, market participants are increasingly hesitant to take large directional bets without a clear catalyst.
One such catalyst may be the potential approval of a Solana ETF. Optimism has grown, with prediction markets now placing the likelihood of approval near 76 percent by late July. If approved, this could be a game-changing event that re-rates SOL’s medium-term valuation and breaks it out of its current downtrend.
Until then, traders should remain cautious and assume headline risk is elevated.
Multi-Timeframe Technical Outlook
Daily and 4H Trend
The high timeframe structure shows a clear downtrend. Lower highs and lower lows are intact. A double top formation from May broke down cleanly. Most recently, Solana was rejected at a key Fibonacci confluence zone around 149 to 151, which included the 0.618 retracement, the 20-day SMA, and a well-defined supply zone.
After that rejection, SOL has traded along the lower Bollinger Band with increasing volatility. The 20 SMA is now acting as dynamic resistance. All major trendlines have broken.
2H, 1H, and 30m Perspective
Shorter-term charts show SOL attempting to base near 143 to 145 support. Several oversold RSI conditions have triggered bounces, but these have lacked momentum. Harmonic pattern recognition shows that a bearish Deep Crab completed near 152, which marked the local top.
Currently, price remains pinned below descending trendlines and the 1H 20 EMA. Bullish momentum has yet to reappear in any meaningful way.
Key Technical Factors
Resistance: 149 to 151
This zone holds multiple levels of confluence. It includes the 50 to 61.8 percent retracement of the last swing, a 1.272 Fib extension, the 20-day SMA, and prior supply. The rejection at 151.7 was sharp and decisive. Unless price reclaims this zone, it remains a ceiling.
Support: 142 to 145
This is the last meaningful support zone holding price up. It is the neckline of a 12H Head and Shoulders pattern and the base of a previous multi-week range. It also coincides with the lower bound of a prior rising channel. The 50-day MA and 0.236 Fib retracement are also near this zone. If this area breaks, sellers will likely target 130 to 135 next.
Momentum: RSI 14 with MA Overlay
Daily RSI rolled over from above 70 with bearish divergence as price topped. RSI is now below its MA across all timeframes, reflecting negative momentum. On the 4H chart, RSI dipped below 30 and remains weak despite minor relief bounces. Lower timeframes show early divergence but no confirmed reversal signals.
Trend Structure
Price continues to make lower highs and lower lows. The 200-day MA was lost weeks ago. The 50-day is now flattening near 140. A death cross recently printed on the 12H chart, confirming bearish short-term pressure.
Volume and PVT
Volume favors the bears. PVT is in decline, showing more volume on down days than up days. The rally to 150 occurred on weak volume, while selloffs continue to show increasing size. This signals distribution, not accumulation.
Harmonic Patterns
A bearish Deep Crab pattern completed at the recent high. No bullish harmonics are confirmed yet. Traders should monitor the 130 to 125 zone for potential bullish completion patterns like a Gartley or Bat. If those form with oversold signals, they could mark the bottom.
Green Scenario: Bullish Breakout Path
Bias
Only valid on confirmed breakout
Trigger
Break and hold above 150. Ideally, an hourly close above 150 or daily close above 152 confirms the move.
Confirmation
Rising volume, RSI reclaiming 50, and a PVT uptick. A retest of 148 to 150 from above would reinforce the breakout.
Targets
First target is 155, which aligns with the 12H 50 EMA.
Second target is 162 to 165.
Extended targets include 170 to 180 and eventually the 200 psychological level if ETF news hits.
Stop Loss
Below 147 or back inside the 143 zone would invalidate the breakout and suggest a failed move.
Logic
If bulls reclaim 150 with strength, this would invalidate the lower-high structure. Shorts would begin covering and momentum could quickly shift. Breakout entries should focus on confirmation and volume expansion.
Red Scenario: Bearish Breakdown Continuation
Bias
Default scenario
Trigger
Clean break below 142. Daily close under 140 confirms the H and S neckline break.
Confirmation
Failing retests of 142, rising sell volume, and RSI staying suppressed. Price action showing impulsive red candles validates the move.
Targets
First target is 130 to 135.
Second target is 115 to 120.
Final measured move would project into the 100 to 110 zone if trend acceleration continues.
Stop Loss
Any reclaim of 145 to 148 would likely invalidate the breakdown and trap late sellers.
Logic
If this support fails, shorts will press. Bounces will likely be sold into. Traders can enter on the break or the first failed retest of 142. Consider scaling out near 135 and trail stops from there.
Strategy Summary
Current Bias
Leaning bearish unless bulls reclaim 150
Key Levels
148 to 150 is breakout zone
142 to 140 is breakdown zone
Trading Strategy
Range traders can play 144 to 150 but must be nimble
Breakout traders should wait for confirmation above 150
Breakdown traders can short under 140 with stops over 145
Risk Management
Volatility is elevated. Trade smaller size. Use tight stops and trail them. Wait for confirmation, not anticipation. Watch ETF news closely. If delayed, expect continued weakness.

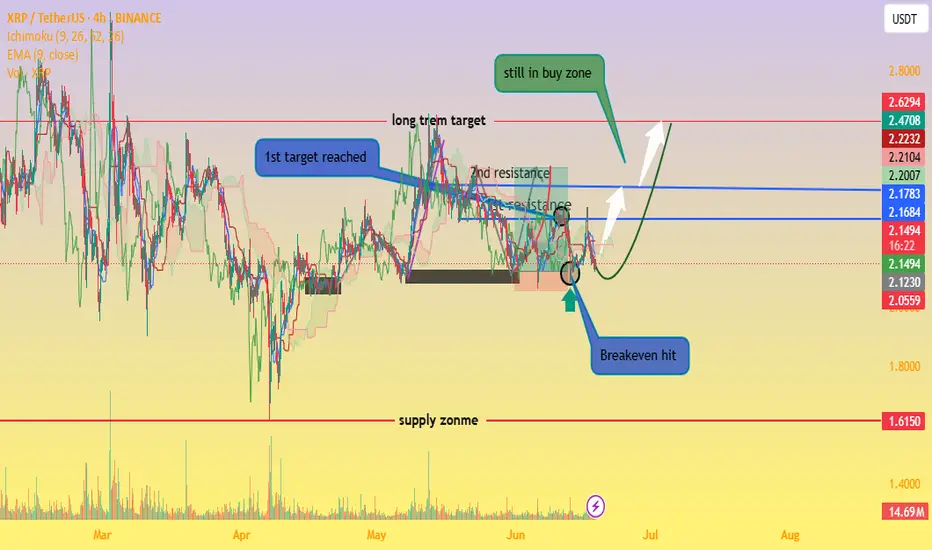
XRP Still in Buy Zone – Eyes on $2.50+our chart clearly marks that XRP has bounced off a strong buy zone (around the $2.10–$2.15 range), aligning well with a classic setup: price hitting support, creating a small base, and starting an upward rotation. 👇
Support area respected – The highlighted circle shows XRP revisiting the demand zone and quickly rebounding, very bullish behavior.
Lower wicks & volume spike – Indicate absorption of selling pressure and possible institutional interest.
Green arrow projection – Suggests a break above the immediate resistance (~$2.17 EMA/Ichimoku levels) could trigger a rally toward the next resistances around $2.22, $2.47, and potentially $2.63.
“Still in buy zone” annotation – Absolutely valid: as long as XRP stays above that key base ($≈$2.10), the bullish case holds.
🔍 Market Context
Range consolidation between ~$2.10–$2.30 has been the dominant theme, awaiting a breakout catalyst (e.g., ETF approvals or legal clarity)
thecryptobasic.com
+14
fxempire.com
+14
crypto.news
+14
.
Analysts highlight a falling wedge and support zone between $2.00–$2.20—if price holds, a move toward $3–$4 is plausible .
A range-bound weekly outlook anticipates a push toward $2.50 resistance before exploring higher targets .
✔️ Summary
Buy zone holding: Bullish pattern confirmed with rebound from support.
Key resistance levels: Watch for a breakout above $2.17/EMA and then $2.22–$2.30/$2.50.
Ideal strategy: Maintain position above support; add on breakout, targeting $2.50–$3.00.
Risk points: A drop below $2.10 could test $2.00 or even $1.85 support.
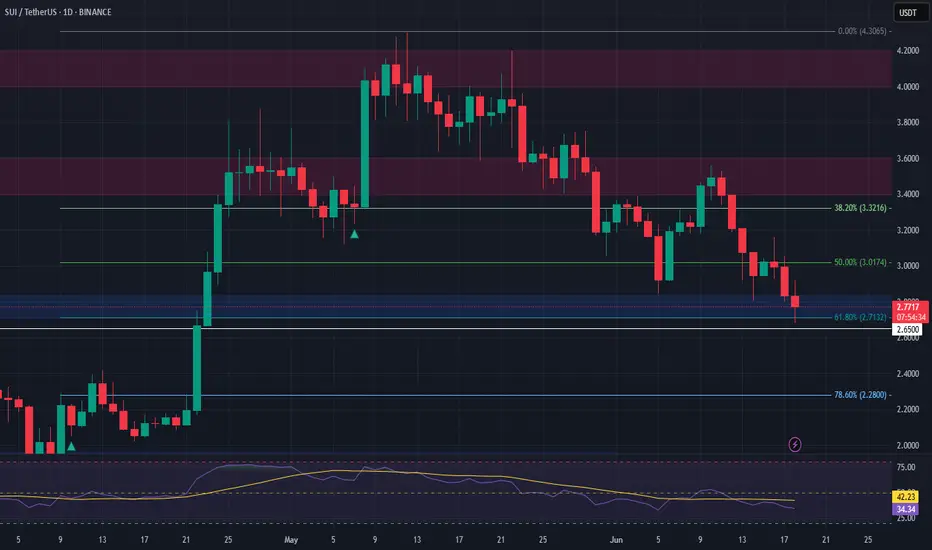
SUI Long Swing Setup – Confluence of Support and Fibonacci LevelSUI has pulled back into a key confluence zone, aligning with both the 61.8% Fibonacci retracement and horizontal support. We’re now eyeing the $2.70–$2.80 area for a potential long entry.
📌 Trade Setup:
• Entry Zone: $2.70 – $2.80
• Take Profit Targets:
o 🥇 $3.40 – $3.60
o 🥈 $4.00 – $4.20
• Stop Loss: Daily close below $2.65
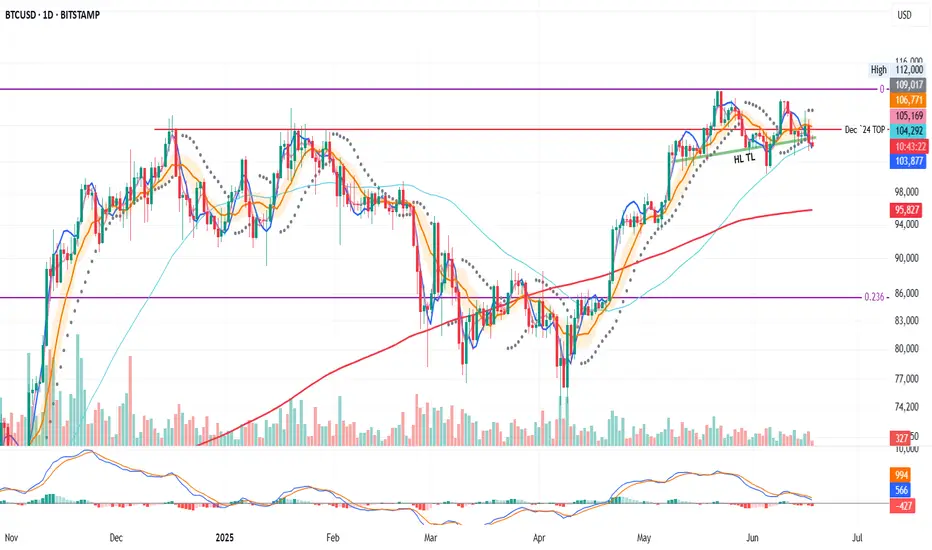
BTC on the Daily: Bearish Structure Locked In?So, on the daily, price is in a clear bearish context.
PSAR is bearish
MLR < SMA < BB center
We're about to close below the 50MA
Price already broke below the Higher Lows trendline and the December 2024 top
At this point, it all depends on the macro situation and the FOMC tone tonight.
If the outcome is positive, there's a chance price rebounds.
If not, the chart looks ready to dive.
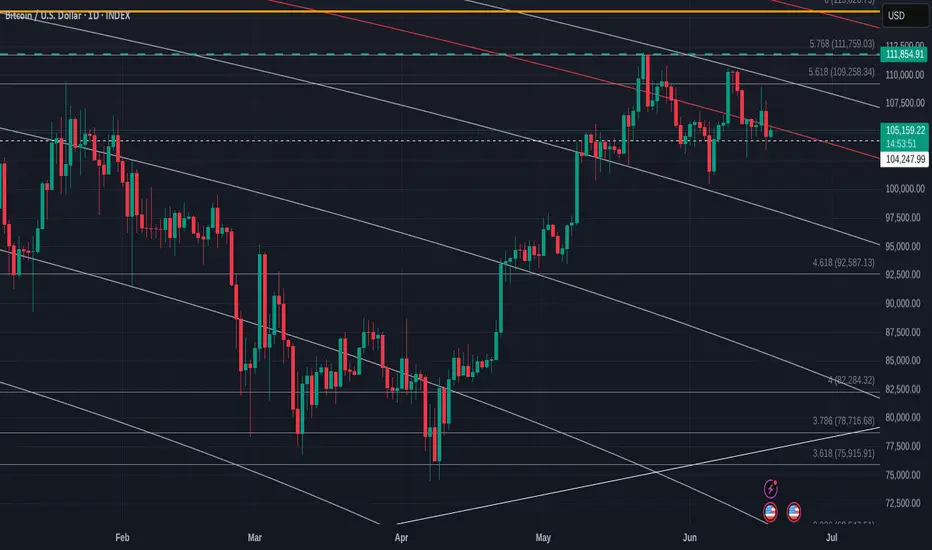
Bitcoin Daily Linear chart getting Squeezed on FED day - Caution
Those Fib circles are showing their strength again.
See how PA is pushed by them 99% of the Time.
And right now, we see PA ina tight Squeeze between horizontal Local support and that falling red 236 fib circle.
The Apex of that Bearish pennant is near the end of this month.
And, Today, depending on how Markets react to the FED Rate decision, PA could break away from this
A Push higher will meet resistance around 109K
A Drop lower would find support around 100K - 98K
And if I am going to show a Bearish side, a drop to the 4.618 at 92K is VERY possible given Macro events
We live in Hope that the Bulls Will show up
At the moment, Bitcoin is hovering around the newly created FVG.🚨 BITCOIN MARKET UPDATE 🚨
Bitcoin has recently broken below the previous BPR (Balanced Price Range), signaling a significant shift in market structure. Along with this breakdown, a Bearish Fair Value Gap (FVG) has also formed — a strong indication that the market may be preparing for a further move to the downside.
📉 What This Means:
The break below BPR, combined with the emergence of a bearish FVG, suggests that bearish momentum is currently in play. This is often a sign that the market intends to seek out lower liquidity zones, potentially targeting new lower lows.
🔎 Current Setup:
At the moment, Bitcoin is hovering around the newly created FVG. If price retraces into this zone and gives us a clear bearish confirmation (such as a rejection candle, bearish engulfing, or other MSS confirmation), it could provide a high-probability sell opportunity.
🎯 Target:
The primary target would be liquidity below the most recent lower lows.
⚠️ Risk Management Reminder:
Always wait for proper confirmation before entering a trade. These setups are best traded using MSS (Market Structure Shift) or BPR strategies for higher probability outcomes.
📚 DYOR — Do Your Own Research!
Trading involves risk. Ensure you have a strategy in place and never trade blindly.

XRP: You Have What it Takes, Success is Yours!It seems XRP has been trading at the same price for more than 7 months. The mean price since XRP broke above $2 back in December 2024.
Can you see what I am referring to? Good if you do.
If you don't, continue reading, everything will be clear in a few seconds.
Price action
Is neutral price action at this point bearish or bullish?
Bullish.
Most of the action has been happening above $2 and this is clearly bullish.
The upswings are bigger than the down-swings.
Buy volume is higher than sell volume.
The main move is an advance that started in November 2024.
The bigger picture and major trend is bullish.
The fundamentals are getting better everyday; there is nothing bearish on this chart.
Where to next?
New all-time high and higher prices.
How to approach the market
Start with 3-5X. When the bullish action is fully confirmed, the market starts to move higher supported by high volume and marketwide wide action, go all-in. That's the only way to win.
Make the winners pay big. Keep the losers small.
If you don't take risk you can't win in this or any other game.
Thanks a lot for your continued support.
Trading tips
Only risk money you can afford to lose and make sure to do a calculated risk. Not crazy risk nor gamblers risk. 2-3X. As the market advances, 3-5X. When the trend is confirmed, go higher and continue to increase until you max everything out. When our target hits sell everything and never look back. You can buy again when there is a crash or a retrace. Opportunities are endless.
If you secure profits and the pair continues to grow; who cares! Buy one that is safe and secure. Buy a new one that is trading low. Don't go back to the same pair just because you won. Detach. Take some time out. Secure profits. Comeback refreshed and the market will bless you with endless opportunities, it is not going away.
Motivation
Just make sure to win-win-win.
If you can win small, you will eventually win big.
Win, win, win. Make a habit of winning.
Go step by step.
Many people overestimate what they can do in a year but underestimate what they can achieve in a decade. Think long-term.
Instead of tomorrow, next week or next month, think how much money you are going to make in a decade if you start preparing now. What if everything you are doing does not need to yield an instant result? Now you can relax your mind. It will all come to you, but let it come, there is no rush.
Even if you hurry, life will continue to give you what you need, what you earned and not what you think is best. Whatever situation you are in right now is the result of past action. Take responsibility and watch everything grow.
Your future can change if you make the right choices today. You can change everything, start now; what can I do today to make my day better? What is the best action to take? Should I go out and get drunk, sniff a bunch of drugs, or, should I exercise and eat clean, do what it takes to reach my goals?
Choose wisely and watch your profits grow.
Whatever results you get when trading is just a reflection of your mind and the choices you make in your day to day live. Belief and take control.
You have what it takes.
Success is yours.
Namaste.

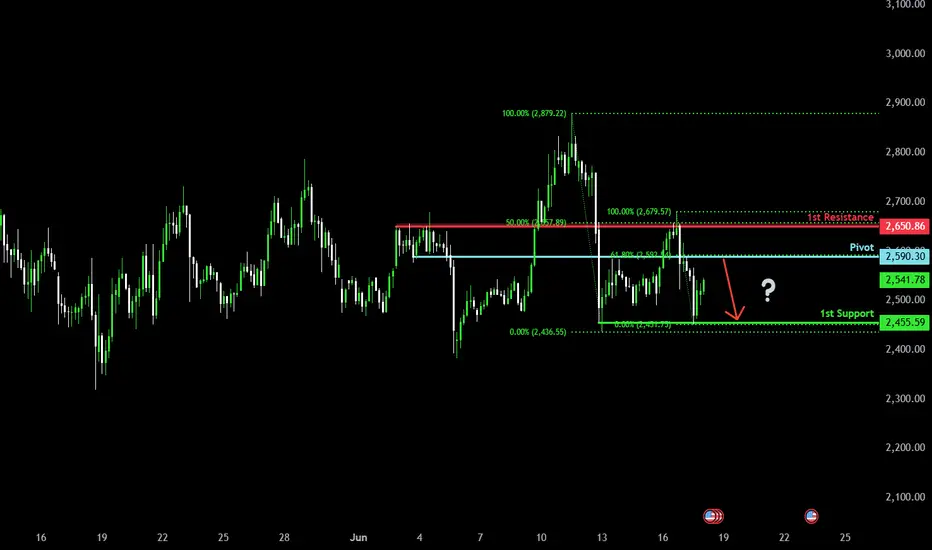
Potential bearish drop?Ethereum (ETH/USD) is rising towards the pivot and could reverse to the pullback support.
Pivot: 2,590.30
1st Support: 2,455.59
1st Resistance: 2,650.86
Risk Warning:
Trading Forex and CFDs carries a high level of risk to your capital and you should only trade with money you can afford to lose. Trading Forex and CFDs may not be suitable for all investors, so please ensure that you fully understand the risks involved and seek independent advice if necessary.
Disclaimer:
The above opinions given constitute general market commentary, and do not constitute the opinion or advice of IC Markets or any form of personal or investment advice.
Any opinions, news, research, analyses, prices, other information, or links to third-party sites contained on this website are provided on an "as-is" basis, are intended only to be informative, is not an advice nor a recommendation, nor research, or a record of our trading prices, or an offer of, or solicitation for a transaction in any financial instrument and thus should not be treated as such. The information provided does not involve any specific investment objectives, financial situation and needs of any specific person who may receive it. Please be aware, that past performance is not a reliable indicator of future performance and/or results. Past Performance or Forward-looking scenarios based upon the reasonable beliefs of the third-party provider are not a guarantee of future performance. Actual results may differ materially from those anticipated in forward-looking or past performance statements. IC Markets makes no representation or warranty and assumes no liability as to the accuracy or completeness of the information provided, nor any loss arising from any investment based on a recommendation, forecast or any information supplied by any third-party.
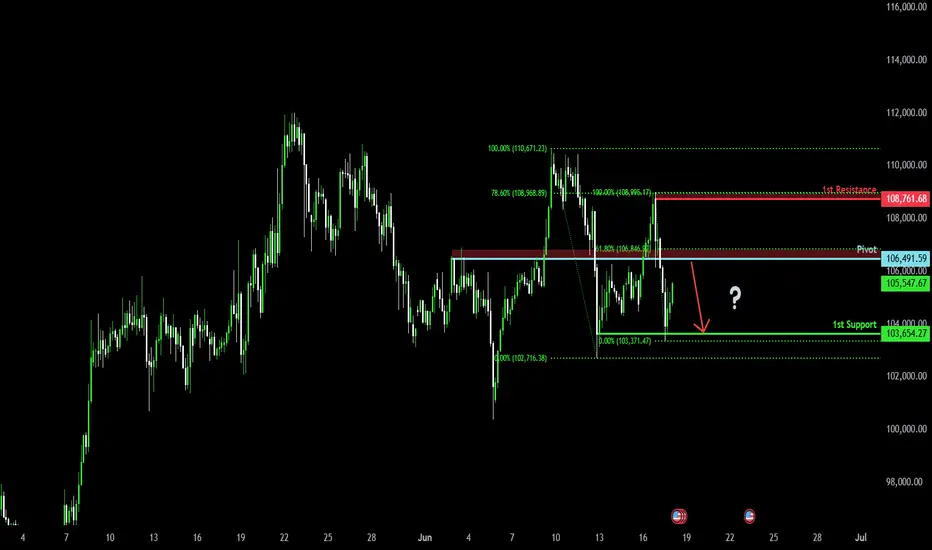
Bearish reversal?The Bitcoin (BTC/USD) is rising towards the pivot which is a pullback support and could reverse to the 1st support which is also a pullback support.
Pivot: 106,391.59
1st Support: 103,654.27
1st Resistance: 108,761.68
Risk Warning:
Trading Forex and CFDs carries a high level of risk to your capital and you should only trade with money you can afford to lose. Trading Forex and CFDs may not be suitable for all investors, so please ensure that you fully understand the risks involved and seek independent advice if necessary.
Disclaimer:
The above opinions given constitute general market commentary, and do not constitute the opinion or advice of IC Markets or any form of personal or investment advice.
Any opinions, news, research, analyses, prices, other information, or links to third-party sites contained on this website are provided on an "as-is" basis, are intended only to be informative, is not an advice nor a recommendation, nor research, or a record of our trading prices, or an offer of, or solicitation for a transaction in any financial instrument and thus should not be treated as such. The information provided does not involve any specific investment objectives, financial situation and needs of any specific person who may receive it. Please be aware, that past performance is not a reliable indicator of future performance and/or results. Past Performance or Forward-looking scenarios based upon the reasonable beliefs of the third-party provider are not a guarantee of future performance. Actual results may differ materially from those anticipated in forward-looking or past performance statements. IC Markets makes no representation or warranty and assumes no liability as to the accuracy or completeness of the information provided, nor any loss arising from any investment based on a recommendation, forecast or any information supplied by any third-party.
Tranchess Bull Flag... Do You Agree?This one here is also a bull flag, a wide one and you know where prices are headed next.
Let me ask you a question and be honest; do you have any doubts about what I am saying? You can answer in your own mind of course but just think about it.
I say the market is bullish but consolidating.
I say the market produced a retrace, in some cases a correction, which will only lead to higher prices.
I say this based on the information that is available through the charts and I share all the charts with the evidence.
Do you agree?
I am an optimist.
To me, I have 100% level of certainty but what about you?
I was right about the rise from April but that seems already to be far away. Do you believe me? Do you trust me? Do you know what will happen next? It is written all over the charts.
If you do, then you have to take action.
Money is on the table, and this is a money game.
If you agree and you can see what I see, how will you proceed to maximize profits?
What actions can you take now to maximize your earning potential and increase your trading success?
If you know the market is going up, then, you have to take action that goes in accordance with what you know.
First you read.
Through reading we learn.
We use the gained knowledge to achieve our goals.
Thanks a lot for your continued support.
Oh, and by the way, Crypto is going up.
Namaste.

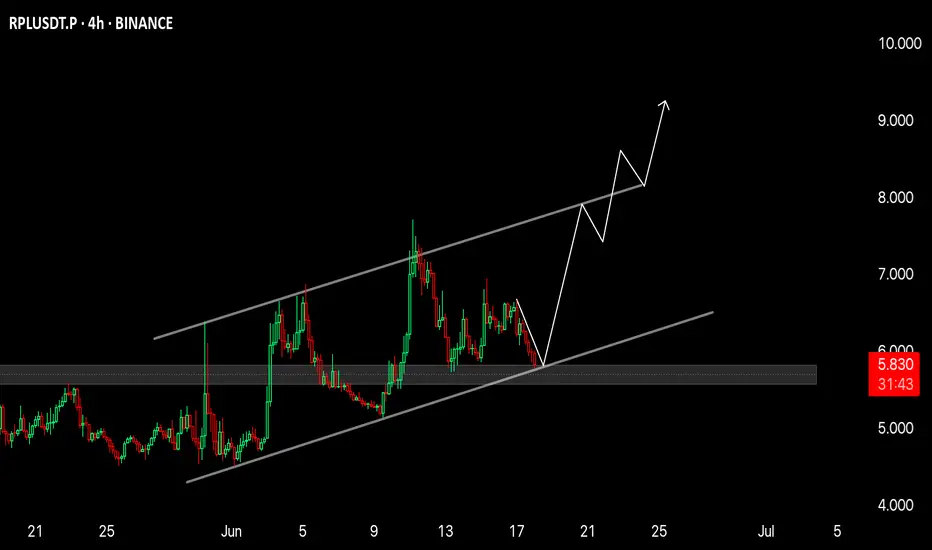
$RPL 4H AnalysisGETTEX:RPL 4H Analysis 🔥
RPL is currently trading at the lower boundary of a parallel ascending channel, which has acted as strong support multiple times in the past. The price action shows a clear higher high, higher low structure, indicating an ongoing uptrend.
Currently, the price is hovering around the key horizontal demand zone ($5.5–$5.8). This level has previously acted as a launchpad for aggressive bullish moves, and we are seeing early signs of accumulation again.
Bullish Scenario:
If the support holds, RPL is likely to retest the midline of the channel around $7, followed by a potential breakout toward the upper trendline near $9 – $9.5.
The risk/reward setup here is highly favorable for swing traders.
What to watch:
Hold above $5.5 = bullish continuation likely 🚀
Break below $5.5 = invalidation of structure ⚠️
📈 Conclusion:
Structure remains bullish. This is a textbook channel bounce setup with targets of $7 → $8.5 → $9.5 if momentum kicks in. Volume confirmation will be key.
#RPL #RocketPool #CryptoTrading #Altcoins #BreakoutSetup #TechnicalAnalysis
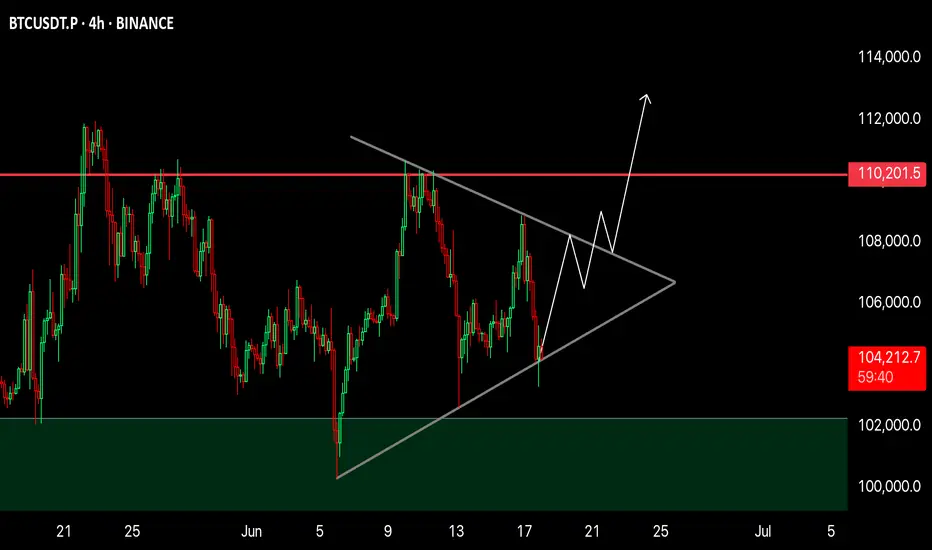
BTC 4H Analysis📈 BTC 4H Analysis – Symmetrical Triangle Breakout Loading
Bitcoin is currently consolidating inside a Symmetrical Triangle, forming higher lows and lower highs – a classic sign of volatility compression.
🔹 Structure: Symmetrical Triangle
🔹 Support Holding Strong – bulls defending the zone
🔹 Breakout Expected Soon
🔹 Major Resistance: $110,200
🔹 Breakout Target: $112,000+
Price is coiling up. Break above the triangle = strong bullish continuation likely.
🚀 Eyes on breakout — next move could be explosive!
NFA | DYOR
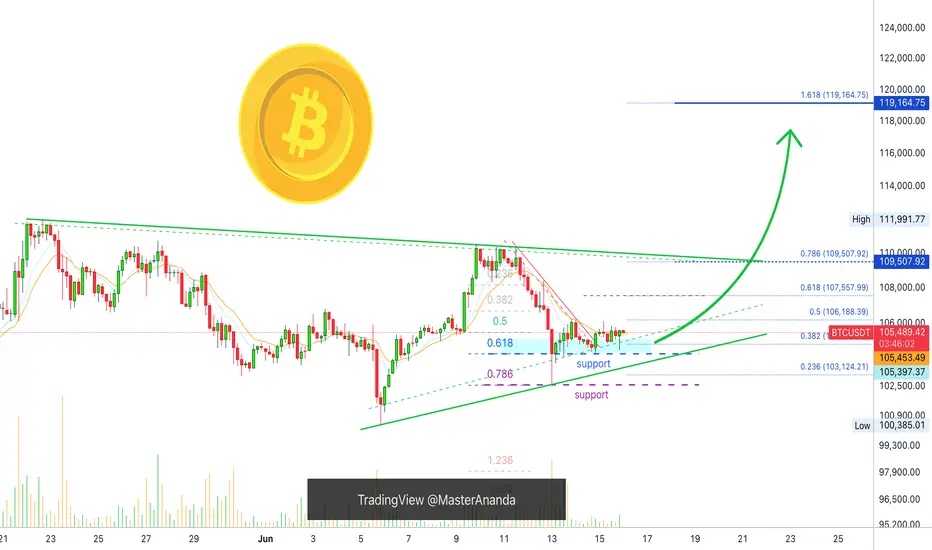
Bitcoin Mid-Term, 4H Timeframe, Bullish ($119,165 Next Target)On the 4H timeframe we have a consolidation pattern with a bullish bias. Bitcoin is aiming higher after a close above EMA8 & 13 with higher lows.
The drop 13-June found support perfectly at 0.786 Fib. retracement on a wick. The session closed above 0.618. The action turned bullish immediately and we are seeing slow but steady growth.
The recent drop was a market reaction due to a geopolitical situation. As soon as the event is priced in, the market seeks balance and goes back to its previous trend.
Bitcoin's bullish bias is not only supported by strong prices, $105,600 is very strong, but also by the altcoins and the cyclical nature of the market.
While Bitcoin already produced several new all-time highs this year the altcoins are yet to do the same. A bull market happens every four years or the year after the halving. For Bitcoin this is already true but this is a marketwide event and the altcoins are yet to go there and this is a bullish factor and soon this will be obvious on the chart.
We are 5-6 days away only from very strong bullish action. Notice that this isn't a long time, it is less than a week. The altcoins will reveal this bullish bias much sooner than Bitcoin but Bitcoin will also grow and hit a new all-time high soon. This new all-time high will be the catalyst for everything to boom.
» Ignore the short-term it is all noise—crypto is going up.
The next target is $107,558, followed by $109,508 on this timeframe. The latter being a mild resistance.
The main target here is $119,165 and this is a good resistance zone. It can be rounded up to $120,000. If this level gets hit it will only confirm additional growth. The target that follows is $130,000 and the minimum for this cycle is $160,000 but we are aiming higher.
Feel free to follow for more.
I will continue to detail Bitcoin on all the timeframes as well as many of the top, mid- and small altcoins.
Thank you for your support.
It is appreciated.
Namaste.
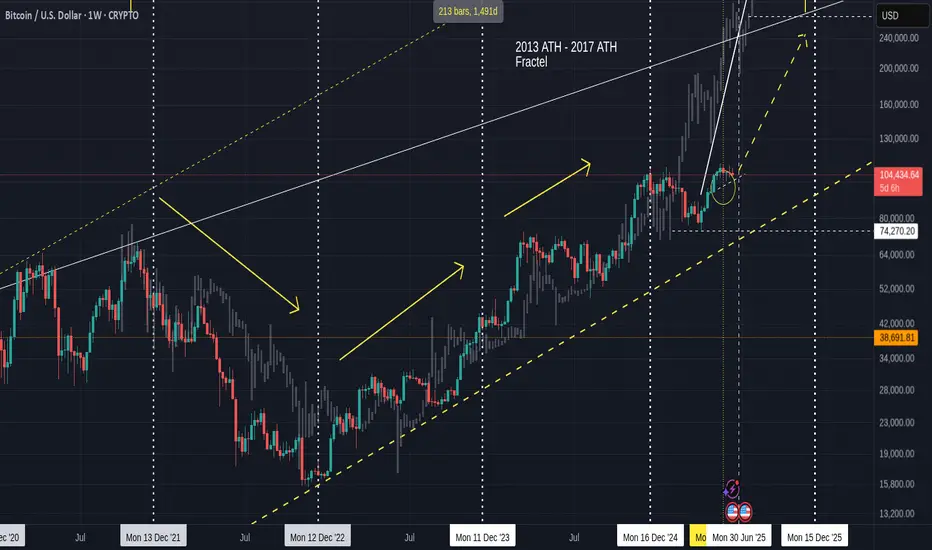
Bitcoin in expected price zone, may go lower then UP ?
This is the old fractal chart and I have faded out the Fractal from 2013 to 2017,
Everything ese remains unchanged since Feb this year.
We hit the expected price range indicated by the circle and we are still in that area but I expect, once the month closes and we have a small red month candle, then we can start printing Green again.
The daily version of this chart shows us more local detail
We have left the area of resistance and so now, we have a free move BUT I think we may dip down to that line of support around 100K - 98K
This would not be a bad thing to do before the end of the month as it would cool off the PA / RSI and MACD and so give confidence to the serious investor while scaring the pats off the New guys and Gals.
The Daily MACD still has a way to dip before it may find support on the neutral line
This level could see PA near that line of support but it is possible for MACD to drop while PA ranges.
So we could see that Dip to line of support and it may offer the last 100K buying zone for a very long time ..
But we do have Stupid people trying to start WW3 with Lies and Greed - this could possibly destabilise things.
Be Cautious
Dogecoin - Don't forget the dog now!Dogecoin - CRYPTO:DOGEUSD - still remains quite bullish:
(click chart above to see the in depth analysis👆🏻)
Basically during every major bullrun on Dogecoin, we always saw a correction of at least -60%. Therefore the recent drop of -70% was not a surprise at all but rather a natural all time high rejection. If Dogecoin manages to now create bullish confirmation, the bullrun will continue.
Levels to watch: $0.2. $0.5
Keep your long term vision!
Philip (BasicTrading)

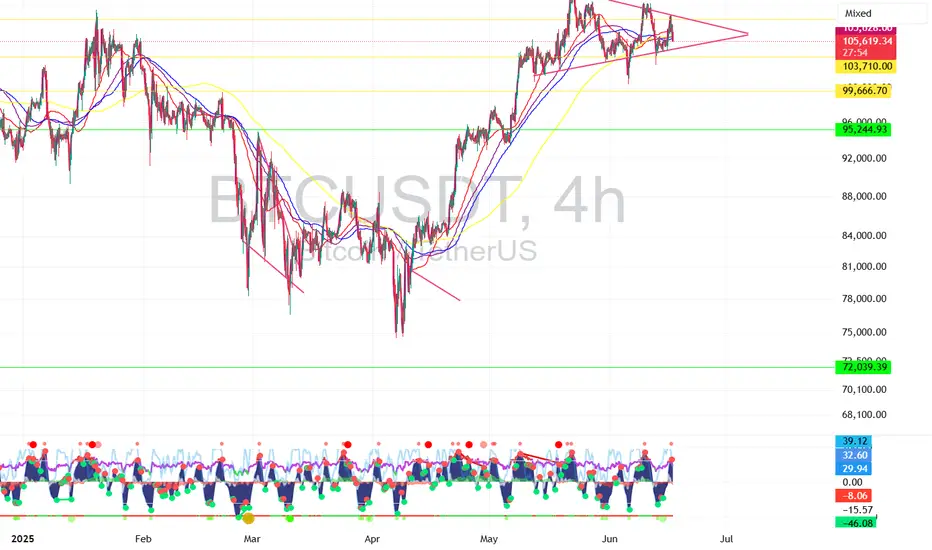
$BTC 4hr - The Calm Before Bitcoin’s Next Move💡 In bull markets, triangles break UP more often than down.
But volume + macro + ETF flows > patterns.
Set alerts, manage risk, stay nimble.
#BTC #CryptoAlpha #RiskManagement
🎯 Key Levels Analysis:
✅ Resistance: 106.3K
→ This level matches the upper bound of the symmetrical triangle and is reinforced by multiple recent rejections. Also aligns with previous highs.
✅ Support: 103.7K
→ Mid-range horizontal support. Price reacted here multiple times. It's also near the triangle base.
✅ Support: 99.6K
→ Clean psychological + technical level. A previous consolidation zone. Would likely trigger a strong reaction.
✅ Last Line of Bull Defense: 95.2K
→ Major horizontal support from the April/May breakout structure. Losing this would likely invalidate the bullish structure.
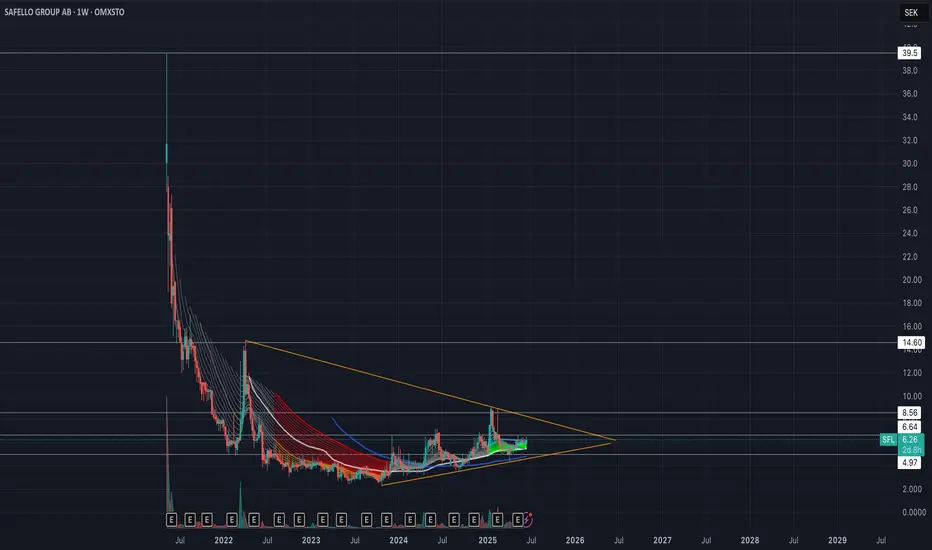
Safello Group AB - Bullish Outlook - Small Cap Crypto Firm Safello is starting to show signs of a breakout from its weekly triangle. If Bitcoin or altcoins start to show life, I believe this stock could outperform most crypto stocks. The company is constantly innovating its offerings and is regulated under Swedish law.
I have been DCA’ing into this stock for quite a while now and will continue to do so until the consolidation is over.
Current market cap is about 10 Million USD.
Nothing here should be considered financial advice. Always do your own research and make your own decisions.
OMXSTO:SFL
CRYPTOCAP:OTHERS
CRYPTOCAP:TOTAL
COINBASE:BTCUSD
NASDAQ:COIN
COINBASE:ETHUSD
The market recently managed to close above the Breaker Block!Bitcoin Market Update (Extended & Insightful):
The current update for Bitcoin remains largely the same as the previous one. However, there have been some slight yet significant shifts in the market behavior.
The market recently managed to close above the Breaker Block (BPR), which initially seemed like a bullish signal. But as it approached the overhead supply zone, it faced strong rejection and started to decline again. This shows that sellers are still active at higher levels.
Right now, the market is treating the BPR as an inversion level, meaning it’s testing it as potential support. This level is crucial for determining Bitcoin's next move.
🔍 So, what’s the best approach now?
Patience is key at this point. The ideal strategy is to wait and watch. Let the market clearly break either the upper supply zone (which would confirm bullish momentum) or the lower BPR zone (indicating a bearish trend). Only then can we expect a strong directional move.
Until one of these key levels is decisively broken, Bitcoin is likely to continue consolidating within this range — moving sideways without a clear trend.
🧠 DYOR — Do Your Own Research!
Always analyze before making any trading decisions.

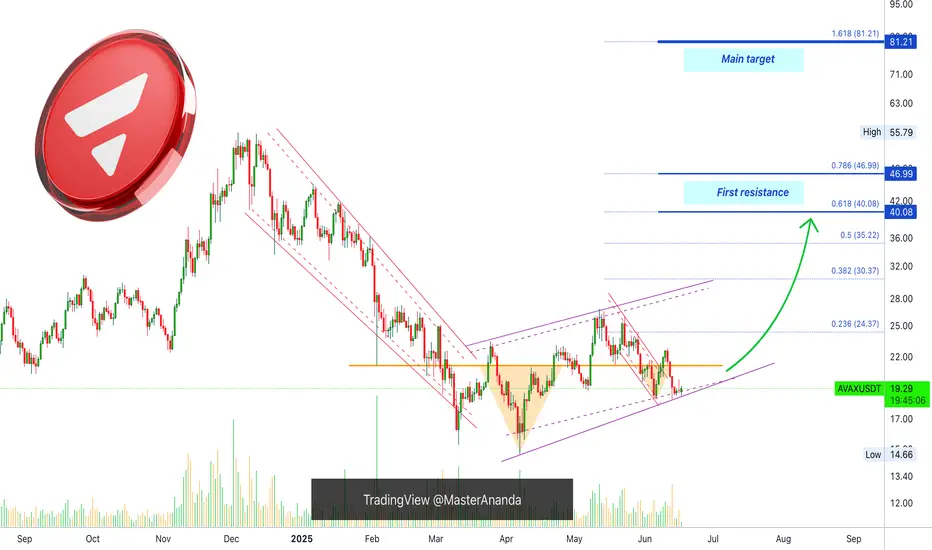
Avalanche, The Money Tree; Great Entry Price & TimingWhat's the first thing you consider when looking at a chart? What is the first thing that catches your attention?
When you take the leap, how confident do you feel that your conclusions are correction? Do you doubt yourself? I don't.
The first I look at are the candles and the chart structure. Later comes the volume and price patterns. Finally, if somehow the direction is not yet clear, I add some indicators for additional support. What about you, what is the first thing you consider when looking at a chart?
I think Avalanche is ready to grow based on a rising channel, a structure of a higher lows. This small and young structure is a period of consolidation before maximum growth. Timing is running out. The market is about to go bullish and it will grow with full force.
It doesn't matter what is happening "out there," Crypto is going up.
Looks like a great entry timing is possible on this chart. The price is awesome. It is the same chart setup we've been looking at for months and months. The current price range has been active since early March.
The rise from March, April and May all include the 3-February low. It is certain and highly obvious, this consolidation has been going for too long. The bearish bias is missing. Bullish consolidation means that a bullish breakout will follow when this phase ends. The start of a new uptrend. All those altcoins that moved first revealed what will happen to this pair.
Did you miss those? I showed you some pairs that grew more than 100% in a single day. You know something interesting? The chart on those pairs is exactly the same as this one. The drop, the recovery and the higher low.
Soon, very soon, Avalanche will follow and the rise will be very strong.
Namaste.