Ravencoin Bullish Continuation, Altcoins Bull Market ConfirmedRavencoin produced a major bullish breakout, we've seen many of those. It happens that you get one of these breakouts but the following week bullish action is dead. That was all, end of story. This isn't the case here and this is truly great news.
First, Ravencoin produced some of the biggest volume ever, only once was there a week with higher volume and the volume in the last two weeks is higher even than in the 2021 bull market. This clearly reveals the start of the next bullish phase, at least for this pair, but never in the history of Crypto has this project or any other gone on a bull market on its own, not in 2021 and not in 2025. What one does, the rest follows.
So we have a bullish continuation. Really high volume to break above EMA34 followed by additional growth. We can expect this trend to continue. These weekly candles are the biggest since 2021.
Get ready, because the same will happen across hundreds of altcoins.
Here is the daily timeframe:
Two days red and it is clear that this project is creating a new uptrend... Thank you for reading.
Namaste.
Cryptomarket

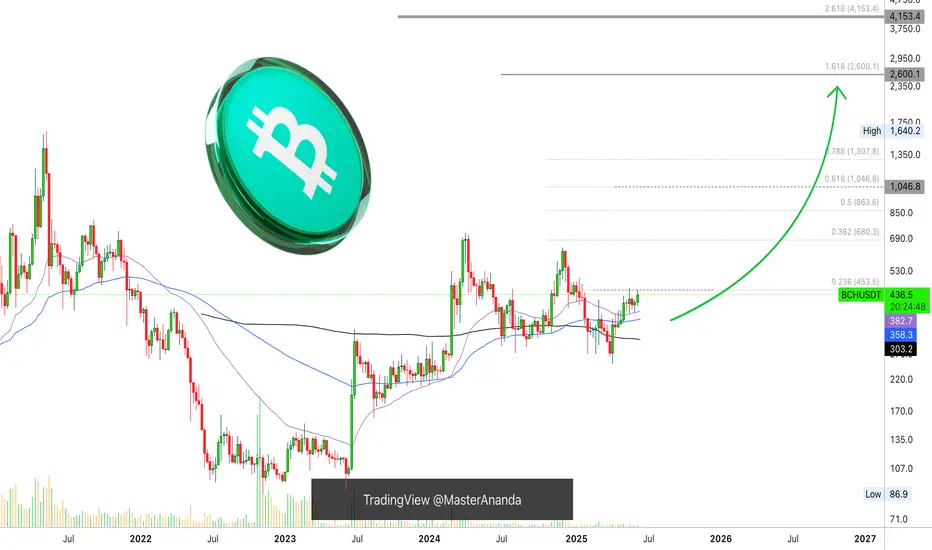
Bitcoin Cash Weekly Update, Moving Averages & Bullish PotentialI already looked at Bitcoin Cash recently, this time I want to see how the moving averages are doing here to compare with the other Crypto-projects. Good news for one pair is good news for other projects as well specially when they are in the same category. Bitcoin Cash is one of the big projects.
Here we can see BCHUSDT trading weekly above EMA34, EMA89 and MA200, while rising.
Resistance was found at $453, a fib. extension level. Once this level is broken as resistance you can expect a swift advance toward $680. It will be nice and easy. This is the last barrier and current price action is kind of mix.
It is good because this week trades at the highest since November 2024 coming from a low. It is bad because it is lower compared to 19-May on the wick but the week is yet to close.
A weekly close above $420 is highly desirable and favors the bulls, anything lower and we continue with a mixed situation. Make no mistake, the situation is mixed only short-term. The chart shows a clear bullish bias and there will be additional growth in the coming weeks and months. Only the short-term is questionable.
Bitcoin Cash, Bitcoin and the entire Cryptocurrency market is set to grow.
Thanks a lot for your continued support.
Namaste.
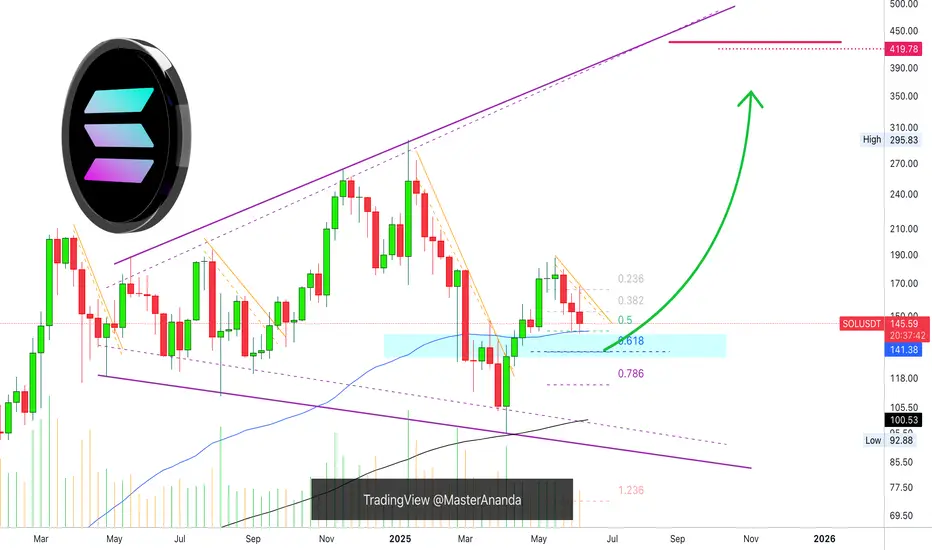
Solana Weekly TF, Good NewsI've gone deeper into Solana's chart and I have good news... You are looking at the weekly timeframe.
I looked at EMA34 and MA200 for some of the major Crypto projects, Bitcoin, Dogecoin, XRP, Cardano and Ethereum. You can find these in my profile @MasterAnanda.
Some were clearly bullish as the action was happening above both moving averages, others were mixed and one was bearish.
Solana is trading below EMA34 weekly but safely above MA200.
MA200 weekly sits at $100 for SOLUSDT.
There is another level of relevance, EMA89. On this chart shown as a blue line and this is the good news. EMA89 is working as support, it worked last week and this week it still holds. This same level matches perfectly the 0.5 Fib. retracement support relative to the move from 7-April to 19-May.
This is all to say that we are looking at a strong support zone, which means that it is likely to hold. If it breaks, it should be brief followed by a recovery right away.
Namaste.
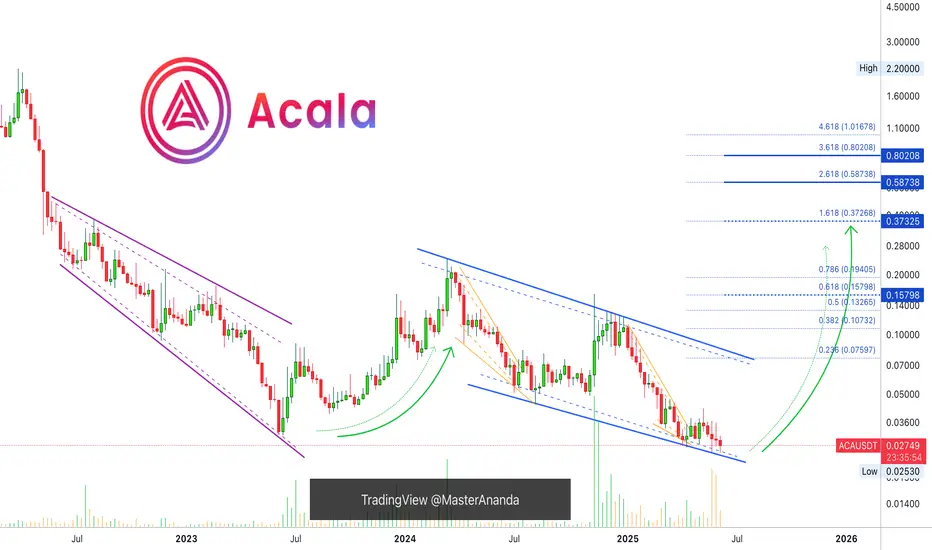
Acala Hits Bottom, Which Means Bull Market Next (2800-3500% PP)Acala is now five weeks into the fire. If you read often you will understand clearly what I mean; if you are new, this might not make much sense.
The low happened 14-April here, ACAUSDT. Some weak action and then red. Five weeks red and the action remains relatively sideways, not much change in price.
Current price trades above the 14-April low. The 14-April low was 0.02698. Current price is higher. Five weeks red, high bearish volume and yet, no new major lows.
Notice the drop from early December 2024 until April 2025. Five weeks red can cover a huge distance, there can be a strong decline. When you see five weeks red but no change in price, this is a bullish signal. It means that the bears have no strength. It means we are not seeing a bearish trend nor a bearish impulse, instead, a retrace and stop-loss hunt. Since bearish pressure is non-existent and after weeks of selling prices aren't going any lower, we can predict change soon.
This change is bullish. The bullish signal comes from the fact that the bearish action is just too weak. It is like seeing prices trading near resistance (say a new all-time high) for weeks, months with no advance. This would reveal that the top is in and a crash comes next. In this case, the bottom is in and a bull market will follow.
Thank you for reading.
Namaste.
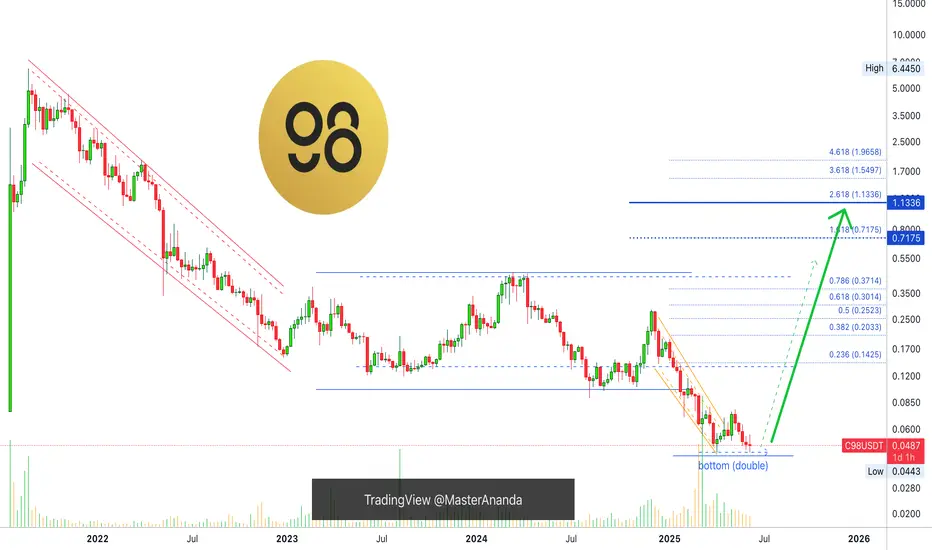
C98 Hits Bottom, More Than 3,333% Growth PotentialHere C98 breaks the pattern, a channel breakdown after going sideways for years. This is the liquidity hunt event. Two signals reveal that this drop is the bottom and precedes a change of trend.
1) The highest volume ever and since 2021 came in March as C98USDT looked for a new low.
2) We have a double-bottom.
The bullish action will start without warning, Boom!, 100-200% up. Then it will continue with full force, month after month after month of a rising market, see the green arrow. We are now very close.
That's all there is. Once you hit bottom, there is no other place left to go but up. Nothing, nada, nichts, niente, rien. Only up is possible now and that's where we are headed next.
Buy and hold. Growth potential goes between 2,500% and 3,900%.
Namaste.
Ethereum Liquidity Pool RangeOn the ETH/USDC liquidity pool on the Base network, Ethereum’s volatility is beginning to stabilize, creating a favorable range for liquidity provision, as indicated by the horizontal red lines. There may be an opportunity to tighten this range further in the coming hours, but additional data is needed to confirm. For now, the concentrated range is being set slightly wider, given that we’re still relatively close to the significant volatility spike from earlier in the week.
Bitcoin Breaks 20-Jan 2025 Peak Price, New ATH Next (+Altcoins)Look at this, Bitcoin closed the day exactly above the 20-Jan 2025 high. This day Bitcoin peaked at $110,265, the all-time high before May; yesterday, 9-June 2025, Bitcoin peaked at $110,577.4 but closed at $110,270, five dollars higher. Is this a bearish or bullish signal? What to expect!
Good evening my fellow Cryptocurrency trader, I hope you are having a wonderful day.
This week starts with a bang, a big bang, with Bitcoin doing great. The question immediately arises and I will answer, Will Bitcoin continue growing? Or, will Bitcoin produce a retrace?
I can tell you with 100% certainty that Bitcoin will continue to grow. I can support this statement with data from the charts.
We have hundreds and hundreds of altcoins going bullish, strongly bullish, some coming out of a new all-time low. If Bitcoin was set to crash, these altcoins wouldn't be gaining in bullish momentum, they would be diving deep much lower in order to create new lows. But this isn't what is happening this week, last week and today, no! What we are seeing now is huge growth across the altcoins market and this confirms what Bitcoin will do next.
Needless to say, as Bitcoin trades near its all-time high this is extremely bullish.
If a new all-time high is hit but the action moves lower, say 10-15% lower and remains there, this is bearish and points to lower prices. If the action remains very close to resistance, as it is now, this is ultra-bullish. It is simple do you agree?
Because when there is an incoming drop many people in the know start to sell, so the action never stays at resistance there is always a strong rejection with high bearish volume.
On the other hand, when resistance is challenged and continues to be hit over and over, or the action stays very close, it simply means that people are buying, holding and ready for growth. Bitcoin will continue moving higher mark my words. It is very easy because this has been confirmed long ago.
The bottom was hit 7-April and we are now experiencing long-term growth. As Bitcoin continues to trade near its all-time high, the altcoins will blow up.
When Bitcoin grows 20-30%, some altcoins can grow 100-200%. When Bitcoin grows 50%, some altcoins can grow 300-500%. This is the 2025 bull market.
Thank you for reading.
Give me a boost if you trade and profits from the altcoins market.
Namaste.
P.S. Leave a comment with your favorite altcoins, I will consider the pair for a few full analysis.

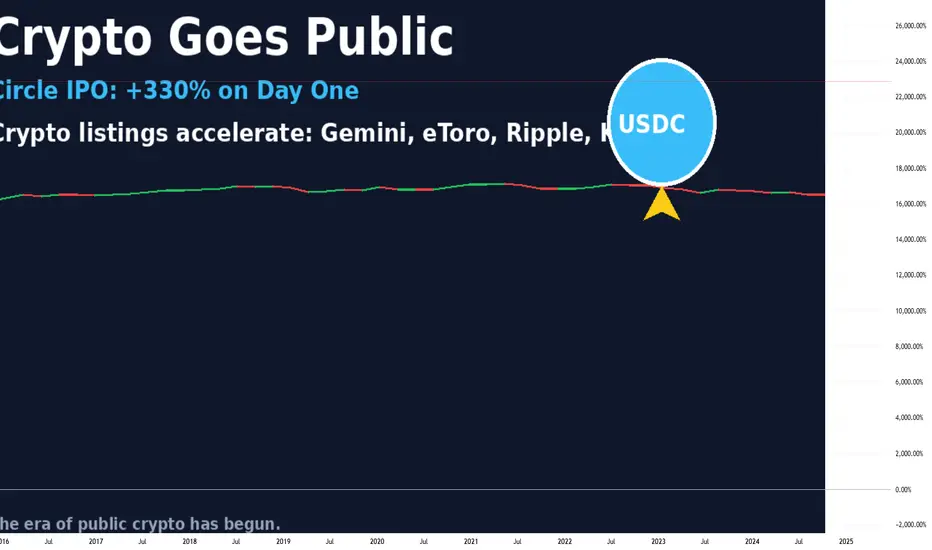
Circle’s IPO and the Crypto Listing Wave: The Market EntersOn June 14, 2025, the U.S. stock market witnessed a pivotal moment for the crypto industry. Circle, issuer of the USDC stablecoin and a major player in the sector, successfully went public. Shares opened at $31 and soared to over $134 by the end of the first trading day—an explosive 330% gain.
This isn’t just a one-off success. It marks the beginning of a new chapter: the public crypto era, where leading crypto companies are stepping into the spotlight of traditional finance.
Why It Matters
Circle’s IPO signals the maturation of the crypto market. Just three years ago, crypto companies were seen as high-risk, unregulated tech startups. Now, they’re structured fintech firms with clear business models, institutional backing, and regulatory compliance.
Who’s Next in Line
Following Circle, a wave of major crypto firms is preparing for their own IPOs:
eToro – the social trading platform with crypto features has finalized its SPAC merger and is set to debut on NASDAQ.
Gemini – the exchange founded by the Winklevoss twins filed for an IPO in mid-May.
Galaxy Digital and Ripple – both confirmed listing plans for the second half of 2025.
Kraken is exploring a listing in Europe, where requirements are more flexible than in the U.S.
These companies are waiting for the right moment—regulatory clarity, growing interest in crypto ETFs, and progress in U.S. Congress (with the CLARITY and GENIUS bills gaining momentum).
What It Means for the Industry
Increased Investor Trust – Public companies must disclose financials, pass audits, and comply with regulations. This builds confidence in the broader crypto sector.
Institutional Capital Inflow – IPOs unlock access to capital from pension funds, hedge funds, and asset managers that cannot invest in private crypto startups.
Marketing Power – Going public draws media attention and boosts brand awareness. Every IPO is a PR win for the entire industry.
Risks and Challenges
Regulatory Uncertainty – Despite progress, the SEC could change direction, especially with potential political shifts.
Overvaluation Concerns – Circle’s stock is already raising eyebrows, with a P/E ratio over 200 and trading volume growing faster than revenue.
Crypto Market Dependency – If crypto prices crash, the valuations of these companies could quickly collapse.
What’s Next
Expect up to 10 more crypto IPOs over the next 6–12 months, including players in DeFi, blockchain infrastructure, and Web3. This is the next stage in crypto’s journey toward mainstream legitimacy.
What was once the domain of tech rebels and early adopters is now becoming a business—with a stock ticker and quarterly earnings. And that changes everything.
ETH UPDATE 🛡️ Ethereum Holds the Line — Critical Support Zone Tested Again
Because Ethereum has plummeted over 14% since Wednesday, traders and long-term holders are worried. Bullish investors expected ETH to break over $3,000 and confirm a wider cryptocurrency rise days earlier.
However, global turmoil has slowed markets. Israel's assaults on Iran and retaliations shook global markets on Thursday, causing crypto asset volatility and risk-off.
Historical trends between August 2021 and early 2024 suggest that keeping $2,500 has led to rallies reaching $4,000. Rekt believes Ethereum must maintain consistency around this zone to prevent a deeper retreat and maintain bullish momentum.
ETH has held $2,500 over five weeks, proving its stability despite numerous testing. In the weeks ahead, altcoins and the crypto market will depend on whether Ethereum can maintain this footing again.
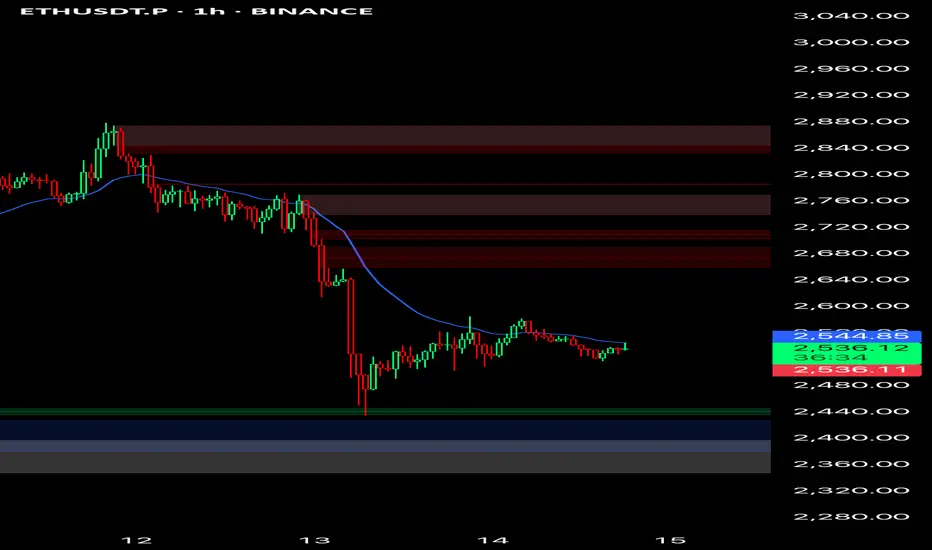
Ethereum fell sharply from $2,830 this week to $2,556. On the daily chart, ETH has been rangebound between $2,500 and $2,830 for weeks. Ethereum has held above the 50-day and 100-day moving averages, which are rising, despite international threats.
The red 200-day moving average at $2,642 has provided resistance. A retracement followed ETH's short break above this level, which it failed to keep. Recent volumes have increased due to heightened attention and emotive price responses in the Israel-Iran conflict.
The $2,500–$2,520 support zone is important. This region has been a floor before and might rocket bulls if they recover control. A clear fall below $2,500 might turn sentiment negative and lead to $2,300.
Bitcoin Sentiment Slips Below Neutral As Price Hovers Near $105KBitcoin sentiment drops to 46.1% as market shows hesitation despite price rebound.
Trading volume remains flat, weakening support for BTC’s move above $105K.
Sentiment must exceed 60% with rising open interest to avoid retest of $102K support level.
According to the latest Advanced Sentiment Index data, Bitcoin sentiment has weakened despite the asset making a small recovery. As of June 13, the index recorded a reading of 46.1%, falling below the neutral 50% mark. This shift indicates a cautious market environment where investors remain hesitant to drive further gains without stronger confirmation signals. While Bitcoin has rebounded from recent lows, sentiment metrics and trading volume suggest limited conviction behind the price move.
According to the Bitcoin Advanced Sentiment Index, the current reading has fallen to approximately 46% just below the neutral 50% threshold. The chart shows that after bullish sentiment peaked above 80% in early June, the index has gradually declined; despite the recent TELEGRAM /(@TradeWithARZ) June 14, 2025
Data from the Advanced Sentiment Index shows that market optimism peaked above 80% in early June but has steadily declined since. The chart, tracking activity from May 16 to June 13, shows that sentiment dropped below 20% on multiple occasions, including June 5 and June 13, both aligning with short-term declines in Bitcoin’s price. Although the asset has since bounced back from those levels, investor confidence remains subdued.
The bell curve model used in the chart emphasizes that the majority of sentiment readings have clustered between 40% and 65%, showing a lack of extreme bullish or bearish positions. This distribution suggests uncertainty, as traders hesitate to take strong directional bets.
Recent price action within the $103,000 -$105,000 area has, however, not been accompanied by new volume inflow as net buy volume and volume delta show almost no change. The stagnation of these indicators suggests that the market participants did not support the rise to a sufficient degree.
Price Volatility Contains Within Narrow Range
According to CoinMarketCap, Bitcoin was trading at $104,950.96 at the time of writing, reflecting a 0.31% decrease over the past 24 hours. The price surged above $106,000 but faced resistance and returned to a tighter trading band. A major dip occurred around 6 PM on June 13, followed by a rebound during the early hours of June 14. Despite these fluctuations, the asset has not broken out of its recent consolidation pattern.
Source: CoinMarketCap
The volume-to-market cap ratio over the last 24 hours is 2.38%, which indicates moderate trade. The total circulating supply of bitcoin has now grown to 19.87 million BTC and is getting ever closer to the protocol-imposed limit of 21 million. Despite the stability seen in price action, analysts are monitoring bigger signs before calling a directional change.
According to analysts, the sentiment index needs to exceed 6065 percent to validate a sustainable uptrend. An increase in open interest and net taker volume is unlikely to achieve that level. In the absence of those conditions, the market is vulnerable to retesting lower support areas between $102,000 and $103,000.
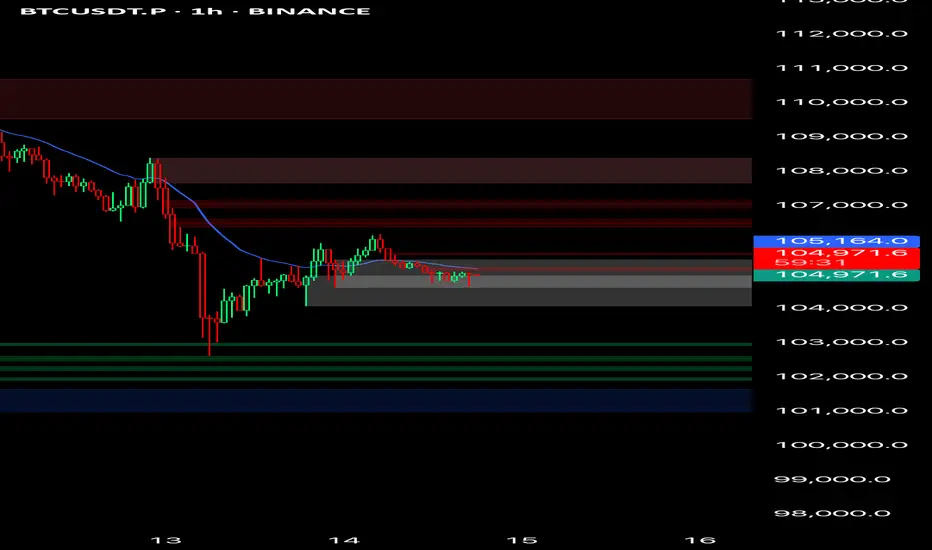
Weak Pullback, Bears in Control | Will the $100K Zone Hold? BTCUSD – Weak Pullback, Bears in Control | Will the $100K Zone Hold?
🌍 Macro & Fundamental Outlook
Bitcoin continues to face downside pressure after failing to hold above the key $108K resistance. Several macro factors are influencing sentiment:
📉 US bond yields are rising again, as markets expect the Fed to delay rate cuts. This adds pressure on risk assets like BTC.
🪙 Bitcoin Spot ETF inflows remain positive, but are currently not strong enough to counter short-term selling pressure.
💵 The DXY (US Dollar Index) is recovering, as investors flee to USD amid geopolitical volatility in the Middle East.
📊 Institutional liquidity is thinning across exchanges, adding to intraday volatility.
📉 Technical Analysis – H1 Chart
🔹 Trend Structure:
BTC is now firmly in a short-term downtrend, trading below the descending trendline and all key moving averages (EMA 34, 89, 200).
Rejection from every pullback suggests that sellers are still in control.
🔹 Key Price Zones:
Bearish FVG Resistance: 106,096 – 107,004
First Support Zone: 102,821
Major Support Zone: 101,539 → 100,419
A clean break below 100K could open the door to 98,000 and below
🔹 Momentum:
RSI is neutral, hovering around the mid-40s without strong divergence signals.
Selling volume is increasing but not yet explosive — indicating the market may be awaiting a macro catalyst.
🧠 Market Sentiment
Traders are currently in “wait-and-see” mode, eyeing the next round of macroeconomic data and potential Fed commentary.
Short-term profit-taking is dominant after last week’s sharp rally.
Overall sentiment: Bearish short-term – Neutral mid-term – Bullish long-term
🎯 Trade Setup Ideas
🔻 SELL if price retests FVG and gets rejected
Entry: 106,000 – 107,000
Stop-Loss: 107,500
Targets: 102,821 → 101,539 → 100,419
🔹 BUY if price reacts strongly from 100,419 – 101,500
Entry: 100,500 – 100,800
Stop-Loss: 99,800
Targets: 102,800 → 104,400 → 106,000
Preference is given to selling the rally in the short term. Buying should only be considered on confirmed reversal signals at key support.
✅ Conclusion
BTCUSD is currently in a corrective phase, with bears maintaining control. The key level to watch is the $100,419 support zone, which may determine whether Bitcoin maintains its medium-term bullish structure or breaks further. Discipline and confirmation are crucial in this volatile environment.
📌 Strategy Focus: Look to sell rallies toward resistance; buy only on confirmed bounce from strong support zones.

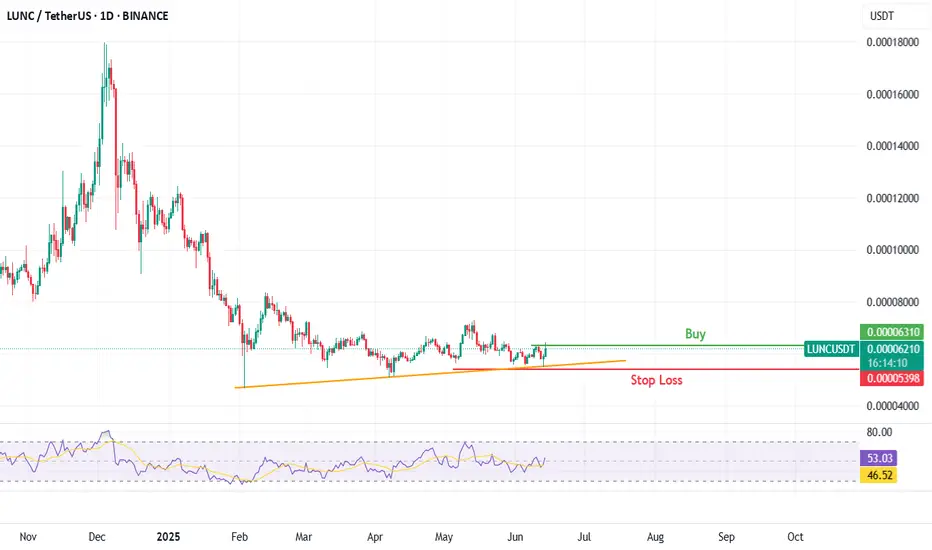
LUNC/USDT is in Reversal LUNC/USDT is showing good trend line reversal with the divergence on the 4hr time frame looks good for buy at current price or it can be go for some small retracement on 1hr time frame
SHIB/USDT is in Bullish TrendSHIB/USDT is looking good to go up side it is showing good retracement on daily chart and also showing bullish divergence on daily chart it can be buy current price or if some one want to be more sure then buy after new HH

Pi Network at the cliff edge ?SInce there a lots of speculation about Pi coin, people are still doubt about it and beliving that Pi coin will bankrupt. No real CGV price USD 314,159 will be done somewhare 10 years ahead, the cummunity of Pi pioneers getting more weaker and no trust with the project.. Eventually Pi coin end like a shit coin dies in the blockchain space with no value. Floating in the space with tears and no hope.....
BUT !!
The awaitting news this 28th June 2025, will it change on more again? Or just a pity small news that no changes at all, like the Pi core team does when 6 years past, the project phase. Lies with lies.. and more lies ahead ? Just stay tune, keep mining, and no body realy knows what in the future.. Baba Vanga never told about Pi Coin, only the Simpson was telling about the Pi.

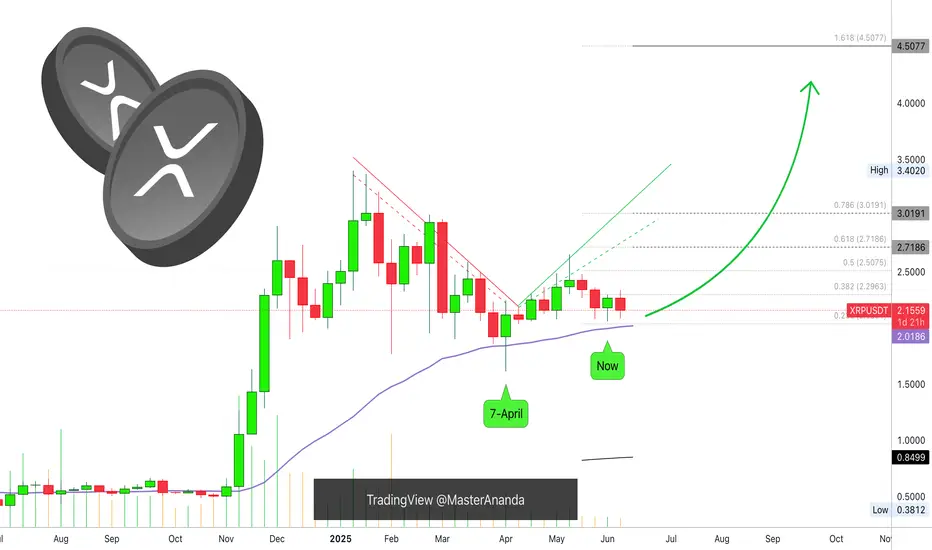
XRP Weekly UpdateThe line on the chart stands for EMA34. Notice two things about this level: 1) It was challenged 7-April but the action closed above. 2) The action "now" remains above this level but it has not been tested again, this is a bullish signal.
When it comes to the weekly timeframe, long-term, XRPUSDT continues bullish, with a bullish bias aiming higher. What we are seeing now is consolidation, accumulation, nothing changes and we can expect more growth.
Yes, the market shakes a little bit but this is the classic short-term noise. Zoom out, what do you see? You see just a few candles, red and green, but no change at all. The market is advancing to the side, after this side-advance, it will advance up; a bullish jump.
EMA34 sits at $2.01. We are strongly bullish above this level. We can expect growth in matter of weeks. Can be 1-3 weeks but it can also happen within days.
The retrace was small, consolidation has been going long enough. We are ready to start the next bullish wave.
Namaste.
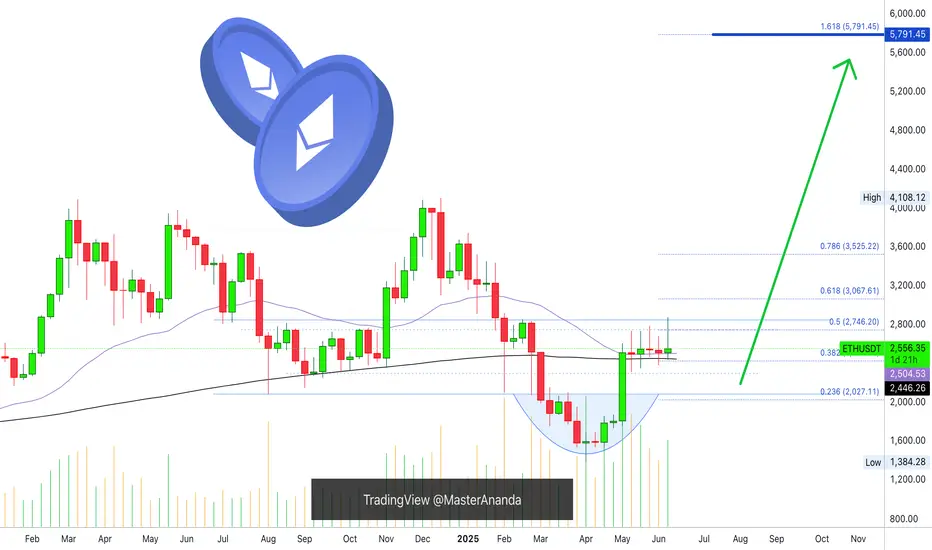
Ethereum Weekly: Bullish & Bearish ExplainedEthereum has been sideways five weeks straight. Market conditions here are bullish and bearish short-term. Let me explain.
The market has bearish potential because of resistance. Ethereum has been facing resistance and fails to move forward for more than one month, but the bias isn't bearish, this is just a potential based on short-term price action.
The market has bullish potential because of a strong recovery after the 7-April low; because it trades above the August 2024 low and because there is very little retrace since the 5-May break of resistance in the form of EMA34 and MA200.
Ethereum is bullish because it trades above MA200 and remains above this level.
We are seeing bullish consolidation. There was an advance recently and after this advance the market went sideways. This means bullish.
While there can be a retrace short-term, market conditions remain bullish for this pair; ETHUSDT.
The bulls have the upper-hand and the majority of signals are bullish. Ethereum will continue to grow.
There is no scenario where Ethereum moves and closes weekly below its 3-Feb and 24-Feb lows ($2,075). It is simply consolidating before additional growth. It is going to go up, sooner rather than later.
Thanks a lot for your continued support.
Namaste.
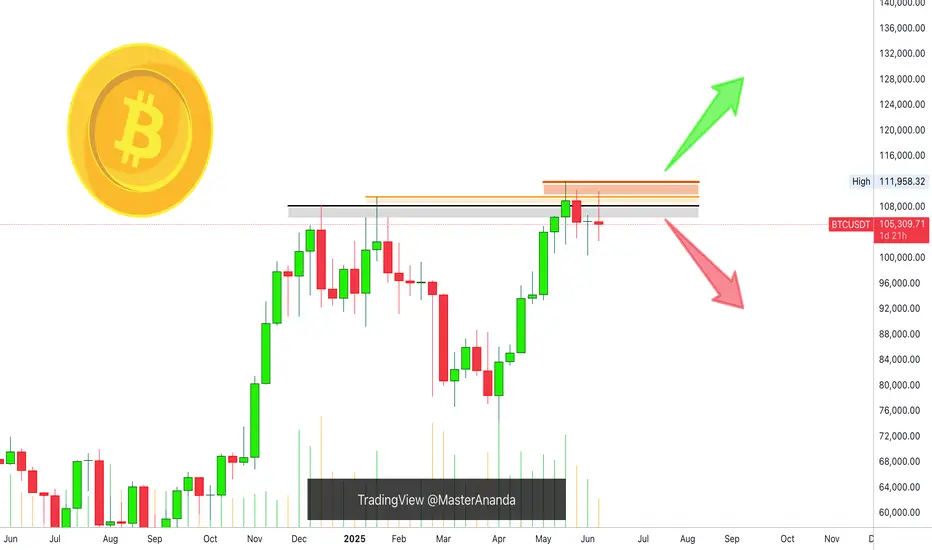
Bitcoin Weekly: Bullish & Bearish ScenariosThis is the definitive analysis based on the weekly timeframe. Depending on how the weekly session closes the market trend will be defined. Bitcoin is both bearish and bullish. Let me explain.
» If Bitcoin can move and close weekly above $110,000, market conditions are considered bullish and we can expect higher prices.
» If Bitcoin moves and closes weekly below $100,000, market conditions are considered bearish and we can expect lower prices.
» Any trading between $100,000 and $110,000 can be considered consolidation. Since the main move is an advance starting 7-April, the consolidation has a bullish bias; makes sense?
It is a bullish bias but a bullish continuation is not confirmed. Bitcoin peaked the 19-May week, a new all-time high. Then it produced a lower high this week. This implies bearish potential and bearish pressure.
» If this week closes above last weeks high, around $107,000, we can say the bulls are gaining ground.
» If this week closes at the open or lower, say $105,000 or lower, then the bears are gaining the upper-hand a lower low becomes more likely.
It has not been decided, anything goes. Anything can happen because Bitcoin will not die, trading won't end if prices move below 100K. This would simply lead to a bounce and a recovery later down the road.
It also works in reverse, if Bitcoin moves higher, nothing happens, the market will continue to be and exist, it will continue to grow and evolve.
Right now we are mixed, this is a decision point. The action is determined by the price, depending on what prices we get we can know what comes next. Since the week is yet to close, we remain in doubt but the bearish bias has the upper-hand short-term.
Short-term bearish potential is strong based on the ath, triple-top and lower high.
Mid-term the market is in a bullish trend facing resistance. The wave from 7-April through present day.
Retraces and corrections are normal.
Long-term Bitcoin is bullish, because it has been growing since November 2022.
Thank you for reading.
👉 If you would like to see an update when the week closes hit boost!
Namaste.
Altcoins: Warning. Check this chart!On the weekly timeframe, I’ve noticed a striking similarity between the 2021 cycle and the current one.
Take a close look at the chart—once you see it, you can’t unsee it.
Are we at the same point we were in March 2022?
The MACD is nearly identical
The RSI mirrors the same pattern
The Vortex Indicator stands at a critical crossroad
The only difference: trading volume is significantly higher
This setup resembles a potential triple top formation. If it confirms, it could completely contradict the bullish forecast I’ve held for months—or it might just be a fakeout.
We're at a decision point for altcoins: either the altseason kicks off in September and invalidates this bearish pattern, or we're headed toward a dot-com-style crash for most altcoins—excluding the top 10.
Keep a close watch on $OTHERS. History tends to repeat—let’s hope not this time.
DYOR
#Crypto #Altseason #BTC #CryptoAnalysis #MACD #RSI #BitcoinDominance #Altcoins #TradingView #TripleTop #CryptoCrash #Blockchain #CryptoCycle #MarketAnalysis

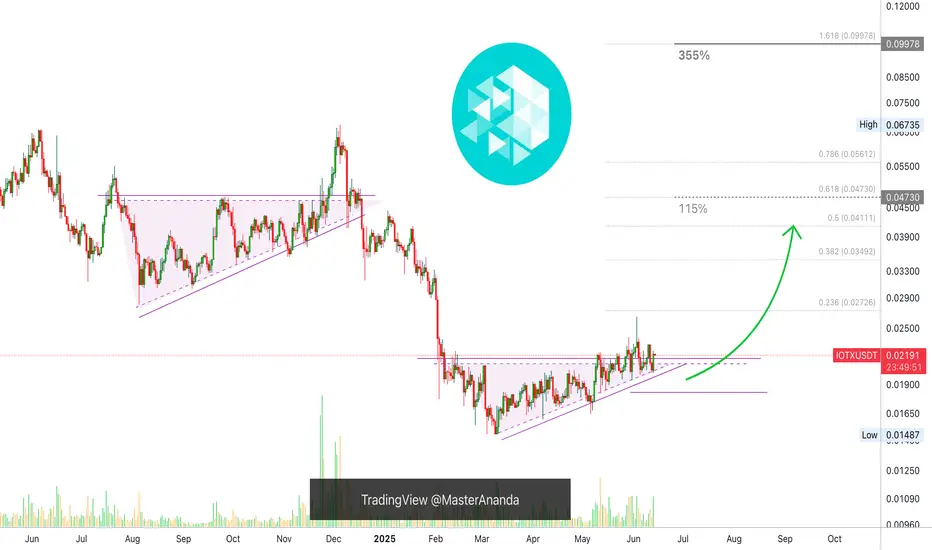
IoTeX 4 Months Bottom Consolidation, Time To GrowThis is one of the best types of chart setups, very low risk and a high potential for reward. Let me explain.
IOTXUSDT hit bottom mid-March, after this bottom, it has been consolidating bullish for more than three months. If we take the drop produced in early February as the start of the consolidation phase, we are talking about more than four months sideways, this is huge. Four months sideways simply means a very long and strong consolidation phase. The longer the consolidation phase the stronger the bullish wave that follows, and bullish is what is coming next.
Notice the higher highs and higher lows. Shy, small; slow and steady growth, but still higher since March. This reveals the broader bias and market trend. IoTeX is set to grow and it will produce a very strong bullish wave. It is only weeks away. Consolidation can only go for so long and it has been already more than four months.
This is an easy pair, an easy trade. Buy and hold.
Namaste.
Bitcoin (BTCUSDT) - Price Consolidating Inside Sym. Triangle - DBITCOIN (BTCUSDT) price has recently bounced up from above the 50EMA (yellow line).
Since May 2025, price has been consolidating sideways and has now formed a symmetrical triangle (blue lines). 10% to 20% volatility could be incoming for Bitcoin this summer.
The key resistance prices that Bitcoin has yet to breakout above are: $110000, $112000, $115000, and $120000+.
Support prices are holding at this time, such as $105000, $104000, $102000, and $100000, $95000.
If price holds above $100,000 to $105,000, there is still a chance that Bitcoin can continue to uptrend and rally higher this year in 2025.
However, if $100,000 price and support levels are lost, a new downtrend could occur and price could possibly test the 200EMA zone (red line).

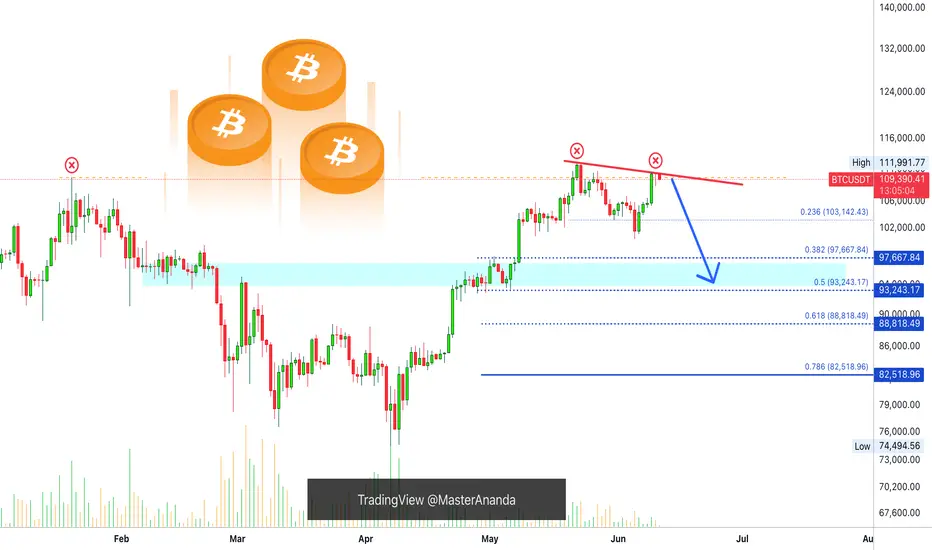
Bitcoin At Resistance: OMG! Not Another 20X SHORT!Sell at resistance; buy at support.
Good morning my fellow Cryptocurrency trader, I hope you are having a wonderful day.
Being able to adapt to changing market conditions is one of the signs of being a great trader. Being able to spot changes on a chart is also indicative of someone that can produce great results in this and other markets. How are you feeling today?
It is no secret, we let everyone know; We sell when prices are high, we buy a lot when prices are low.
Bitcoin is now trading below its 20-Jan 2025 peak price. And it is also producing a lower high. Both bearish signals that are pointing to a lower low.
If the first drop settled around 100K, the second one should settle in the low 90s or right below 90K. It can go lower of course but we go step by step. I am not saying GO SHORT 20X again. This would only be possible for people who are smart, experienced traders and those that can take advantage of a changing situation without breaking their portfolio or long-term plans. Those can definitely SHORT this setup and profit short-term.
A trader trades, it is what he/she does. You sell when prices are high if a drop is incoming, you buy when prices are low if a rise is next.
This is a friendly reminder and it carries great entry prices and timing. Follow the chart.
Trading volume is super low as Bitcoin trades near resistance and this is one of the biggest exchanges in the world. Low volume at this point reveals a pattern of distribution, distribution means lower of course.
Both the MACD & RSI move on the bullish zone but trending lower, bearish at this point.
What will it be: Will Bitcoin move down next? Will Bitcoin move up?
My money is on down.
Leave a comment if you agree.
Thanks a lot for your continued support.
Namaste.
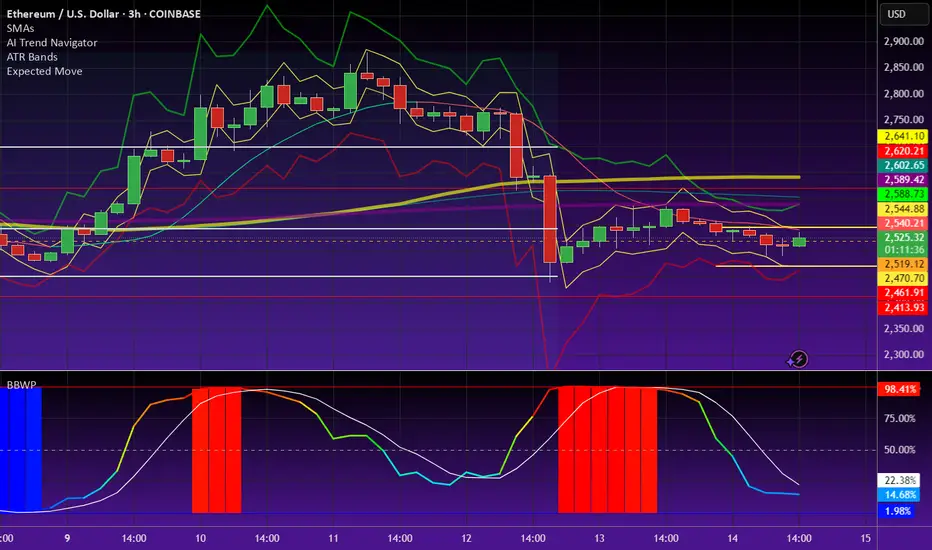
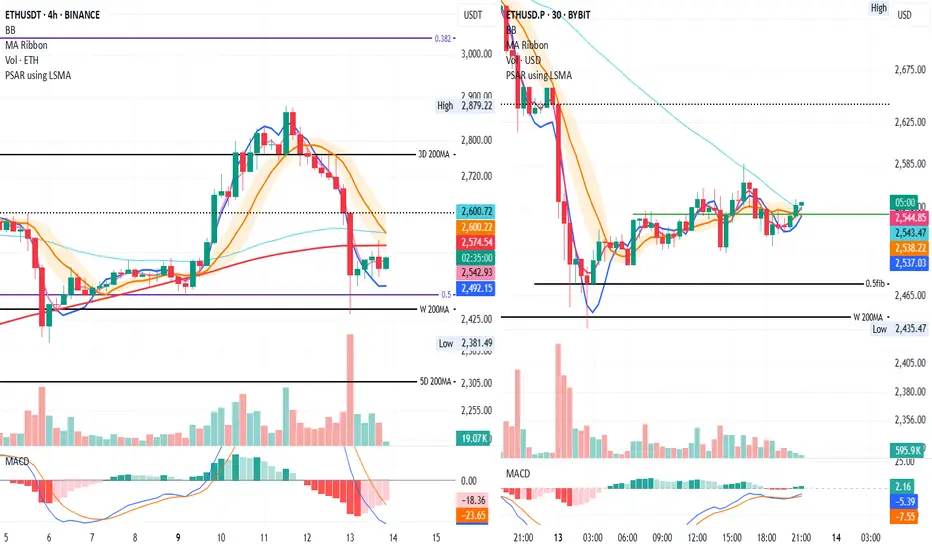
Watching 4H and 30min Reaction
Price is now finding resistance on the 4H at the 200MA, and on the 30min at the 50MA.
On the 4H, the SMA has flattened, and the MLR is starting to flatten too—after price found support at the 0.5 Fib and weekly 200MA.
Buying volume is starting to pick up on both timeframes.
For stop-loss, I’m using push notifications instead of an open order.
Always take profits and manage risk.
Interaction is welcome.
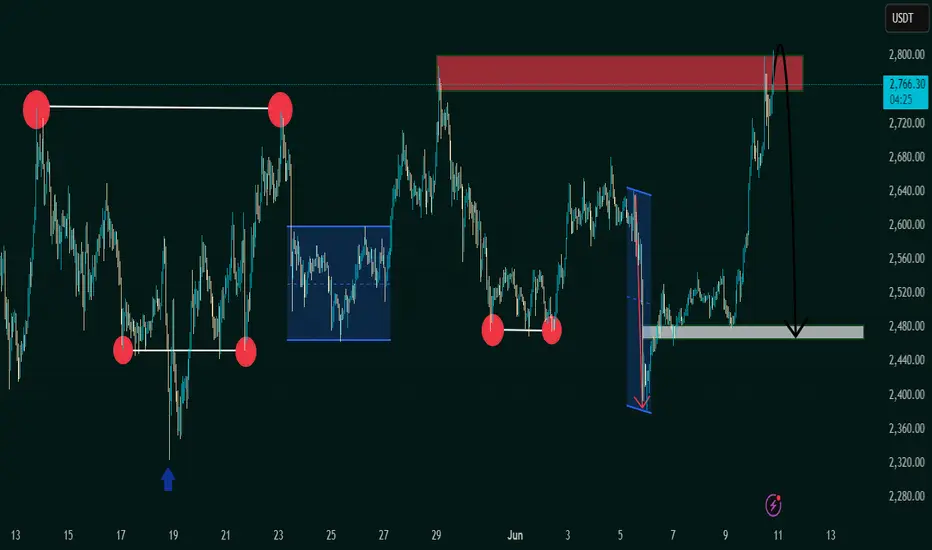
"Bearish Reversal Opportunity Following Supply Zone Rejection"1. Double Top Formation (Resistance Level Identified)
The chart displays a clear double top structure at the 2,760–2,800 USDT level.
This level has acted as a strong supply zone (highlighted in red), where price previously reversed, indicating heavy selling interest.
Current price action has retested this resistance zone and shown signs of rejection.
2. Liquidity Sweeps & False Breakouts
On the left side of the chart, an aggressive downward wick (marked with a blue arrow) suggests a liquidity sweep below a key low before strong bullish momentum returned.
This type of price action indicates smart money involvement, designed to remove weak hands before pushing price higher.
3. Accumulation Phases (Sideways Consolidation)
Multiple accumulation ranges are highlighted with blue rectangles.
These ranges show horizontal consolidation, where price builds up energy before breakout.
The most recent breakout led to a vertical rally toward the resistance zone, signaling an end of the accumulation and a start of distribution.
4. Double Bottom Support Structure
Identified near the 2,480 level, marked by red circles.
This level has historically acted as demand/support, evidenced by multiple bounces from this price zone.
Now highlighted with a grey zone, it is projected to act as the next key support area.
5. Bearish Projection
A large black arrow suggests a forecasted bearish move from the current high (~2,800) back to the support zone (~2,480).
This aligns with the idea of a mean reversion or pullback after a strong bullish impulse.
---
Conclusion & Trade Idea:
🔻 Bias: Bearish (Short-term)
The chart presents a classic reversal pattern with a double top at a well-defined supply zone.
Entry could be considered after confirmation of rejection from this level.
🧠 Trade Plan Suggestion:
Entry: Short near 2,780–2,800 after bearish confirmation (e.g., bearish engulfing candle or break of structure).
Target: 2,480 (support zone).
Stop Loss: Above 2,820 (recent high).
Risk-Reward: Approximately 1:2.5 or better depending on execution.