Cryptomarket
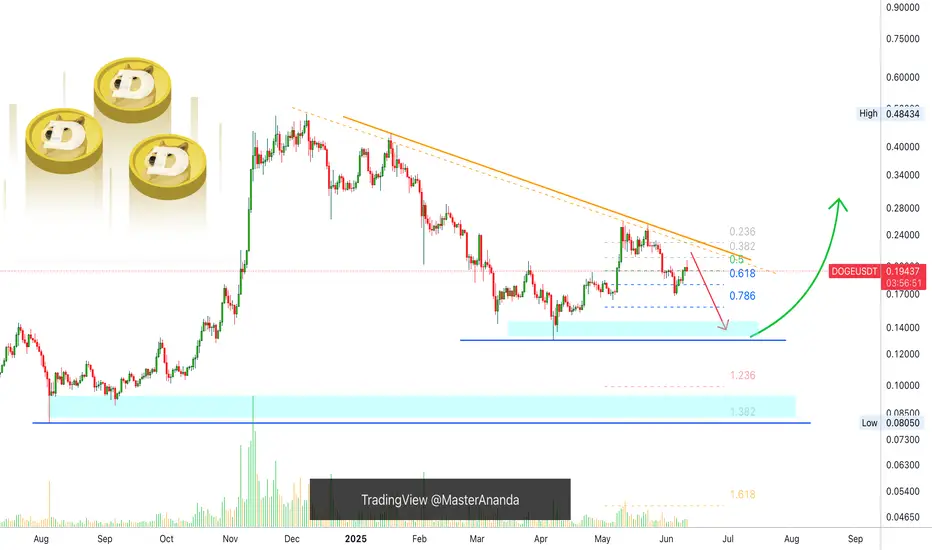
Dogecoin Bearish But...Yes, Dogecoin is bearish now but this is only a short-term situation, it is the end of a long-term correction. Notice the chart, Dogecoin has been producing lower highs long-term, since December 2024.
Recently, there was a major low in April and then a recovery and after this recovery we have local lower highs. The current drop is the continuation of the retrace that started 11-May. This retrace should end soon, within weeks or just a few days.
As soon as the low settles, we can enter the market bullish again. If you trade spot, simply wait. Day traders can easily SHORT but the range is short, after a small drop cover and switch back to LONG. Experts only.
That's the scenario. We are very likely to get a higher low compared to 7-April. If too many leveraged positions are open though and the market wants to remove those, there can be a long wick that pierces support for the action to recover the next day.
So, the drop can be fast, can be small, can be hard, can be easy or it can be short, it doesn't matter, once it is over, Dogecoin will continue to grow.
Patience is key.
Thanks a lot for your continued support.
Namaste.
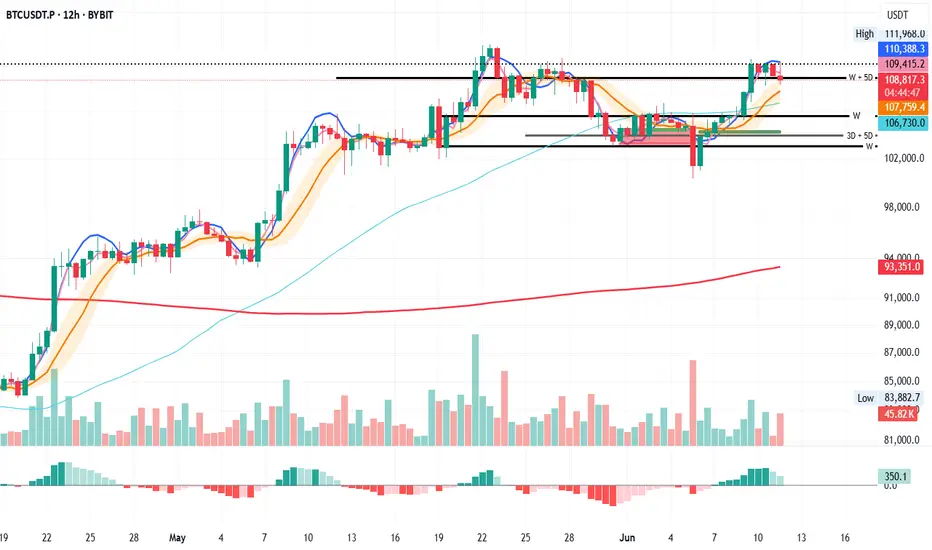
Bitcoin's Support in Focus: Stay Alert for Candle Closes
BTC on the 12H looks ready to close below the recently claimed W + 5D support.
It’s a signal to stay sharp and stick to a solid plan: but not a call to action just yet.
Let’s see how the next 3 to 5 candle closes unfold.
Always take profits and manage risk.
Interaction is welcome.
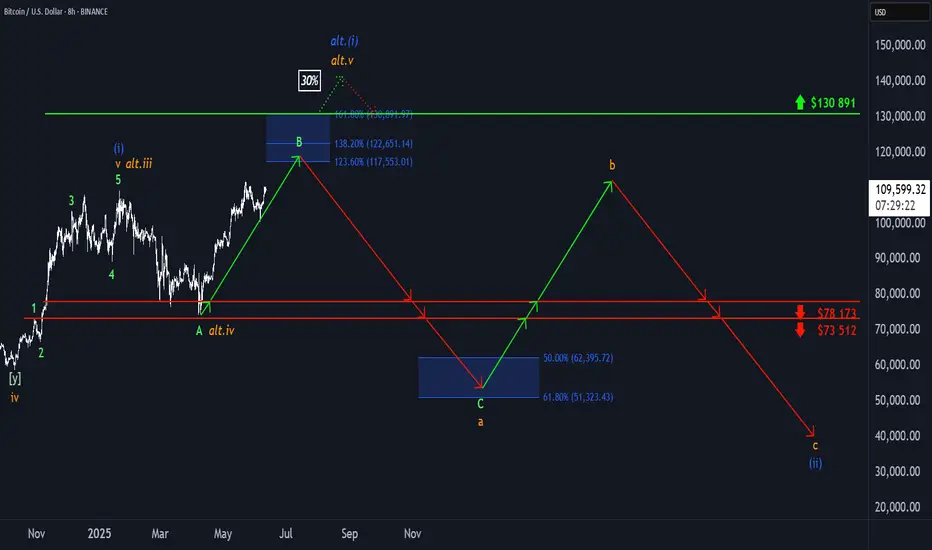
Bitcoins Path?The is how I'm looking to play CRYPTOCAP:BTC over the coming years.
It is my belief that we completed Wave 1 of the SuperCycle and Wave 2 has just begun

₿ Bitcoin: Further Upside ExpectedBitcoin (BTC) pulled back slightly in yesterday’s session but remains on track to continue its corrective rally within green wave B. In line with our primary scenario, this advance is expected to reach the blue Target Zone between $117,553 and $130,891. Afterward, we anticipate the onset of wave C, which should initiate a substantial decline—driving the price down into the lower blue zone between $62,395 and $51,323. This is also where we expect orange wave a to conclude. From there, wave b should provide a temporary rebound before wave c resumes the broader downtrend, ultimately completing blue wave (ii). That said, there’s still a 30% probability that blue wave alt.(i) has not yet topped. In this alternative scenario, BTC would extend higher, potentially breaking above resistance at $130,891 before the corrective phase resumes. The daily chart illustrates the entire five-wave blue sequence and shows our expected low for wave (ii) within the blue zone between $37,623 and $26,082.
📈 Over 190 precise analyses, clear entry points, and defined Target Zones - that's what we do.
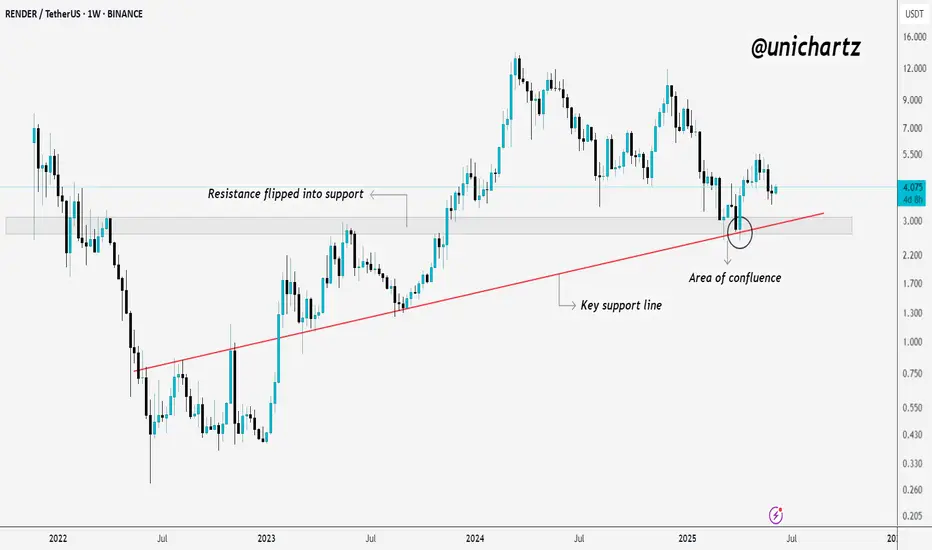
RENDER Bounces from Strong Confluence Zone$RENDER/USDT Update
RENDER is holding well above the key support zone after a clean retest of the area of confluence.
What’s interesting here is that the old resistance has now flipped into support, this is often a strong bullish signal on higher timeframes.
Price bounced exactly where you’d expect, at the intersection of horizontal support and the rising trendline.
As long as RENDER continues to respect this zone, the structure remains bullish.
DYOR, NFA
Thanks for following along — stay tuned for more updates!
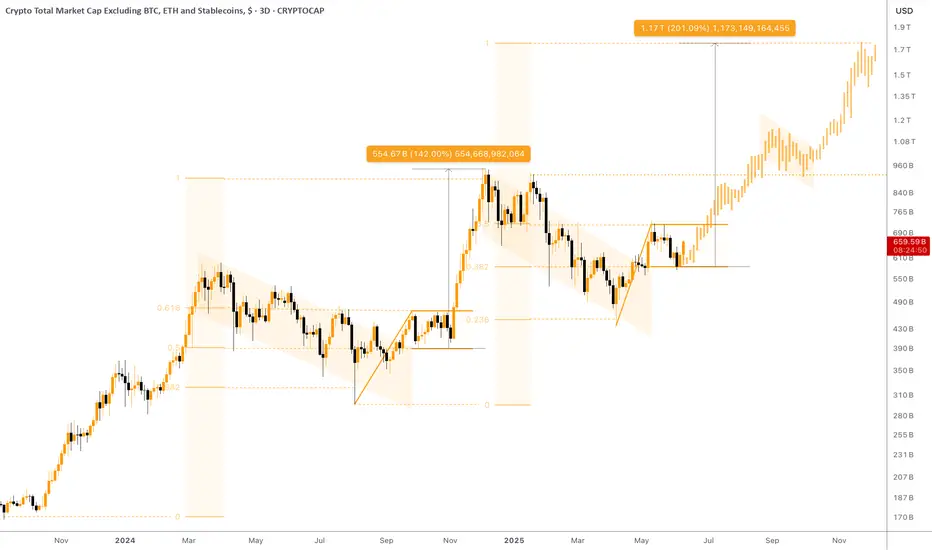
Altcoin MarketCap - Consolidating Before the Ride!On the chart you can see a Pure Capitazation of Altcoins - Crypto Market Cap Excluding Bitcoin, Ethereum and ALL Stablecoins.
There was formed a very clear model that has all chances of repeating once again:
First goes a strong ascending movement from 0 to a bit higher than 0.618 Fibo lvls.
Then there is a correction inside the descending channel/bull flag down to ~0.382 with one long shadow below that sets a 0 point for a new cycle.
Breakout of a bull flag follows after.
Final stage before the growth is consolidation in the range of 0.382 and 0.5 levels by Fibo.
Pump.
We are currently at the 4th stage , as you might have guessed. The consolidation can still take some time, up to a couple of months, since there are no specific time restrictions that invalidate the model.
However, this doesn't cancel the fact that the target is 1 by Fibo, namely $1.7T MarketCap of Altcoins, which is x2 from current points . I tend to believe holders deserve such a run.
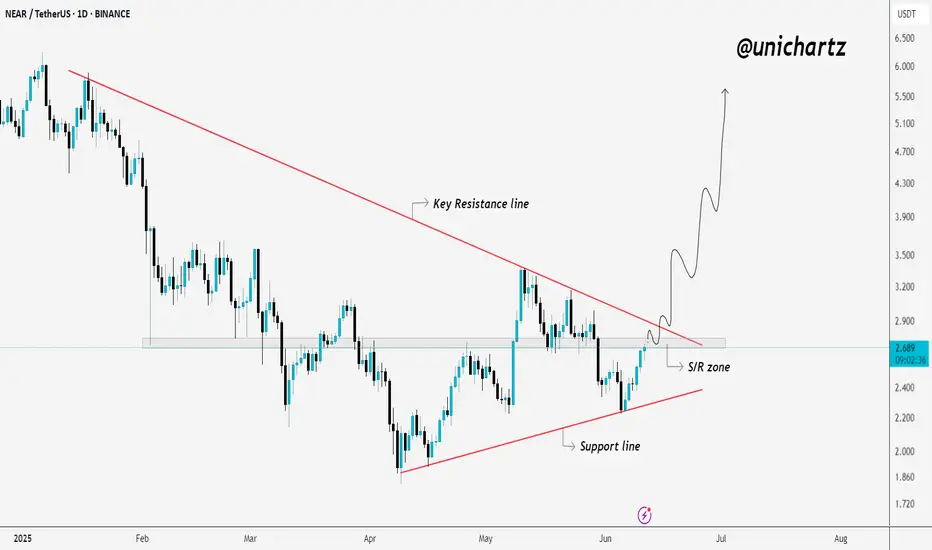
Breakout Watch: NEAR Approaching Moment of Truth If you want, ICBOE:NEAR is currently testing the breakout zone but is still holding below the key trendline.
It’s a critical spot — if NEAR manages to break and close above this trendline, it could unlock further upside. For now, the trendline remains intact, so patience is needed here.
Watching closely to see if the breakout gets confirmed or if we see another rejection.
DYOR, NFA
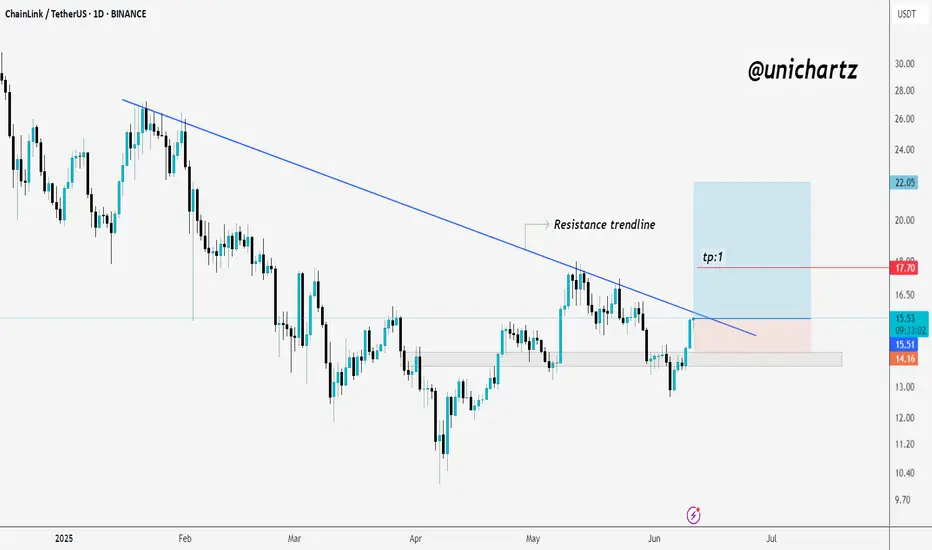
LINK Structure Shaping Up for Potential BreakoutvChainlink is now approaching a key resistance trendline after showing a strong bounce from the recent demand zone.
Price is pushing into this trendline with good momentum. If we see a clear breakout and daily close above it, this could open the door for a continuation move toward the next target area around seventeen point seven dollars.
However, this is still an important level to watch. If the trendline holds and price gets rejected, a pullback toward the demand zone near fourteen dollars is possible.
At this stage, the chart is showing a constructive setup. It’s worth keeping an eye on how price behaves here in the coming sessions.
Thanks for reading
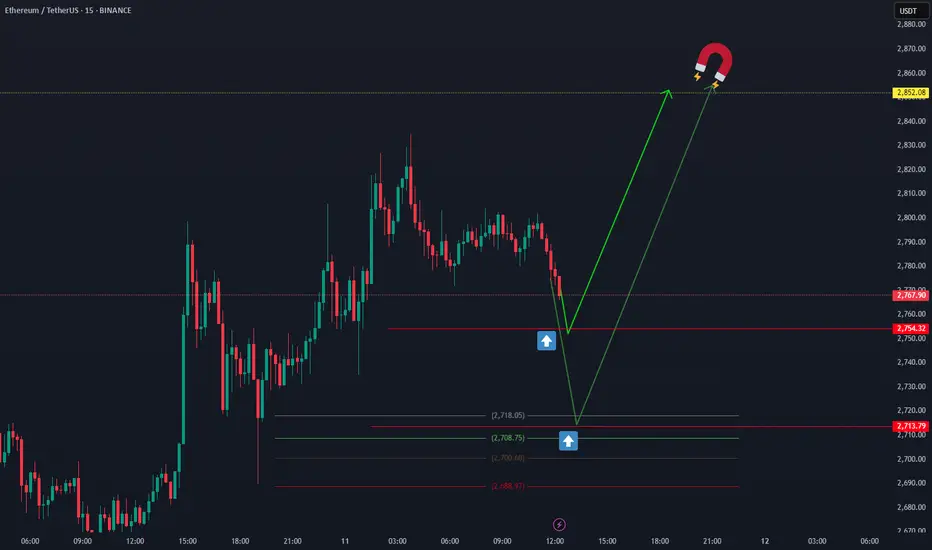
ETHUSDTEthereum could move from these two price areas to 2852.08,
It seems like a definite move at that price. BINANCE:ETHUSDT
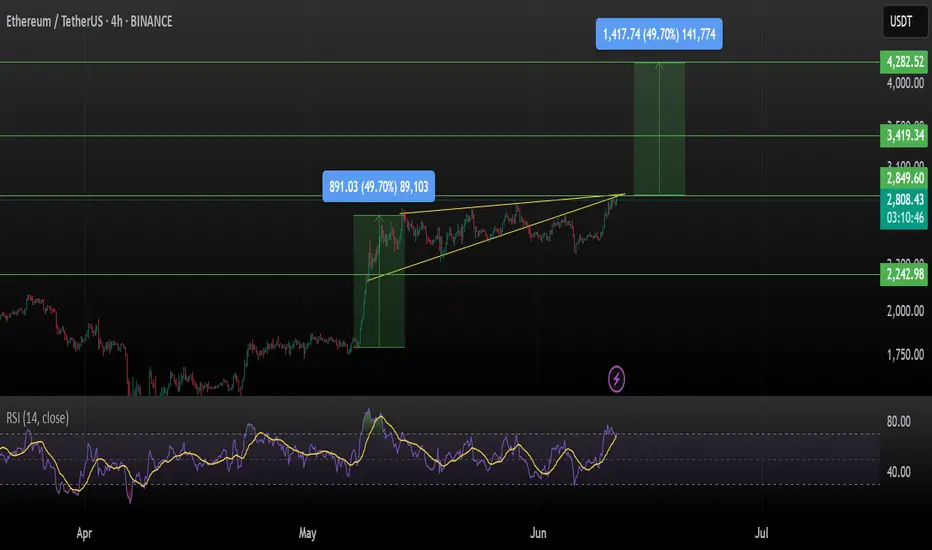
Ethereum (ETH/USDT) – Ascending Triangle Breakout Incoming?ETH is pressing against the upper resistance of a long-forming ascending triangle on the 4H chart — historically a bullish continuation pattern.
Previous Move:
Last breakout saw a +49.7% move, and the structure suggests we could see a similar surge again!
Key Levels:
Support: $2,242.98
Breakout Zone: $2,850
Resistance/Target 1: $3,419
Major Target 2: $4,282 (+49.7%)
RSI: 70.5 — strong momentum, near overbought but in breakout territory.
Volume seems to be increasing near resistance, a breakout could be imminent.
Potential Upside: +49.7% if triangle breaks cleanly.
Bias: Bullish
Timeframe: 4H
Watch for: Rejection at $2,850 or breakout retest for entry confirmation.
This is not financial advice, please do your research before investing, as we are not responsible for any of your losses or profits.
Please like, share, and comment on this idea if you liked it.
#ETH #Ethereum #ETHUSDT
TradeCityPro | Bitcoin Daily Analysis #114👋 Welcome to TradeCity Pro!
Let’s go over Bitcoin analysis and the key crypto indexes. As usual, I’ll break down the futures triggers for the New York session.
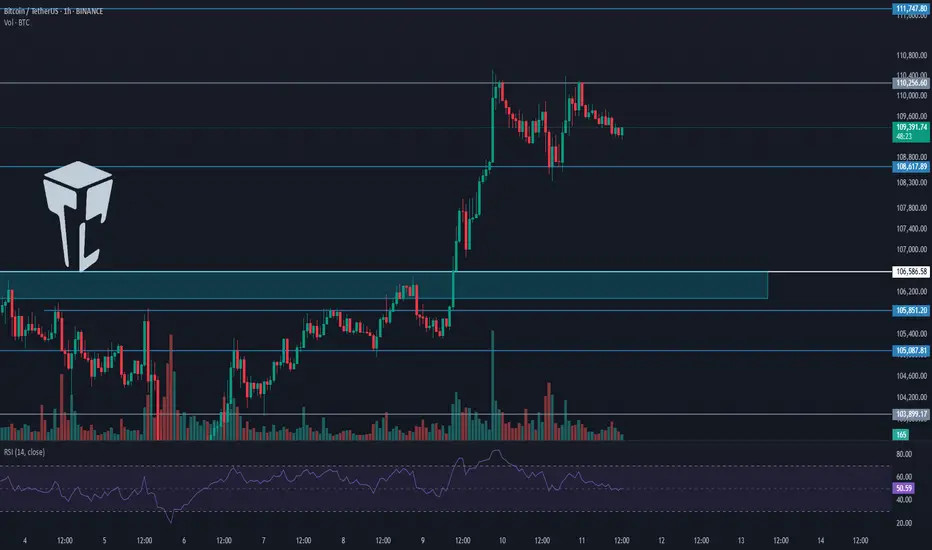
⏳ 1-Hour Timeframe
On the one hour timeframe, as you can see, a trading range has formed between the levels of 108617 and 110256. This has happened after a strong upward move with significant buying volume, and now we’re in a market correction phase.
📊 Market volume is decreasing during this corrective phase, which shows the strength of the buyers and supports the ongoing uptrend. RSI has exited the Overbuy zone and is now cooling off, which indicates that the bullish momentum has weakened for now.
📈 For a long position, the 110256 trigger seems very suitable today. If the price forms a higher low above 108617 before breaking this level, the probability of breaking 110256 increases significantly.
💥 If this trigger is activated, it’s crucial that volume rises as well. That would confirm the strength of the trend and increase the chances of the uptrend continuing. The current target for this position is 111747.
🔽 In the correction scenario, if the price stabilizes below 108617, this scenario becomes more likely and a deeper correction could follow.
✨ Personally, I won’t open a short position unless we get confirmation of a trend reversal. But if you want to go short, a break below 108617 is not a bad option and could signal a downward move.
👑 BTC.D Analysis
Bitcoin dominance has continued its downward movement, stabilized below 64.12, and is now heading toward 63.93.
⭐ If the 63.93 low is broken, the bearish move in dominance will likely continue. If it pulls back, a break above 64.12 will confirm that retracement.
📅 Total2 Analysis
Let’s look at Total2. Yesterday, it broke through the 1.2 level and is now moving toward 1.24. A breakout above this level could start the next bullish leg.
🎲 If a correction occurs, the price may drop back to 1.2 or even 1.18.
📅 USDT.D Analysis
Now for Tether dominance. This index is still sitting at the 4.56 support and is currently being held there. If 4.56 breaks, the next bearish leg can form.
🔔 In case of a retracement, USDT dominance might rise to 4.64.
❌ Disclaimer ❌
Trading futures is highly risky and dangerous. If you're not an expert, these triggers may not be suitable for you. You should first learn risk and capital management. You can also use the educational content from this channel.
Finally, these triggers reflect my personal opinions on price action, and the market may move completely against this analysis. So, do your own research before opening any position.
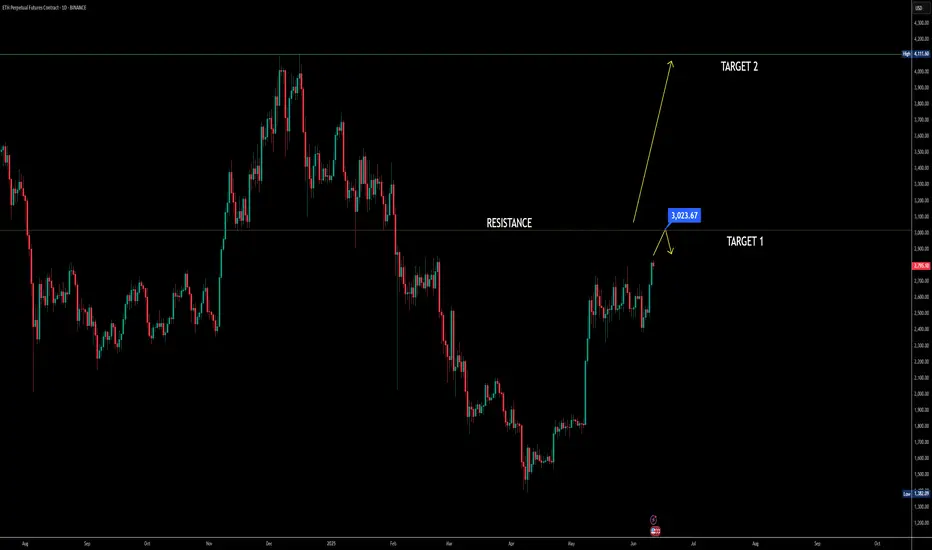
ETHEREUM Potential Bullish BreakoutEthereum price seems to exhibit signs of overall potential Bullish momentum if the price action forms a prominent Higher High with multiple confluences through key Fibonacci and Support levels which presents us with a potential long opportunity.
Trade Plan:
Entry : 2950
Stop Loss : 2200
TP 1 : 3700

$Eth Breaks Key Resistance! Is $4100 Coming Next? Ethereum has officially broken above its previous resistance at $2900 and is now aiming for the critical $3000 psychological level. Here's a step-by-step breakdown of what to expect next, including MACD, RSI signals, and CPI data impact.
🔹 Step 1: Breakout Confirmation
Ethereum has successfully broken above the $2900 resistance level — this area is now acting as immediate support.
🔹 Step 2: Next Short-Term Target – $3000
ETH is expected to hit the round number resistance at $3000, which is the next major level to watch. This is the first price target.
🔹 Step 3: MACD & Stochastic RSI Support Bullish Move
MACD is crossing to the bullish side, showing increasing momentum.
Stochastic RSI is also favoring bullish continuation — indicating a likely move to $3000 and beyond.
🔹 Step 4: Possible Rejection Zones
If ETH faces rejection near $3000 or $3500, especially if Bitcoin shows weakness or stalls, expect a pullback.
🔹 Step 5: Target 2 – $4100 if Breakout Continues
If ETH convincingly breaks above $3000 and sustains momentum, $4100 becomes the next major target. This level aligns with the previous high and potential macro continuation.
🔹 Step 6: Watch CPI Data Impact
A positive CPI reading will strengthen bullish sentiment and help ETH push toward $4100.
A negative CPI surprise might trigger a reversal — but even in that case, a short-term hit of $3000 remains likely.
Key Levels to Watch:
Support: $2900, $2800
Resistance: $3000 (Target 1), $3500 (Interim), $4100 (Target 2)
Ethereum's price structure looks bullish above $2900, supported by technical indicators and macro optimism. The $3000 level is within reach, and if momentum continues, $4100 is the next upside target. Keep an eye on BTC behavior and CPI release for confirmation or reversal signals.
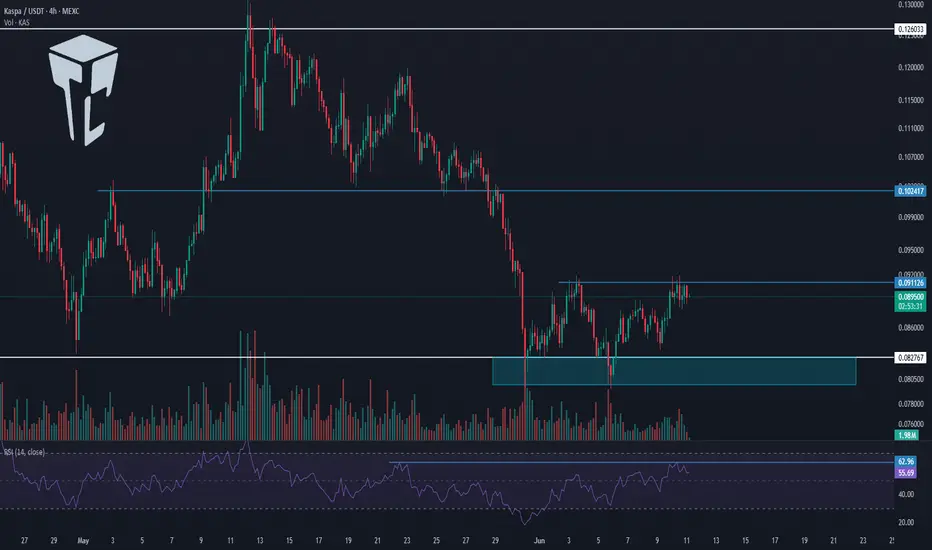
TradeCityPro | KAS Ranges Near Top with Bullish Momentum Rising👋 Welcome to TradeCity Pro!
In this analysis, I want to review the coin KAS for you. It’s one of the Layer One projects, and its token currently ranks 40 on CoinMarketCap with a market cap of 2.35 billion dollars.
⏳ 4-Hour Timeframe
On the four hour timeframe, the price is moving inside a range box between the levels of 0.082767 (which I’ve also marked as a zone) and 0.091126, and is currently near the top of the box.
✔️ Considering that other coins and market indexes like Bitcoin and Total2 are showing bullish confirmations, the activation of this coin’s long trigger could initiate a strong upward move.
📊 The volume increase shown on the chart is another reason why the probability of breaking the top of the box has gone up.
📈 For a long position, we can enter with the trigger at 0.091126. If the breakout candle comes with strong volume, we’ll have volume confirmation as well, and momentum confirmation will come from RSI breaking above 62.96.
✨ Given the confirmations, the likelihood of this trigger activating seems high, and we can target a move to 0.102417 or even 0.126033.
🛒 For a spot buy of this coin, it’s better to wait for a break above 0.126033. We can open a futures position at the 0.091126 trigger aiming for 0.126033, and once the price reaches 0.126033, we can use the profits from the futures trade to enter the spot market.
🔽 As for bearish movement and a short trigger, the first sign would be rejection from the 0.091126 area. The main trend reversal trigger will be the breakdown of the support zone.
📝 Final Thoughts
This analysis reflects our opinions and is not financial advice.
Share your thoughts in the comments, and don’t forget to share this analysis with your friends! ❤️
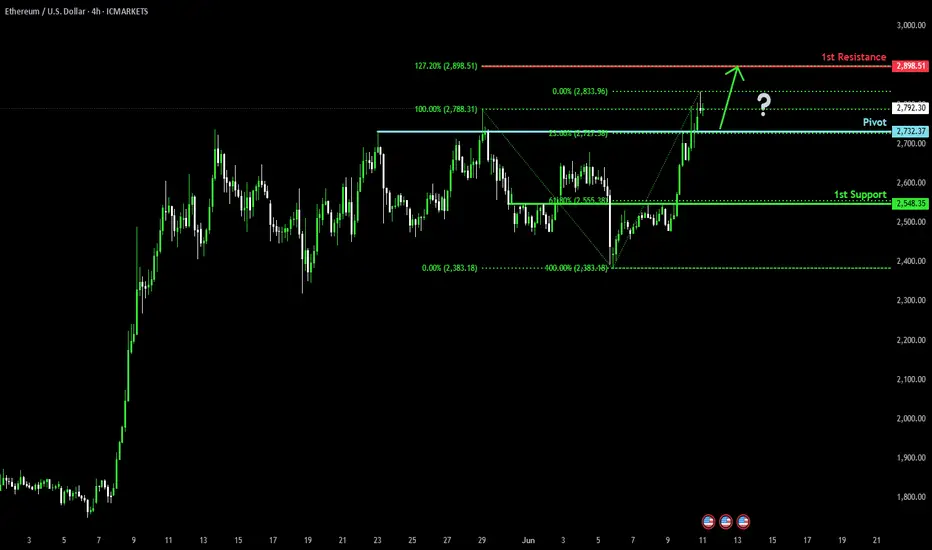
Bullish continuation?Ethereum (ETH/USD) is falling towards the pivot and could bounce to the 1st resistance.
Pivot: 2,732.37
1st Support: 2,548.35
1st Resistance: 2,898.51
Risk Warning:
Trading Forex and CFDs carries a high level of risk to your capital and you should only trade with money you can afford to lose. Trading Forex and CFDs may not be suitable for all investors, so please ensure that you fully understand the risks involved and seek independent advice if necessary.
Disclaimer:
The above opinions given constitute general market commentary, and do not constitute the opinion or advice of IC Markets or any form of personal or investment advice.
Any opinions, news, research, analyses, prices, other information, or links to third-party sites contained on this website are provided on an "as-is" basis, are intended only to be informative, is not an advice nor a recommendation, nor research, or a record of our trading prices, or an offer of, or solicitation for a transaction in any financial instrument and thus should not be treated as such. The information provided does not involve any specific investment objectives, financial situation and needs of any specific person who may receive it. Please be aware, that past performance is not a reliable indicator of future performance and/or results. Past Performance or Forward-looking scenarios based upon the reasonable beliefs of the third-party provider are not a guarantee of future performance. Actual results may differ materially from those anticipated in forward-looking or past performance statements. IC Markets makes no representation or warranty and assumes no liability as to the accuracy or completeness of the information provided, nor any loss arising from any investment based on a recommendation, forecast or any information supplied by any third-party.
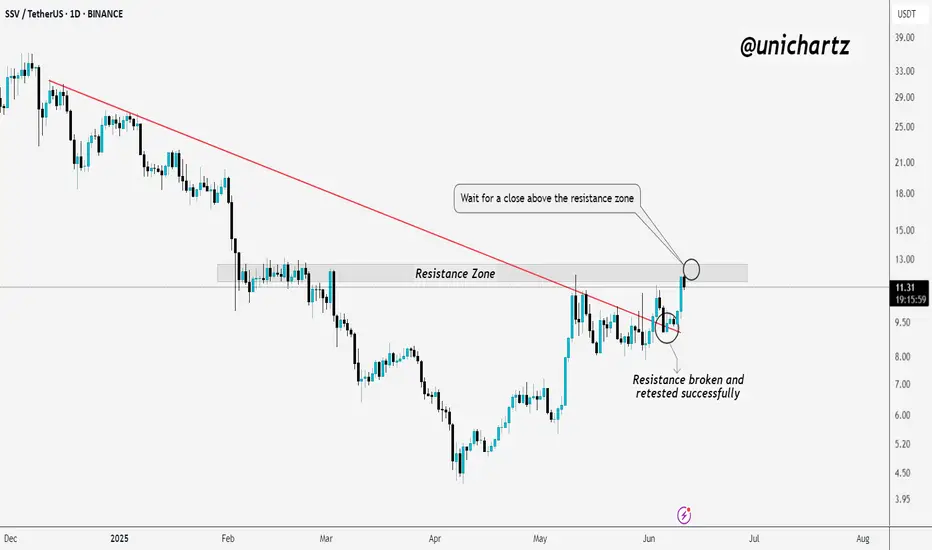
SSV | Bullish Market Structure Shift in PlayTSXV:SSV is showing strong bullish momentum. The key resistance line has been broken and successfully retested, confirming a shift in market structure.
Now, price is testing the major resistance zone. For further upside confirmation, it's important to wait for a clear daily close above this resistance zone.
If the breakout holds, this could open the door for the next leg higher. One to keep on your watchlist.
DYOR, NFA
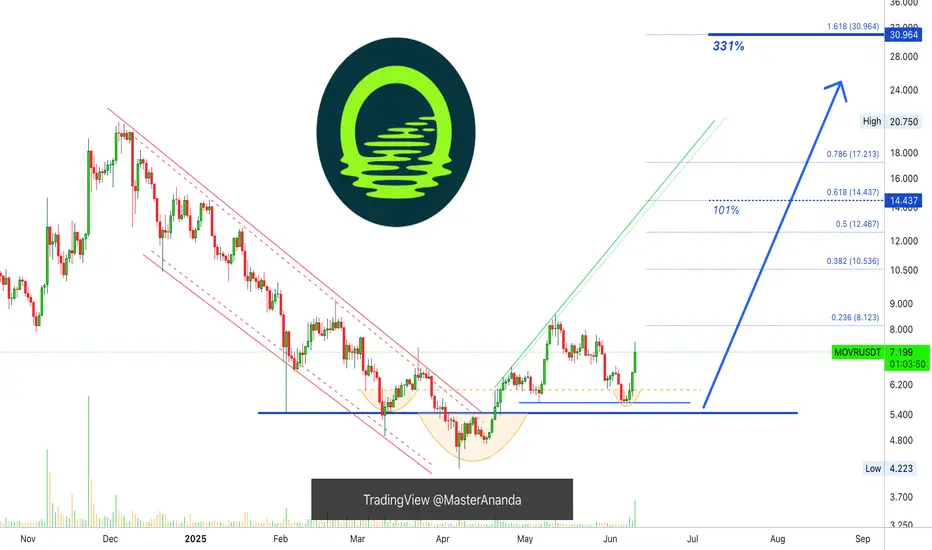
Moonriver 331% Profits Potential Target Mapped (Volume Breakout)Moonriver today produced the highest volume daily since December 2024. The big difference between now and then lies in the fact that in December MOVRUSDT was trading near a peak while today it is coming out of a higher low. Increasing volume in this situation means the start of something positive for the bulls.
For example, last year after some bearish action the first high volume candle came in October. After some choppy action, we experienced a strong bullish wave.
So now we have high volume today and this is only the start. We will see grow and more volume and bullish momentum building up... It will all accumulate and culminate in a massive bull run.
Thanks a lot for your continued support.
Namaste.
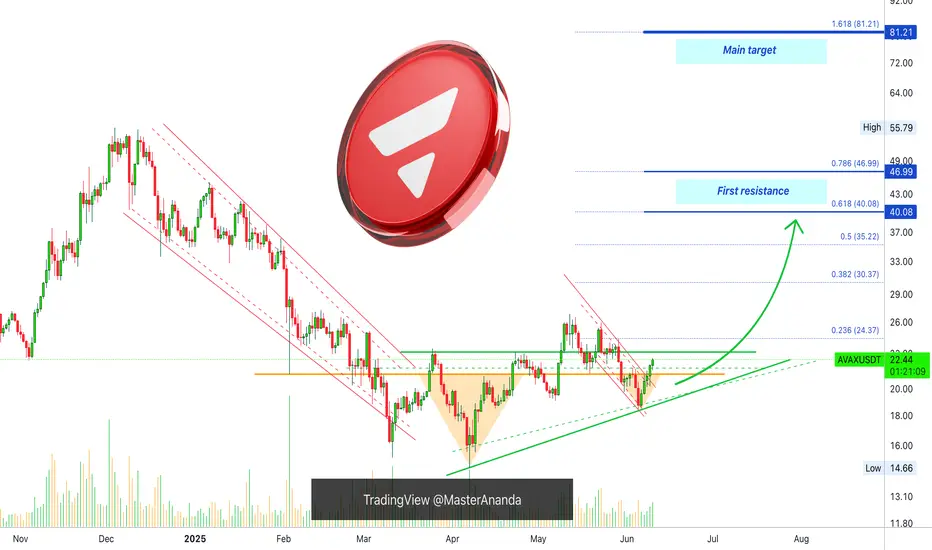
Avalanche Recovers & Then Some... (Targets: $40-$46 & $81)I will keep it short, sweet and simple. Avalanche is recovering nicely with five consecutive days closing green; higher low; trading back above the 3-Feb. low (orange line) and marketwide bullish action.
The action is happening in the green zone, the bullish zone and a local higher low will lead to a higher high with a target of $40 first. This is the next target and it is an easy one. It will definitely move higher but consider $40-$46 the first strong barrier.
The main target sits at $81. I think the time horizon for this one is 1-3 months. Within 3 months, all these targets will be hit and then we will be blessed with additional growth.
Thanks a lot for your continued support.
If you enjoy the content, feel free to follow. I share new charts every single day.
It is my pleasure to write for you.
Namaste.
ETH Daily Close Signals Entry
On the daily, ETH is closing above both the 200MA and the previous tops. PSAR on the original system has flipped, though the free-to-use version hasn’t yet.
This is a trading idea. If you choose to allocate real capital, be prepared for the possibility of loss. But if you trust the system enough to allocate capital, trust that the PSAR has flipped and today’s close marks the entry.
It’s exactly how the system defines a valid setup:
Daily close above the 200MA, with MLR > SMA > BB center.
The 12H timeframe acts as confirmation from the lower TF, and the 4H is already green and ripping.
So buckle up—this could be a ride worth taking.
Always take profits and manage risk.
Interaction is welcome.
ETH – System Trigger Hit
ETH on the 12H has just reclaimed the green line: resistance from the previous tops.
This level sits roughly midway between the 0.5 and 0.382 Fib levels, with \$3000 now looking closer than \$2500.
PSAR has just flipped above the last tops, and price is now above MLR > SMA > BB center > 200MA.
All system conditions are met for a long entry on this timeframe.
This also comes as confirmation of the daily signal entry at today closing
Always take profits and manage risk.
Interaction is welcome.

Worldcoin, How Long Will It Take For A $30 (2,544%) Target?Do you think a $30 target is possible for Worldcoin in under 6 months? What about a target of $19?
$19 gives 1,552% while $30 would yield a total of 2,544%. That's potential profits for this newly developing bullish wave.
The low was hit more than two months ago already, 7-April. This is important. Normally the build-up process takes some three months, and we are already two months in. This means that next month the market can become extremely green. Or by the start of next month everything will be 3 to 5 levels up. For Worldcoin this would be a minimum target of $9. That's 729% potential profits.
Two months just to recover from the market bottom. Three months for bullish momentum to be fully present and a new high established. Then a retrace or correction and then the final jump, makes sense? This is just a map, it can help us navigate the market, plan ahead.
We adapt to market conditions though as things can always change but this is the picture. This is how it always goes. The surprise can be prices moving beyond our calculations and that is always a nice surprise and welcomed.
Six months from now will put us in December 2025.
The next top can happen between October and December this year. These are good dates.
Since this project peaked in March 2024, no strong high in late 2024 or early 2025, this can be one of the pairs that continue growing into 2026.
Remember, some will end their bull market this year for sure and enter a bear market, others will continue growing into 2026. This is the most important part to keep in mind, it will make all the difference when taking profits.
We will continue with this thought process in one of the next charts.
I think of you when reading.
(I mean, "Thank you for reading.")
Namaste.
