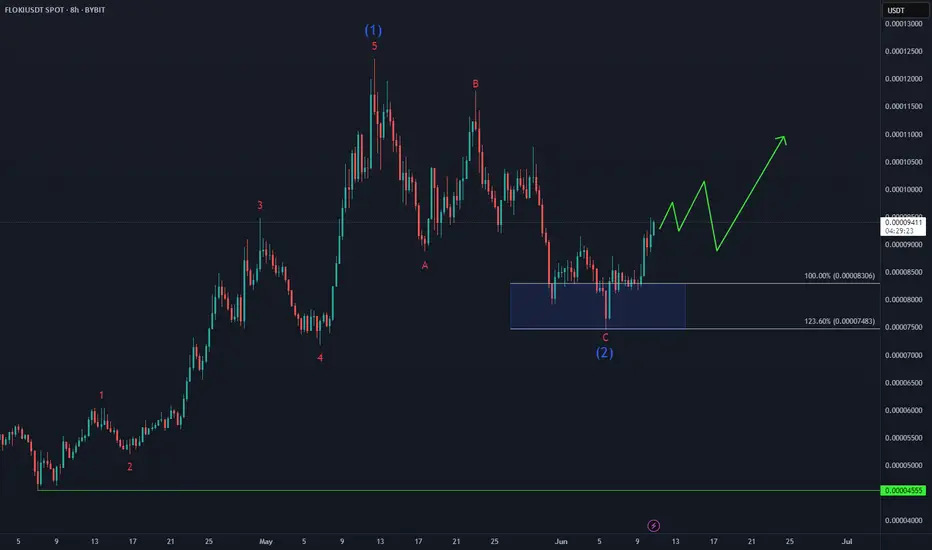
FLOKI Correction Complete & Ready to Rally!📊 CRYPTO:FLOKIUSD found strong buying interest in the blue box area at $0.000083 - $0.000074, setting the stage for a trend continuation to the upside.
🚀 Will momentum push it toward new highs?
Cryptomarket
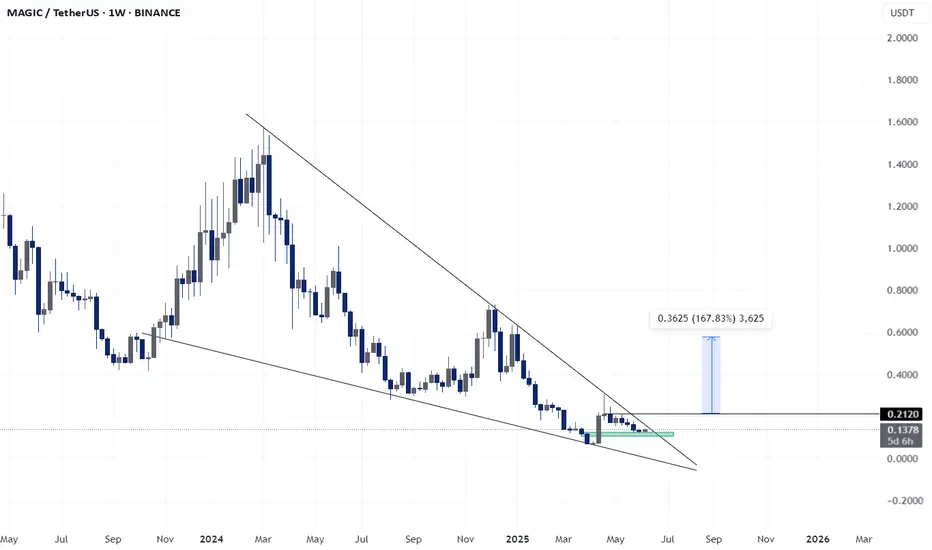
MAGIC - LONG SET-UP BINANCE:MAGICUSDT
𝐌𝐀𝐆𝐈𝐂/𝐔𝐒𝐃𝐓
Magic is breaking out of a long-term falling wedge pattern, a classic bullish reversal setup. With clear support at $0.125 and resistance at $0.2120 breached, this chart implies a potential 167% upside move toward the $0.36+ zone. Momentum building
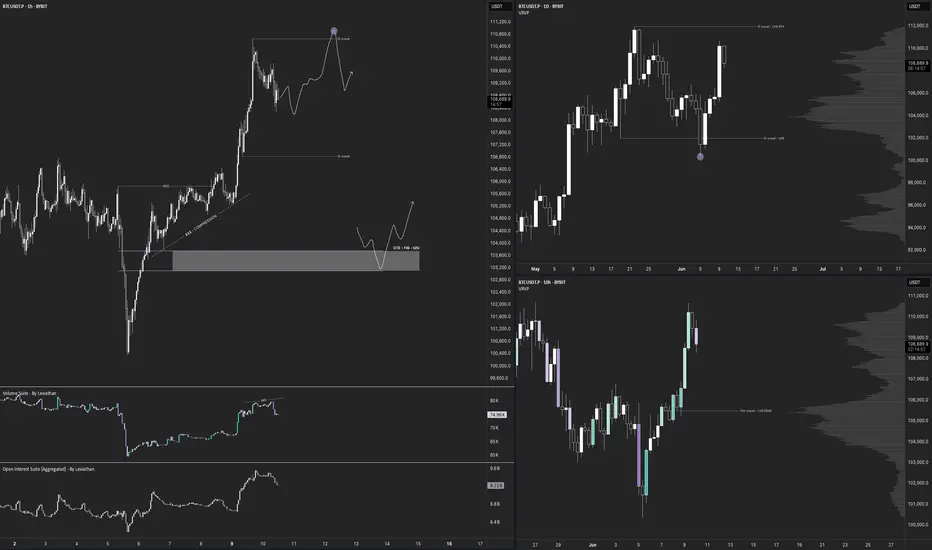
$BTC - Top Down BYBIT:BTCUSDT.P Top Down (10/06/25)
V-Levels Bias
Weekly = Bullish
Daily = Bullish
10-Hour = Bullish
1-Hour = Bullish
V-Levels Momentum
Weekly = Bullish
Daily = Bullish
10-Hour = Neutral
1-Hour = Neutral
Analysis & Insights
DeCode Market Breakdown
Macro Context
Overall, the Weekly structure remains bullish — both in bias and momentum. We’re trading below a key level at $111,968.0, and continuation is likely unless we see a clear Failed Auction at that level.
That would trigger some serious red flags and force a reevaluation of the directional bias.
Daily Chart
Daily structure is extremely bullish at the moment.
The price recently showed a Failed Auction around the $102,000.0 V-structure Higher Low — indicating aggressive absorption and buyer strength.
As long as price holds above that area, the priority is to stay on the long side.
⸻
10-Hour Chart
Still holding a bullish structure overall.
One thing I’ll be watching closely: the price reacting to the previous High at $110,660.8.
If we get a rejection + Failed Auction at that level, that opens up the possibility for intraday shorts; as a short-term shift in momentum and local resistance kicks in.
1-Hour Chart
📈 Long Setup: Waiting for a clean entry from an OTE / Fib zone + Over/Under structure.
📉 Short Setup: Watching for a sweep of the current highs + a clear Failed Auction (ideally with footprint confirmation).
There’s visible compression between $104k and $105k, so price might look to grab liquidity there first before any real move upward.
10-Min Chart
Currently, no clear trade setups on the 10M.
The 1H hasn’t reached optimal trade zones yet. I’ll be watching closely for any structure shifts or setups aligning with the macro bias.
⸻
🔍 Trading Plan Summary
Bias: Bullish (Weekly + Daily)
Look for longs aligned with HTF support + intraday confirmation
Short opportunities only if we get clear rejection from $110,660.8 + footprint signals
Bitcoin - Here we have the all time high!Bitcoin - CRYPTO:BTCUSD - is just getting started:
(click chart above to see the in depth analysis👆🏻)
It was really just a matter of time until we see a new all time high on Bitcoin. Consindering that over the past two months alone, Bitcoin rose another +50%, this was a clear indication that bulls are taking over. But this all time high is clearly not the end of the bullrun.
Levels to watch: $300.000
Keep your long term vision!
Philip (BasicTrading)

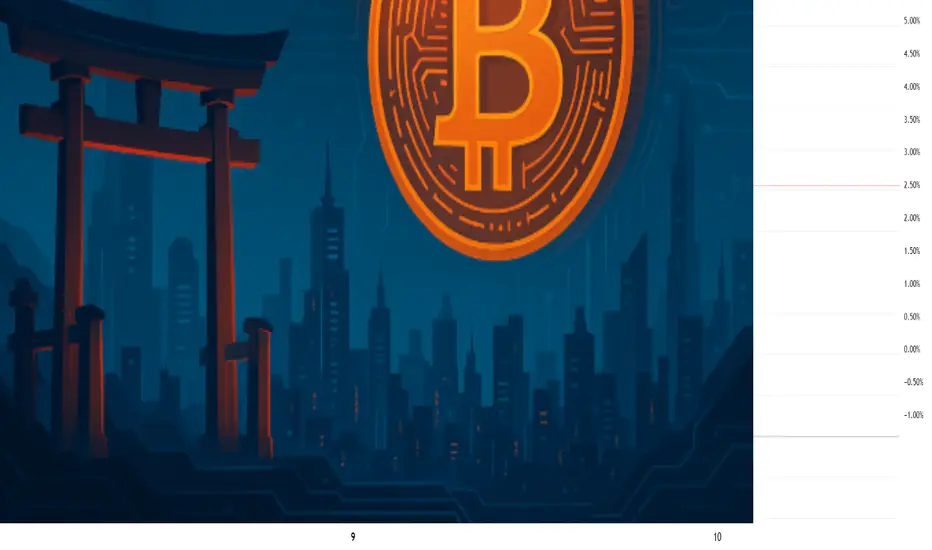
Japan’s Metaplanet to Invest $5.4 Billion in Bitcoin: A Bold StrAmid growing global interest in cryptocurrencies, Japanese investment firm Metaplanet has announced plans to invest $5.4 billion in Bitcoin. This strategic move places the company alongside the largest corporate Bitcoin holders and reflects Japan’s evolving financial stance, where digital assets are beginning to play a more prominent role.
According to Metaplanet, the firm intends to acquire approximately 210,000 BTC by 2027, representing nearly 1% of Bitcoin’s total supply, which is capped at 21 million coins. This initiative is aimed at hedging against inflation and the depreciation of the yen, while also strengthening the company’s position in global financial markets.
Unlike traditional funds, Metaplanet is committed to a long-term holding strategy (hodling) rather than speculative trading. This signals growing confidence in Bitcoin as a store of value comparable to gold. The company also anticipates increasing institutional demand and the potential recognition of Bitcoin as a reserve asset by central banks.
This move is also seen as a step toward legitimizing Bitcoin across Asia. Analysts suggest that other Japanese and South Korean companies may soon follow Metaplanet’s lead.
The $5.4 billion Bitcoin investment is more than a financial move—it’s a statement about the future. Metaplanet is showing that digital assets are becoming an integral part of modern macroeconomic strategy.
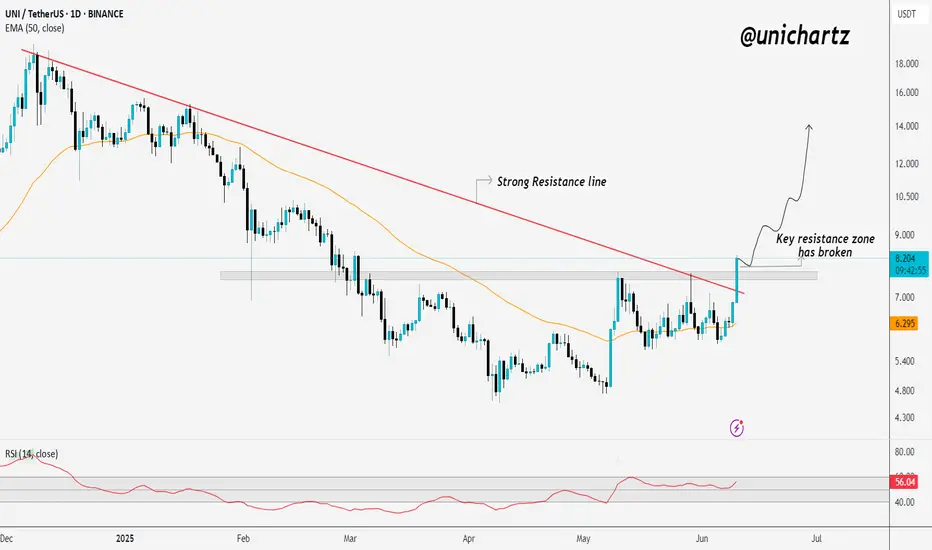
UNI/USDT Breakout: Bulls in Control?BME:UNI / USDT 1D Chart Update
UNI/USDT has just broken above a key resistance zone and cleared the strong descending resistance line.
This breakout is significant; it shifts market structure in favor of the bulls.
As long as UNI holds above the breakout zone, the path is open for further upside.
If momentum continues, we could see a strong move toward higher targets in the coming days.
One to keep a close eye on.
DYOR, NFA
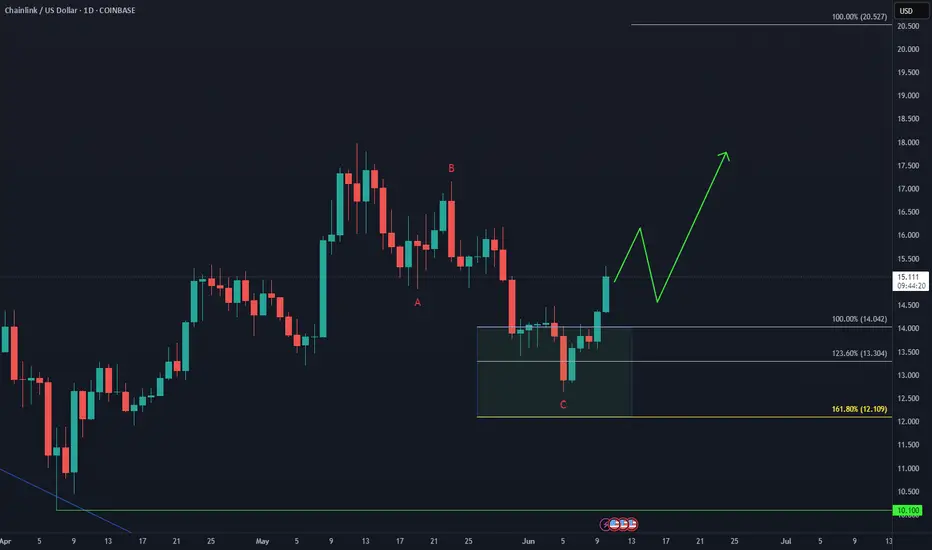
ChainLink LINK gearing up for a move back toward $20CRYPTO:LINKUSD found strong buyers in the $14 - $12 equal legs zone after a three #elliottwave pullback, setting the stage for the next upside push.
Momentum is shifting—are you ready for the breakout?
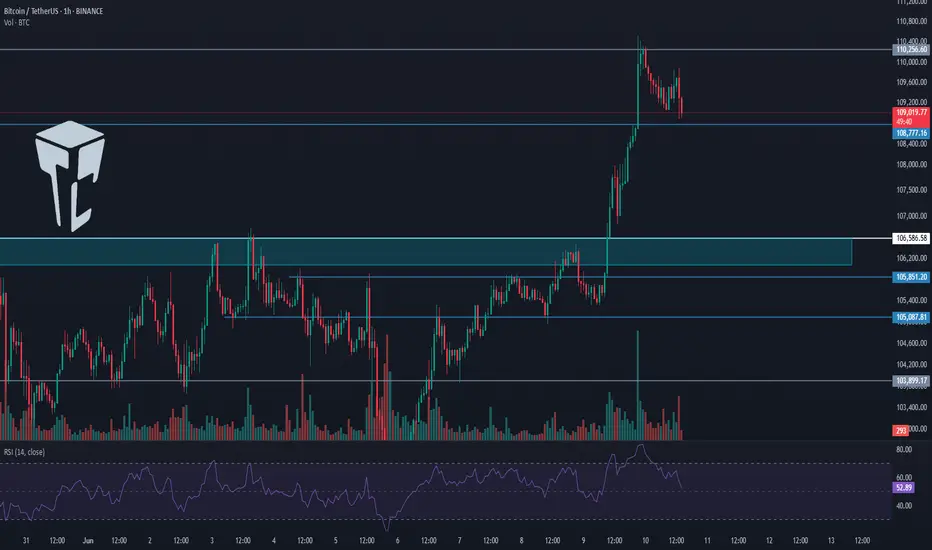
TradeCityPro | Bitcoin Daily Analysis #113👋 Welcome to TradeCity Pro
Let’s dive into the Bitcoin analysis and key crypto indexes. As usual in this analysis, I’ll walk you through the futures triggers for the New York session.
⏳ 1-Hour Timeframe
As you can see in the one hour timeframe, Bitcoin has continued its upward movement and reached the 110256 level and is now undergoing a correction.
✔️ If the price continues correcting, the next support level will be 108777. In case of a deeper pullback, the next area to watch is 106586.
📈 For a long position, our first trigger level is 110256, with a target of 111747.
📊 Market volume is currently increasing, and if this inflow of buy volume continues, the probability of a bullish move increases.
💥 The RSI oscillator has dropped below the 70 level. If RSI reenters the overbought zone, we’ll also get a strong momentum confirmation.
👑 BTC.D Analysis
Let’s take a look at Bitcoin Dominance. Today, it finally closed below the 64.49 level and has dropped to 64.12.
⚡️ This drop has allowed capital to flow into altcoins, and many of them are moving upward today. If 64.12 breaks, the downtrend may continue.
📅 Total2 Analysis
Moving on to Total2, this index finally broke above the 1.21 level and is now heading toward 1.24.
💫 At the moment, there is no major resistance preventing the market from continuing its upward trend. But there’s an important point regarding USDT Dominance, which I’ll cover below.
📅 USDT.D Analysis
During this bullish move in the market, the dominance of Tether hit the support at 4.56, while other indexes and most altcoins activated their triggers.
🔑 The key point here is that Tether Dominance has such a significant influence on the market that the inability to break this support has caused the entire market, including Bitcoin, to start correcting.
🔽 The 4.56 level in USDT Dominance is very important and will be the key to triggering the next bullish leg.
❌ Disclaimer ❌
Trading futures is highly risky and dangerous. If you're not an expert, these triggers may not be suitable for you. You should first learn risk and capital management. You can also use the educational content from this channel.
Finally, these triggers reflect my personal opinions on price action, and the market may move completely against this analysis. So, do your own research before opening any position.
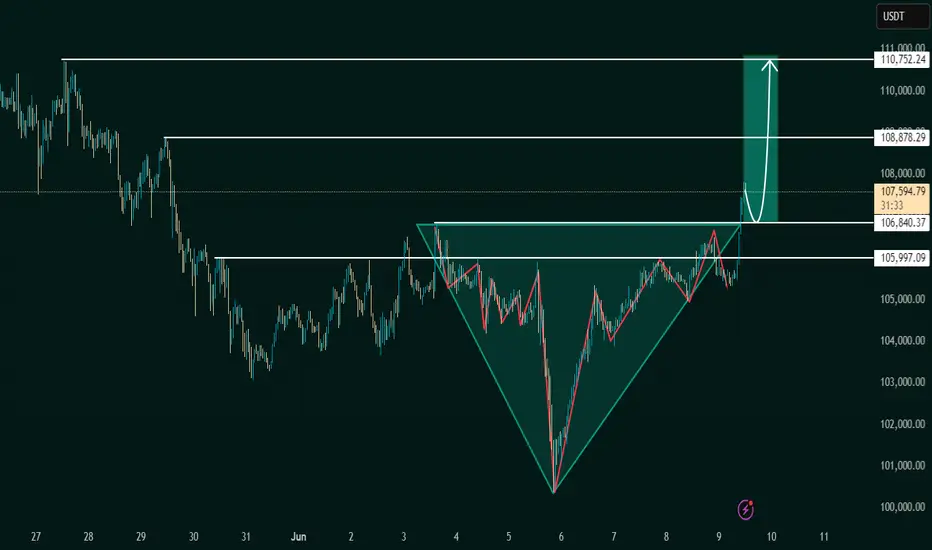
Inverse Head and Shoulders Breakout Signals BullishThe chart under review presents a classic Inverse Head and Shoulders pattern, a reliable and widely recognized bullish reversal formation in technical analysis. This structure typically forms after a downtrend, indicating a potential shift in market sentiment from bearish to bullish.
The pattern is composed of:
Left Shoulder: A modest price decline followed by a temporary upward correction.
Head: A deeper price decline forming the lowest point in the pattern.
Right Shoulder: A higher low that mirrors the left shoulder, followed by another upward movement.
The neckline, which acts as a critical resistance level, is clearly illustrated at approximately 106,840.37 USDT. A confirmed breakout above this neckline suggests the completion of the reversal pattern and validates the potential for a sustained bullish movement.
2. Breakout Confirmation
The current price action confirms a successful breakout above the neckline, with the market currently trading around 107,586.58 USDT. This breakout is a key signal for bullish continuation, provided it is supported by increased volume and follow-through price action.
From a technical standpoint, the breakout is reinforced by:
A clean violation of neckline resistance
Price consolidation near breakout zone before a strong upward thrust
Higher lows preceding the breakout, indicative of growing buying pressure
This confluence of technical signals strengthens the case for an upward price trajectory in the near term.
3. Projected Price Targets
Upon confirmation of the Inverse Head and Shoulders breakout, target levels can be derived using the measured move technique. This involves projecting the vertical distance from the head to the neckline upward from the breakout point.
Target 1 (Initial Resistance):
108,878.29 USDT – This level represents a potential short-term resistance where price may consolidate or retrace slightly before continuing.
Target 2 (Measured Move Completion):
110,752.24 USDT – This is the ultimate price target derived from the height of the head-to-neckline structure. Reaching this level would represent the full realization of the reversal pattern.
4. Key Support and Risk Levels
Risk management is a critical component of any trading strategy. The following support levels should be closely monitored:
106,840.37 USDT (Neckline Support):
Former resistance turned support. Holding above this level post-breakout is essential for sustaining bullish momentum.
105,997.09 USDT:
Acts as a secondary support level and potential stop-loss region for conservative traders.
If price fails to hold above the neckline and falls back below these levels, the breakout could be classified as a false breakout, warranting caution.
5. Strategic Implications for Traders
This setup provides a favorable risk-to-reward ratio for long entries, particularly for traders seeking to capitalize on momentum-based patterns. An optimal trading approach could involve:
Entry: Near the neckline breakout or on a minor retest of 106,840.37 USDT
Stop-Loss: Below 105,997.09 USDT or under the right shoulder to account for volatility
Take-Profit Zones: Partial profits near 108,878.29 USDT, with final target at 110,752.24 USDT
6. Final Remarks
This chart illustrates a textbook example of a bullish reversal pattern in play. While the technical outlook is favorable, traders should remain cautious of potential invalidation scenarios, especially in highly volatile or news-driven markets. Confirmation through volume analysis and supportive macro/fundamental conditions can further enhance confidence in the bullish thesis.
Overall, the current setup indicates a well-structured opportunity for upward price movement, with a clearly defined entry, risk, and reward framework.
Let me know if you'd like this tailored for a trading journal, client report, or automated strategy setup
Smooth Love Potion Classic Bullish Signals & Patterns —Easy 540%Smooth Love Potion (SLP) is now showing a classic set of chart signals, price action and patterns, all these have bullish connotations. An easy target of 182% can be hit next with 540% being possible mid-term.
Good morning my fellow Cryptocurrency trader, the altcoins market continues to heat up and this time for real. Some pairs are not only growing and recovering, but actually producing very strong bullish momentum, just imagine, this is only day one.
Here SLPUSDT has a repeating pattern across many of the altcoins that are moving first. Some pairs will move ahead of others and those with this pattern are the ones in line.
The major crash and low leads to a recovery, this recovery produces a retrace ending in a higher low. The higher low is in and we are all ready and prepared, from this point on we will see massive growth.
We have two targets mainly on the chart, there are more but not highlighted. These are easy targets, which means they have a high level of certainty to hit.
Aim high.
You deserve the best.
Whatever the market throws at you never give up, we win through consistency and perseverance.
Thank you for reading.
Namaste.

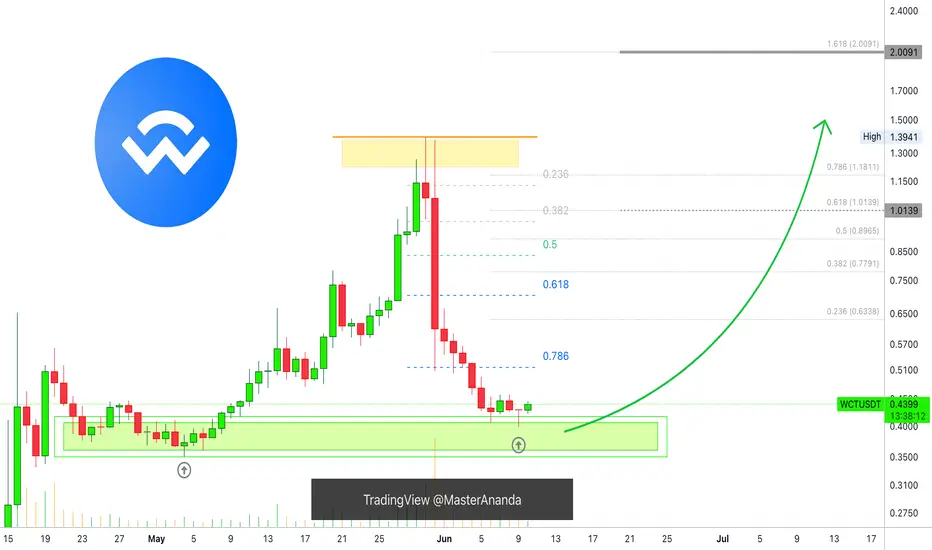
WalletConnect Hits Support, Recovery Wave Turns into Bullish-Wav"What goes up, must come down; What comes down must recover." It is a new saying.
Here we have WalletConnect trading at support. Once support is found, specially after a strong correction, we can expect the market to turn and produce growth.
Consolidation preceding the ath happened between late April and early May. This same zone is the one that was activated as a higher low. A clear support.
We sell at resistance and buy at support. Keeping it simple.
This pair is now a buy. Buy and hold.
Remember to do your own research and planning because market conditions can always change. While we expect a bullish breakout to happen within weeks or days, sometimes it can take months. It can take months but the end result is always growth. We are now in the 2025 altcoins market bull market so buckle up, it will be a wild ride, it will be profitable and it will be fun.
Namaste.
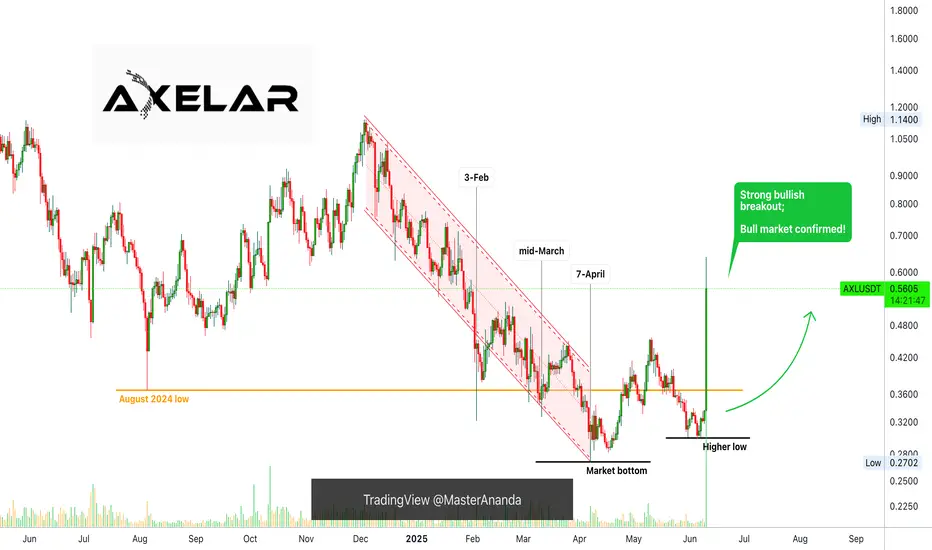
Altcoins Market Bull Market Confirmed, AxelarThis is the same chart as Ravencoin; These are the same price dynamics and awesomely, the same results.
Good morning my fellow Cryptocurrency trader, this is a wonderful day because the altcoins market bull market is already confirmed, let me show you some more proof.
I used first Ravencoin as an early signal showing that the 2025 bull market is here, strong long-term growth; a bullish continuation, a new advance, higher prices next. The biggest bullish wave and bullish action since 2021 for the entire Cryptocurrency market.
Here is the pattern again explained:
1) There is a rise in late 2024, it lasted only one month from November through December. This coming off the August 2024 market bottom, when Bitcoin produced a flush.
2) The December 2024 high leads to a strong correction. This correction has three stop points. 3-Feb. mid-March and 7-April. 7-April marks the bottom for most pairs with the usual variations.
3) An initial recovery from the 7-April 2025 low leads to some growth. Some pairs grew 100-300% while others grew 30-60%.
4) This recovery gets corrected and ends in a higher low.
5) This higher low signal the start of the next advance, very strong bullish action. This is what you see on the chart.
Axelar (AXLUSDT) produced a very strong bullish breakout, we have more than 90% green on a single day. This is only the beginning, and many altcoins will be doing the same. Literally hundreds of altcoins will perform like this in the coming days.
The bull market is here and already confirmed.
It is still early, choose wisely.
Some will move now while others will continue lower.
Some will move but it will take months before they turn green.
Take your time looking at the charts and making your choice, choosing correctly means everything. It means the difference of winning daily and big vs staying holding something doesn't that doesn't grow.
If you agree make sure to follow.
If you have any questions, your comments are welcomed below.
Thanks a lot for your continued support.
Namaste.
BTC.D forecast until Autust 2025This is an update of previously made forecast.
Now is a reversal week. Some alts may start running this week. But the main alts bullrun will start next week. Altseason will come in waves as usually with main events happening in July-August 2025.
Some lagging altcoins in the outskirts of crypto markets may show incredible profits in the end of August and will mark the end of 2025 summer altseason.
Don't get driven away, don't use leverage. In September we may see DXY reversal and bear market start. This will be epic for leverage and making fortunes.
For 1D charts look my Profile 'Also on'
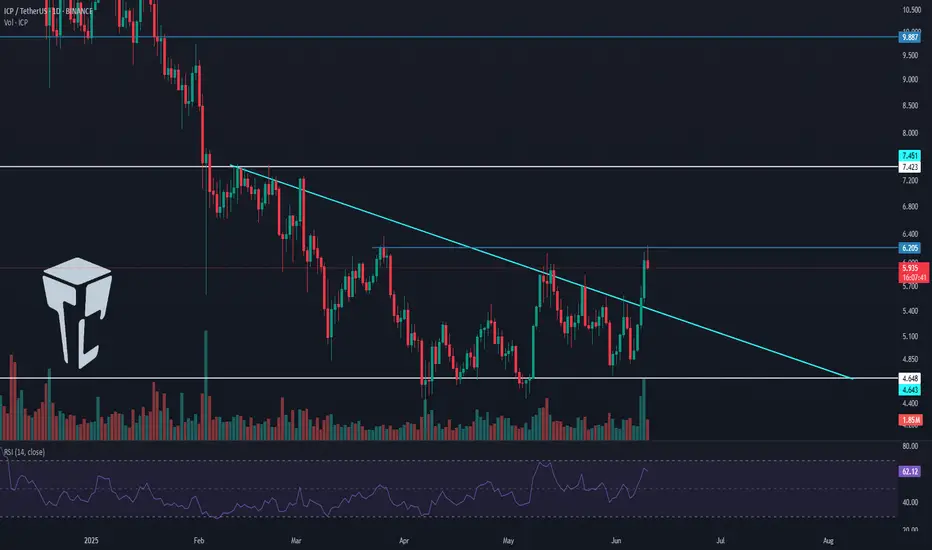
TradeCityPro | ICP Approaches Key Resistance with Rising Volume👋 Welcome to TradeCity Pro
In this analysis, I want to review the ICP coin for you. The Internet Computer project operates in the fields of artificial intelligence and DePIN.
⭐ The coin of this project, with the symbol ICP, has a market cap of 3.25 billion dollars and ranks 32nd on CoinMarketCap.
📅 Daily Timeframe
As you can see in the daily timeframe, there is a descending trendline visible on the chart, which has been tested multiple times. The price has broken above it and is now sitting just below the 6.205 resistance level.
🔍 In recent candles, the volume has increased significantly, which raises the likelihood of a breakout above 6.205.
🔔 If the 6.205 level is broken, ICP's bullish trend could begin. In that case, the price could move toward the 7.423 and 9.887 levels.
📊 Entering a position with the breakout of 6.205 is supported by volume confirmation, and we will get RSI momentum confirmation if it enters the overbought zone.
📉 For the bearish scenario to play out, the price must first get rejected from 6.205, and then we’ll look for confirmation of a trend reversal with a break below 4.468.
🛒 You can also use this same 6.205 trigger for a spot buy, but keep in mind that Bitcoin dominance is still in an uptrend, so in my opinion, it’s not yet the right time to buy altcoins.
✔️ The best trigger for buying any altcoin is to wait for confirmation of a trend reversal in Bitcoin dominance. Once that’s confirmed, you can start buying the altcoins you’ve selected.
📝 Final Thoughts
This analysis reflects our opinions and is not financial advice.
Share your thoughts in the comments, and don’t forget to share this analysis with your friends! ❤️
BTC/USDT Long PositionAfter a strong bullish impulse, price pulled back and formed a clear demand zone (OB) near the origin of the move.
The market is now retesting this zone after breaking short-term structure to the upside.
Entry:
Long from demand zone (OB) at the base of the bullish impulse.
Confluences:
✔️ Clean bullish BOS (Break of Structure)
✔️ Strong rejection wick from demand
✔️ Lower time frame liquidity grab
✔️ Favorable R:R setup
SL: Below the OB
TP: Targeting previous supply zone above
Bias: Bullish until structure shifts again
FOLLOW ME FOR MORE SIGNAL
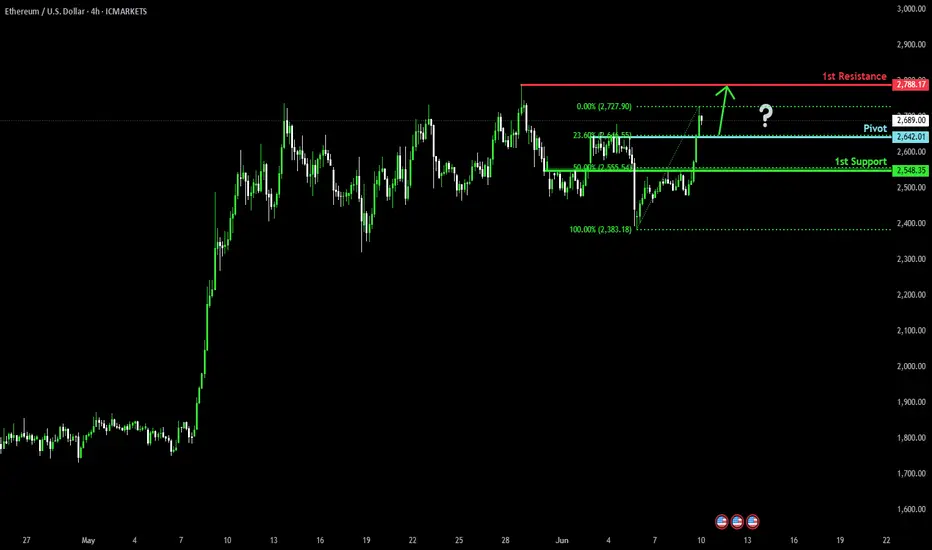
Bullish continuation?Ethereum (ETH/USD) is falling towards the pivot and could bounce to the 1st resistance.
Pivot: 2,364.01
1st Support: 2,548.35
1st Resistance: 2,788.17
Risk Warning:
Trading Forex and CFDs carries a high level of risk to your capital and you should only trade with money you can afford to lose. Trading Forex and CFDs may not be suitable for all investors, so please ensure that you fully understand the risks involved and seek independent advice if necessary.
Disclaimer:
The above opinions given constitute general market commentary, and do not constitute the opinion or advice of IC Markets or any form of personal or investment advice.
Any opinions, news, research, analyses, prices, other information, or links to third-party sites contained on this website are provided on an "as-is" basis, are intended only to be informative, is not an advice nor a recommendation, nor research, or a record of our trading prices, or an offer of, or solicitation for a transaction in any financial instrument and thus should not be treated as such. The information provided does not involve any specific investment objectives, financial situation and needs of any specific person who may receive it. Please be aware, that past performance is not a reliable indicator of future performance and/or results. Past Performance or Forward-looking scenarios based upon the reasonable beliefs of the third-party provider are not a guarantee of future performance. Actual results may differ materially from those anticipated in forward-looking or past performance statements. IC Markets makes no representation or warranty and assumes no liability as to the accuracy or completeness of the information provided, nor any loss arising from any investment based on a recommendation, forecast or any information supplied by any third-party.
Bullish momentum to extend?The Bitcoin (BTC/USD) is falling towards pivot and could bounce to the 1st resistance.
Pivot: 108,446.67
1st Support: 106,491.59
1st Resistance: 111.566.95
Risk Warning:
Trading Forex and CFDs carries a high level of risk to your capital and you should only trade with money you can afford to lose. Trading Forex and CFDs may not be suitable for all investors, so please ensure that you fully understand the risks involved and seek independent advice if necessary.
Disclaimer:
The above opinions given constitute general market commentary, and do not constitute the opinion or advice of IC Markets or any form of personal or investment advice.
Any opinions, news, research, analyses, prices, other information, or links to third-party sites contained on this website are provided on an "as-is" basis, are intended only to be informative, is not an advice nor a recommendation, nor research, or a record of our trading prices, or an offer of, or solicitation for a transaction in any financial instrument and thus should not be treated as such. The information provided does not involve any specific investment objectives, financial situation and needs of any specific person who may receive it. Please be aware, that past performance is not a reliable indicator of future performance and/or results. Past Performance or Forward-looking scenarios based upon the reasonable beliefs of the third-party provider are not a guarantee of future performance. Actual results may differ materially from those anticipated in forward-looking or past performance statements. IC Markets makes no representation or warranty and assumes no liability as to the accuracy or completeness of the information provided, nor any loss arising from any investment based on a recommendation, forecast or any information supplied by any third-party.

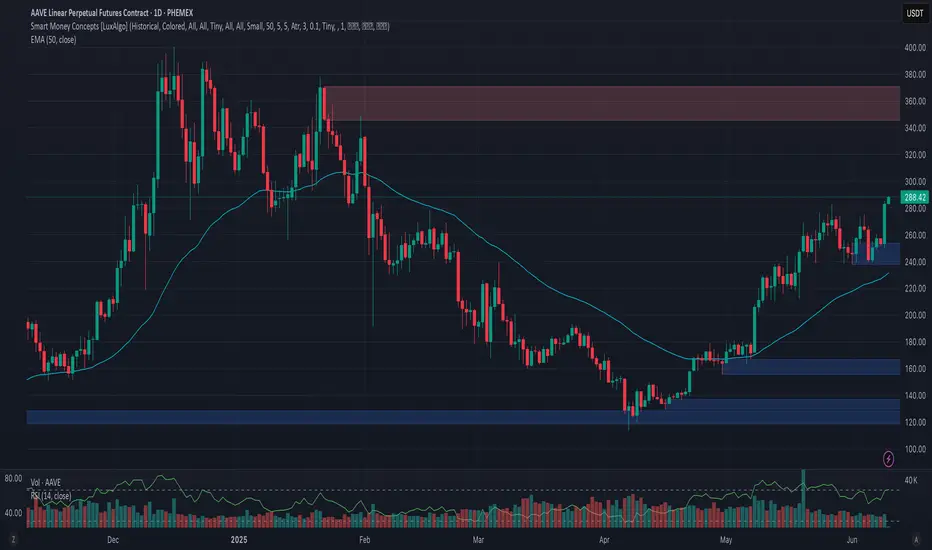
Phemex Analysis #88: Pro Tips for Trading Aave (AAVE)Aave ( PHEMEX:AAVEUSDT.P ), a leading decentralized lending protocol and one of the standout Layer 1 tokens, has attracted substantial trader interest recently by demonstrating remarkable resilience. Impressively, AAVE bounced back by approximately 100% from its recent low of $113 on April 7. Adding to this optimism, AAVE broke through a significant resistance at $282 just yesterday, potentially signaling a bullish continuation.
However, traders must proceed with caution, as this recent upward breakout was accompanied by relatively lower trading volume and a weaker Relative Strength Index (RSI) compared to the previous bullish surge seen on May 27. These factors introduce uncertainty into AAVE’s near-term trajectory, prompting the need for careful evaluation of possible scenarios over the next few days.
Possible Scenarios
1. Continued Bullish Momentum
Despite the RSI divergence observed during this latest peak, AAVE may continue its upward momentum, driven by sustained investor enthusiasm and broader market conditions. Traders should closely monitor price action around immediate resistance levels for short-term profit opportunities.
Pro Tips:
Profit Taking: Consider locking in short-term gains as AAVE approaches significant resistance areas, particularly at around $333 and subsequently at $370.
Risk Management: Set protective stop-loss orders below the recent support at $250 to limit potential losses in case market sentiment shifts suddenly.
2. Limited Rise Followed by Sharp Rejection
Another plausible scenario involves AAVE rising moderately higher but facing strong selling pressure near critical resistance levels, such as $300 and $333. A rejection at these levels could trigger a sharp corrective move, particularly if accompanied by increased selling volume.
Pro Tips:
Cautious Entries: Be cautious about initiating long positions near these resistance zones. Instead, wait for clear signals or confirmations before entering.
Short Opportunities: Experienced traders could potentially capitalize on short-selling opportunities if strong rejection signals manifest at these resistance levels.
3. Retest of Lower Support Levels
Given the relatively weak volume accompanying the recent breakout, there is a potential third scenario in which AAVE retests lower support areas. A pullback towards previously broken resistance (now support) at around $282, or even further down to around $250 & $238, might occur as the market tests buyer strength.
Pro Tips:
Observe Volume: Pay close attention to trading volumes if prices decline. Low-volume pullbacks could present good accumulation opportunities at support levels.
Accumulation Strategy: Consider cautiously accumulating positions near $250 or $238 only after clear signs of price stabilization and potential reversal appear.
Conclusion
While Aave (AAVE) showcases impressive strength and investor confidence, the current RSI divergence and volume trends suggest caution. By closely monitoring the outlined scenarios and implementing disciplined risk management strategies, traders can better navigate the uncertainty and volatility surrounding AAVE’s current market conditions.
🔥 Tips:
Break free from "buy low, sell high"! Our new Pilot Contract empowers you to profit from ANY market direction on DEX coins with up to 3x leverage. Go long, go short, go further!
Check out Phemex - Pilot Contract today!
Disclaimer: This is NOT financial or investment advice. Please conduct your own research (DYOR). Phemex is not responsible, directly or indirectly, for any damage or loss incurred or claimed to be caused by or in association with the use of or reliance on any content, goods, or services mentioned in this article.
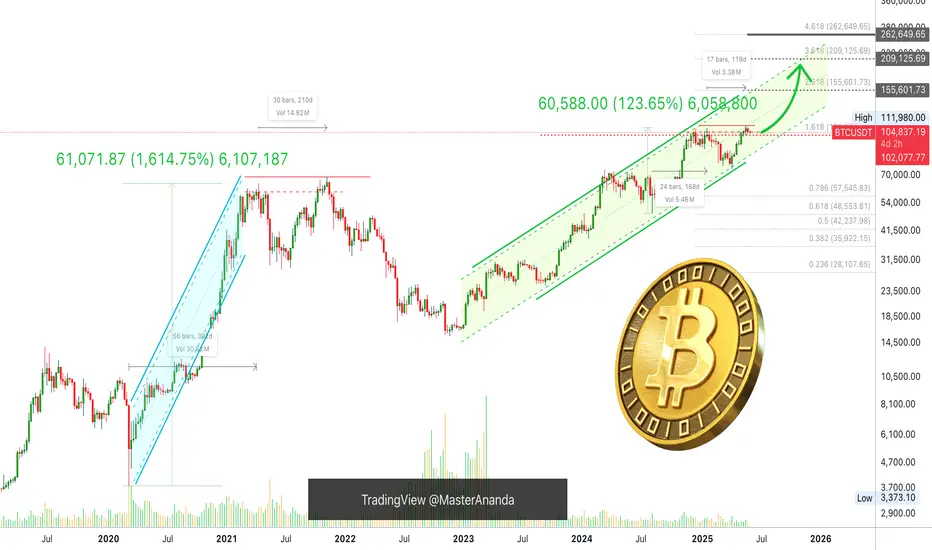
Correction? Show Me the Correction —Bitcoin Is Going Up!There is no correction and this "double-top" is nothing similar to 2021.
First, the wave that led to the April 2021 ath was a major hyper bullish wave starting March 2020. A total of 392 days of bullish action non-stop with 1,615% total growth. From a low of $3,782 to a high of $64,854, Boom!
The wave that led to the January 2025 all-time high was not a mega hyper, hyper-bullish bullish wave, instead it came after a long period of consolidation and a flash crash, which means the establishment of a long-term support. It started August 2024 and lasted 168 days total growth 124%. Completely different, so don't tell me that market conditions are the same because they aren't, we are not stupid, actually, we are very smart, right my friends? Long-term followers, readers and supporters!
The first high in 2021 happened in April the second in November, 210 days apart.
In 2025, we have a top in January and another one in May, 119 days. Very, very different.
In 2021 the altcoins rallied, everything rallied and everything was trading at new all-time highs before the bear market.
In 2025, nothing has rallied and most of the market was trading at the bottom. So we had an early peak in 2021, we get a late peak in 2025.
Since we had a long-term double top in 2021, we get a blow-off top in 2025, late 2025. Do you understand?
I am the Master of the charts!
Bitcoin is not done; it isn't over. We have an entire bullish wave before the bull market is over. This bullish wave is the fifth wave which is the speculative wave, in this wave anything goes. The market will go crazy. There will be euphoria, passion, craziness, money, growth!
The altcoins will be hitting new all-time highs and everybody will go crazy. NFTs, DeFi, DePin, RWA, Memes, POW, Gaming, AI, new, big, small and old, all welcomed, everything will grow. When the pixelated rocks start selling for millions of dollars, that's when the bull market ends.
When people start saying "Bitcoin will go to $1,000,000 in this cycle." That's when the top is in.
When Bitcoin starts trading at $219,999 and starts to slow down and Ark Invest comes up and says, "Bitcoin is going to $5,000,000 next"; when Michael Saylor starts saying, "I will be buying the top forever..." Get ready because that's the end. It isn't happening, now people are still talking about corrections and doubt, that's not the end of a bull market, that's the transition period between an advance a correction and the next leg up.
Just wait and watch. Just watch my friend... Just watch!
I assure you, Bitcoin is going up!
Namaste.
Kadena, Is 14,471% Truly Possible In 2025? Read The Chart!I love Kadena's previous bull-market. From July 2021 through November 2021, it was pure joy, straight up; huge profits of course.
It lasted 105 days... Total growth almost 9,000% and then the market went bearish, and then the market went sideways, for years... I think this time we will experience something awesome like the last time. It only happens every four years do you agree?
Cryptocurrency goes wild every four years, it is what it is.
So 2021 leads to 2025. It is already mid-2025 and we are ready... So ready, yes ready, truly ready... Yes!
We are ready and the price, and the chart and the markets, the candles, the signals it all looks great. Ready for new growth and new high-profits Cryptocurrency millionaire, let's trade!
KDAUSDT. The August 2023 support was also the July 2024 support, August 2024, February 2025 and now June 2025 as a higher low. The April 2025 low pierced through this level and that's the reason why the chart now looks great, because KDAUSDT is trading back-above it, the August 2023 low. Being above this level means ultra-bullish.
Anyway, we have huge potential for growth on this pair. Kadena has an easy target of 1,295%, that being $6.99. A strong target for 3,421% at $47.65.
There is an ATH at $45 for 8,969% and another one at $73 for 14,471%.
Thank you for reading.
Namaste.

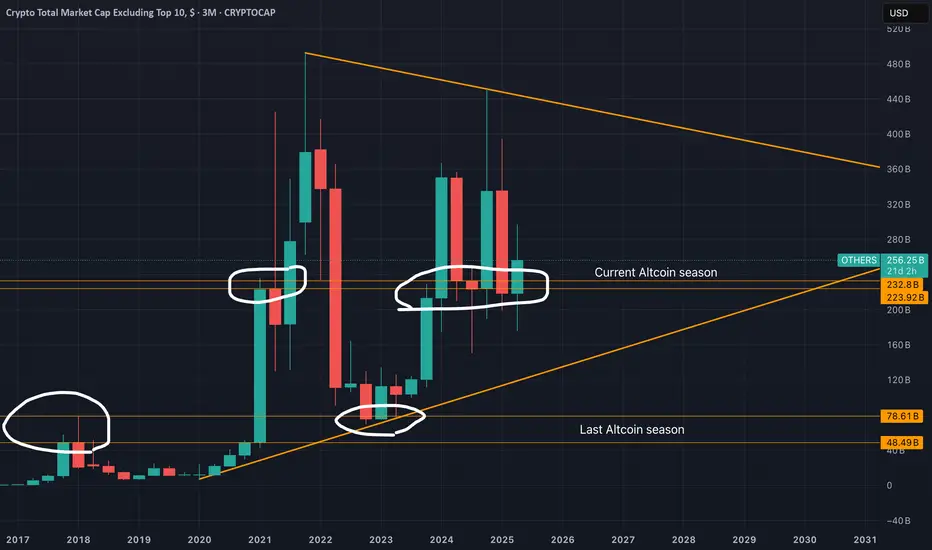
Altcoin Cycle - Cycle bottoms spottedAs I demonstrated on this picture. I believe I identified the cycle bottoms and marking a new cycle low. With the BITSTAMP:BTCUSD price rising now and CRYPTOCAP:BTC.D about to meet hard resistance levels, I believe this will increase the propability of a start of the altcoin cycle. Also known as the Altcoin season.
CRYPTOCAP:OTHERS
CRYPTOCAP:OTHERS.D
COINBASE:ETHUSD
BINANCE:SOLUSD
INDEX:BTCUSD
BINANCE:BTCUSD
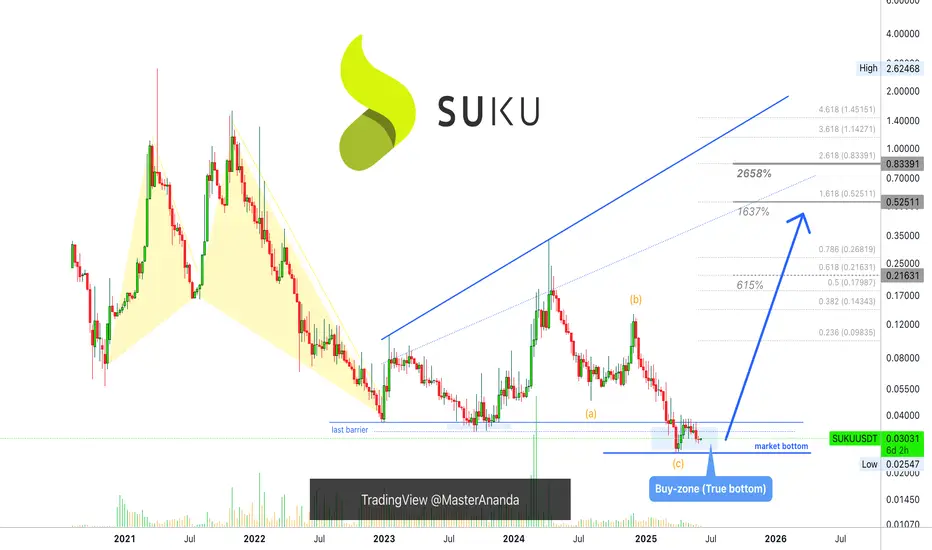
Suku, High Targets Only (615% - 2,658% Profits Potential)Between late 2023 through mid-2024, SUKUUSDT produced a 900%+ bullish wave. The action in late 2024 was a non-event.
Here we can clearly see how a pair that grew strongly in 2023 performed poorly in 2024. Those that performed poorly in 2023 did great in late 2024. But still, this isn't bull market type of action.
SUKU can grow more than 900% in a transition year, this is awesome. How much can it grow in a bull market year when everything goes wild? Great question. Growth potential is huge.
I am showing some targets here, strong targets but the possibilities exist for this pair to grow even more than what is shown on the chart. This is a small cap. and small cap. projects can do awesome when the bull market is in full force. Right now, we are not there yet.
SUKUUSDT is trading at the bottom, true bottom; the lowest prices ever in its entire history. This is simply great. You can't go wrong buying when prices are low. No planning needed, just buy and hold.
Risk becomes very limited, it can be counted in time, nothing more. While the reward potential can be extraordinary, off the chart.
A spot trader can simply buy and accumulate. If you are reading this now, you have great timing. The only time better than now was in early April, but the retrace pushed prices back near the same level, so everything is good.
Three months from now you will be dealing with a completely different market, you will be surprised to see how fast things change. Now everything is low and depressed, in a several months, you won't even be able to imagine that such a situation as now is even possible. Everybody who missed the train will be thinking, "why didn't I buy back then?"
Take action now.
Thanks a lot for your continued support.
Namaste.
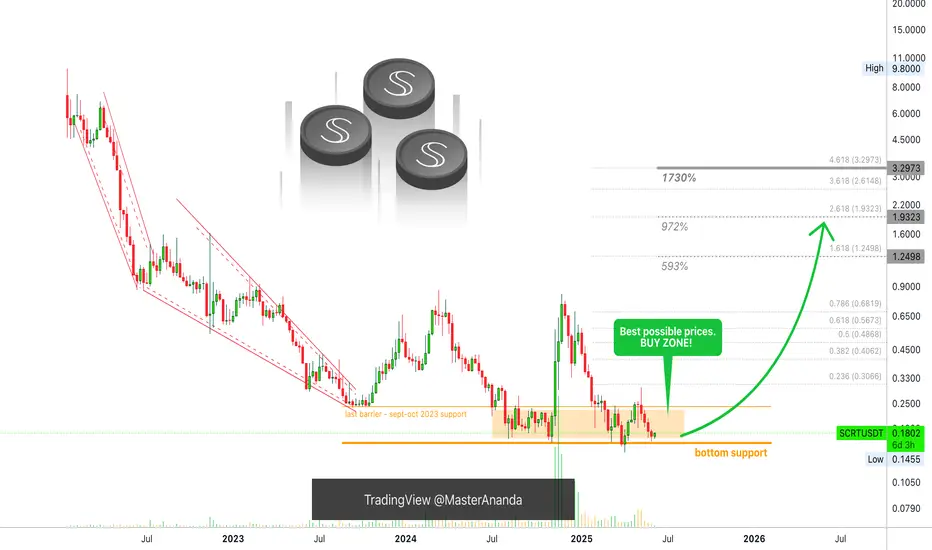
Secret Network Enters Buy Zone! Best Possible Prices (1,730% PP)Some people will look at this chart and runaway. They can see a brutal bear-market followed by weak bullish action. I understand, but, when I look at this chart I see an opportunity, the best possible prices to buy before the 2025 bull market wave.
Good afternoon my fellow Cryptocurrency trader, I hope you are having a wonderful day.
Secret Network grew 400% in late 2024, in a single month. Between November and December. How much growth would be possible in 6 months, or an entire year? Good thinking.
The bullish wave from 2024 was corrected by more than 100%. All gains removed and then some more. Now, the action is back above long-term support.
The same price range that produced the 2024 bullish wave is active again. And, certainly, this same zone will produce a new bullish wave. The difference of course is the size, the last wave was just a minor jump, a price bump, what we are about to experience is a bull market cycle. A completely different scenario.
The best time to buy is when prices are low. Prices are low now, the lowest possible and Secret Network just produced a shy higher low.
After five red weeks and this higher low, you can say this pair is ready to grow, long-term growth. Feel free to follow for more.
Namaste.