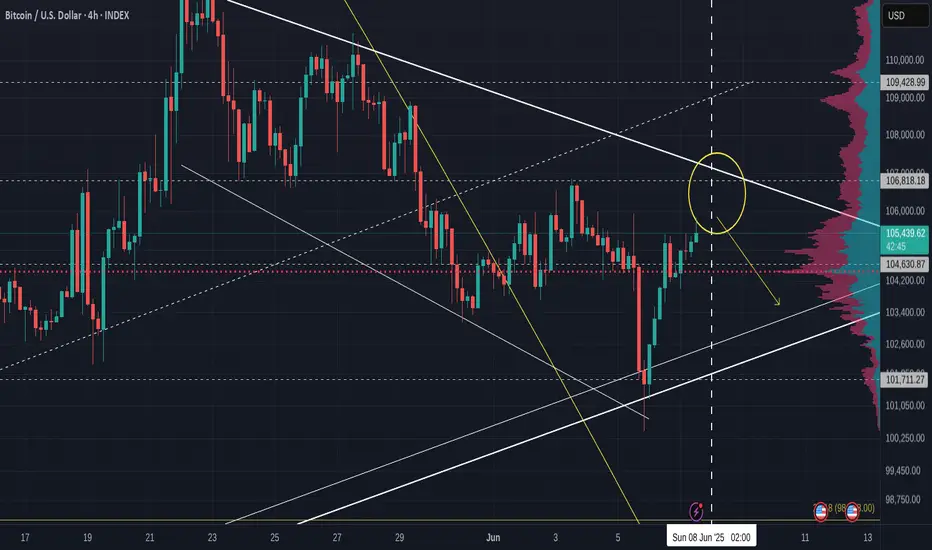
Bitcoi 4 hour - Volatile Zone near bu = CAUTION
PA nearly at that Circle I posted
MACD near the Neutral line
Possible rejection from Both
Lets see how this plays out. I do ecpect PA to follow that arrow BUT Bulls could step in and take PA Above the upper trendline and then wait for the inflation data in the USA on the 11th
Watch BTC Dominance for Clues about how this all effects ALT coins
Cryptomarket
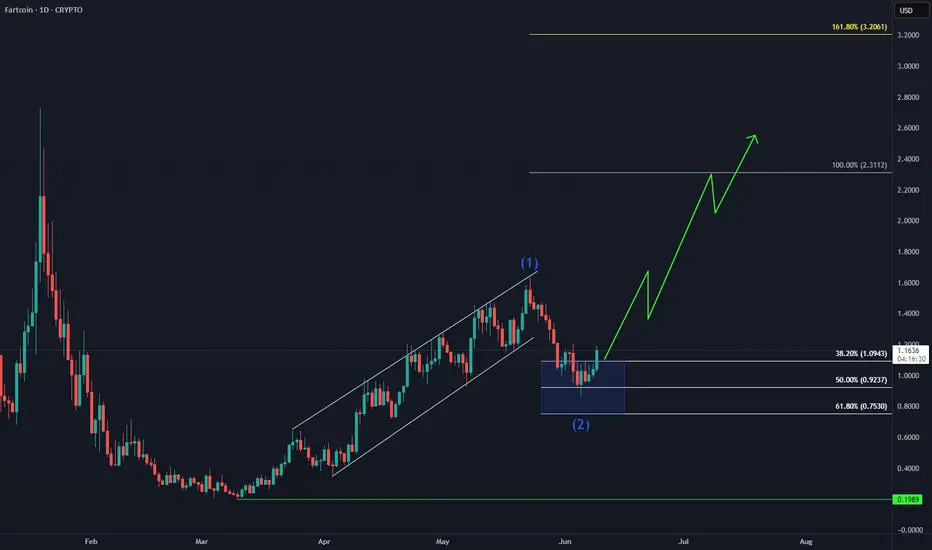
FARTCOIN is primed for a 3X move!🚀 CRYPTO:FARTCOINUSD April rally cooled off, buyers stepped in at the $1 - $0.75 extreme zone, and now wave (3) is gearing up for liftoff.
🎯Targeting $2.3 - $3.2—momentum is building fast!
Are you strapped in for the ride, or still watching from the sidelines?
KAITO is setting up for its next 2x move!📈 BINANCE:KAITOUSDT Found strong buying interest in the #BlueBox zone and now it's gearing up for a potential 100% rally.
🚀 Targeting $3.3 - $4.3 as momentum builds.
Did you catch the dip, or are you waiting for confirmation?

Altcoins in Focus: Aptos, KAIA, and Ravencoin (RVN)Amid Bitcoin’s rapid growth and renewed interest in Ethereum, investors are increasingly turning their attention to altcoins—alternative cryptocurrencies showing strong potential for sharp gains. As of early June 2025, Aptos (APT), KAIA, and Ravencoin (RVN) stand out for their price surges and growing interest from major exchanges and analysts.
Aptos, a next-generation blockchain platform developed by former Meta (ex-Diem) engineers, has secured its place among the top 50 by market cap. In recent days, the token broke through a resistance level at $9.20, signaling a possible continuation of the uptrend. Its appeal lies in its scalability and its unique MoveVM architecture, which makes it attractive for developers in DeFi and NFT applications.
KAIA, a new token in the AI and metaverse ecosystem, gained over 15% this week following a Binance listing and integration with several major Web3 projects. Investors see KAIA as a potential “new Render,” focusing on neural computation and digital identity infrastructure.
Ravencoin (RVN), a long-time presence in the crypto space, is regaining popularity. With its focus on asset tokenization and copyright protection on the blockchain, RVN surged 14% after announcing partnerships with several independent music platforms.
The rise of these altcoins demonstrates that there is room in the crypto world not just for the giants, but also for innovative, purpose-driven projects capable of capturing market and user interest.

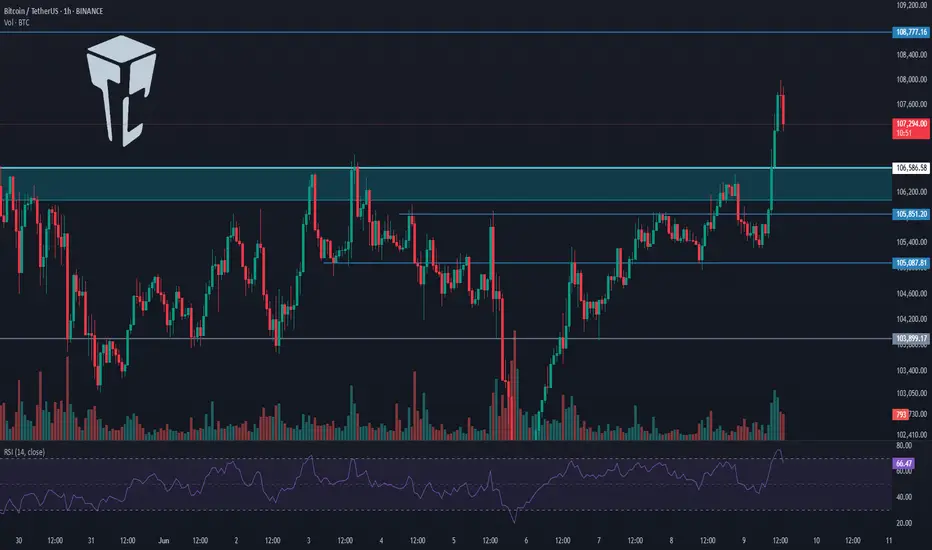
TradeCityPro | Bitcoin Daily Analysis #112👋 Welcome to TradeCity Pro
Let’s dive into the analysis of Bitcoin and key crypto indexes. As usual, in this analysis I’ll review the futures triggers for the New York session.
⏳ 1-Hour Timeframe
Yesterday, Bitcoin finally broke through the resistance zone it had formed. As you can see, it pushed through this level with strong buying volume and is now moving toward 108777.
🔍 If you entered a position using yesterday’s triggers, I’d be glad to hear about it in the comments. Your feedback gives me great energy.
⭐ Today, I cannot provide a specific trigger because the market has already made its move. If you do not have an open position, it is better to wait for a new market structure and then identify a fresh trigger.
💥 At the moment, I expect Bitcoin’s upward movement to continue toward 108777. Market volume is strongly supporting the trend and is aligned with price action. RSI is also in the overbought zone, indicating strong buyer presence. If RSI stays above 70, the sharp upward movement is likely to continue.
📊 If a market correction occurs, the price could pull back to the zone I marked. In future analyses, I will review triggers for both trend continuation and possible reversals.
👑 BTC.D Analysis
Bitcoin dominance formed a higher low above 6449 and has now broken the 6467 resistance, signaling the beginning of a new bullish leg.
⚡️ If this upward move continues, Bitcoin dominance may climb further. However, if a pullback to 6467 happens, altcoins could see a strong upward move as well.
📅 Total2 Analysis
Looking at Total2, this index was supported at 114 yesterday and is now moving toward 117.
📈 If Bitcoin dominance starts to drop, Total2 will likely break above 117 and begin a main bullish trend.
📅 USDT.D Analysis
Now for Tether dominance. After forming a lower high below 479, it broke below the 472 support and is now heading toward 464.
✅ In my view, this movement toward 464 is likely to continue, and as that happens, the overall crypto market is expected to keep moving upward.
❌ Disclaimer ❌
Trading futures is highly risky and dangerous. If you're not an expert, these triggers may not be suitable for you. You should first learn risk and capital management. You can also use the educational content from this channel.
Finally, these triggers reflect my personal opinions on price action, and the market may move completely against this analysis. So, do your own research before opening any position.
Bitcoin B-Wave Trap? Major C-Wave Down Correction Incoming!Bitcoin’s recent bounce has all the signs of a classic B-wave in an ABC corrective structure. After the impulsive A-wave down from the highs, this current rally appears more like a corrective relief move rather than the start of a new bullish impulse. Volume remains weak and the structure looks choppy — not the kind of strength you’d expect from a sustainable uptrend.
I believe we are now completing the B-wave, luring in late bulls before the real drop — the C-wave — begins. This next leg down could be sharp and painful, targeting key support zones and possibly wiping out the complacency that’s built up in the market.
🧠 Watch for signs of exhaustion in this rally.
📉 Potential C-wave targets: 98k 97k
⏳ Timing and structure suggest we’re close to the turning point.
Stay cautious. This could be the calm before the real storm.
---
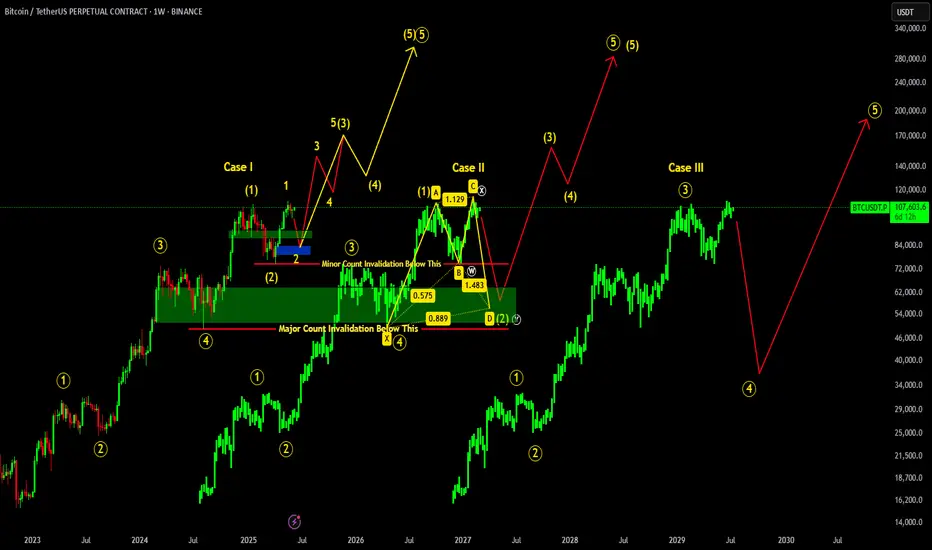
BITCOIN ROAD TO 300K !!! ELLIOTT WAVE CASE STUDYThere are three possible cases for Bitcoin which we can now consider according to Elliot wave count on big picture:
Case I: According to this count if we hold above 74.5k , recent low, we may see major shift in BTC. Retracement Up to 92-79k is good which will form inverse head & shoulders, potentially breaking ATH up to 170K, if things goes well & 74.5K region remains on hold.
Case II: If in case 74.5K region breaks, then it will invalidate minor count causing BTC to retrace more up to 64-52K major reversal zone region. If such thing happens, bullish shark pattern will be formed causing major reversal from that region BUT 49K region should remained hold!!!
Case III: Worst case scenario if 49K region breaks, then it will cause major count invalidation dropping BTC further up to 45-33K region.
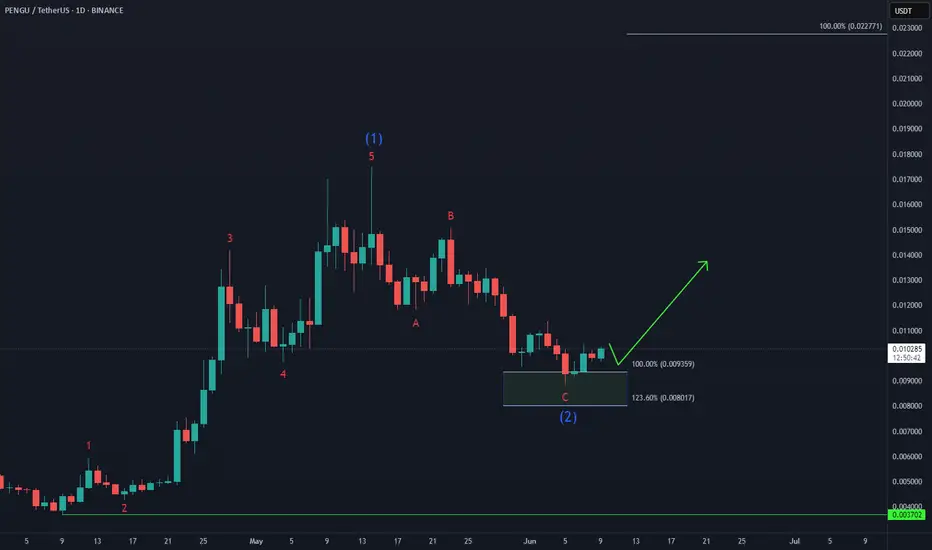
Pudgy Penguins PENGU Gearing Up for a +100% Move! 🐧 BINANCE:PENGUUSDT has completed its 5-wave advance from the April low (wave 1) and corrected with a 3-wave Zigzag structure in wave (2), reaching the buying area at equal legs $0.009 - $0.008.
🚀 Now, it's setting up for wave (3) higher, with an initial target at $0.022.
🌊 Are you positioned to catch the next wave higher?
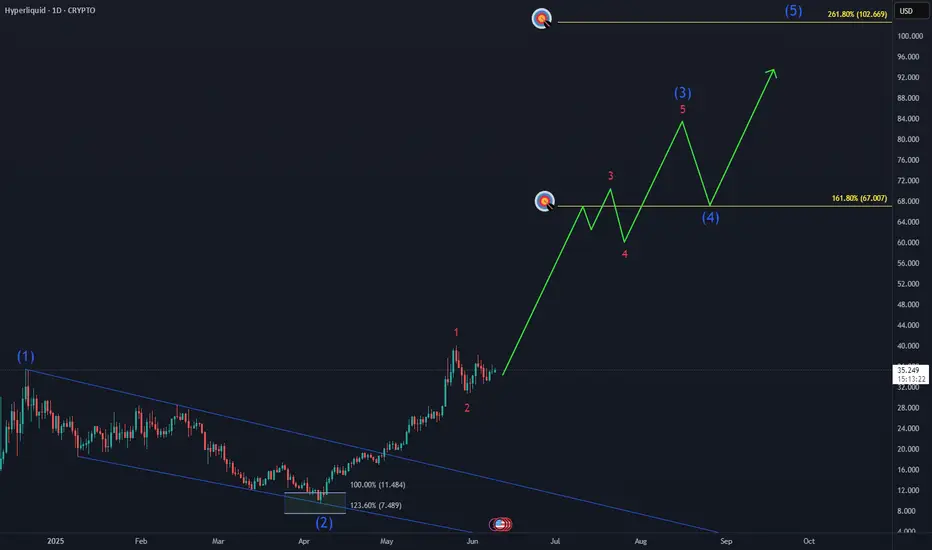
Exploring Bullish Targets for Hyperliquid HYPE🚀 BINANCEUS:HYPEUSD has surged into a new ATH and the most bullish scenario suggests a nest structure forming.
🎯 This setup could lead to an extension beyond the 1.618 Fib level at $66, opening the door for +$100 range in the coming months.
Are you positioned for this breakout? What’s your personal target for this cycle?
TradeCityPro | ADA: Holding Key Support Inside Descending Channe 👋 Welcome to TradeCity Pro!
In this analysis, I want to review the ADA coin for you, one of the most popular cryptocurrencies, currently ranked 10th on CoinMarketCap with a market cap of 23 billion dollars.
📅 Daily Timeframe
As you can see in the daily timeframe, the price is fluctuating between two key support and resistance zones. Additionally, there's a descending channel in play, and the price has recently been rejected from the top of this channel and moved down to the support zone.
✨ The 0.61 zone is a very strong area, and the price has reacted to it multiple times. It was broken once, but as the price reached the bottom of the channel, it was supported again and moved back above the level — indicating a possible fakeout.
✔️ If this zone is broken again, the likelihood of another drop toward the 0.5579 level or the bottom of the box increases. So I think it’s worth considering a short position on lower timeframes if this zone breaks.
💥 RSI entering the oversold area would be a strong momentum confirmation trigger for this trade.
📊 Currently, ADA's volume is quite low, and with this low volume, it’s not suitable for either long or short positions. I suggest waiting until significant volume enters ADA before taking a position.
🛒 For spot buying or long-term long positions, the first trigger is the price's reaction to this support zone. If a confirmation candle forms here, we can consider entering. However, in my view, this trigger is risky, and I personally prefer to wait for more reliable confirmations.
📈 A more reliable trigger would be a breakout of the descending channel. If either the channel itself or the 0.8414 trigger is broken, we can enter a position. And if you want the strongest confirmation and wish to enter with the main trend, you should wait for the 1.1325 level to be broken.
❌ Disclaimer ❌
Trading futures is highly risky and dangerous. If you're not an expert, these triggers may not be suitable for you. You should first learn risk and capital management. You can also use the educational content from this channel.
Finally, these triggers reflect my personal opinions on price action, and the market may move completely against this analysis. So, do your own research before opening any position.

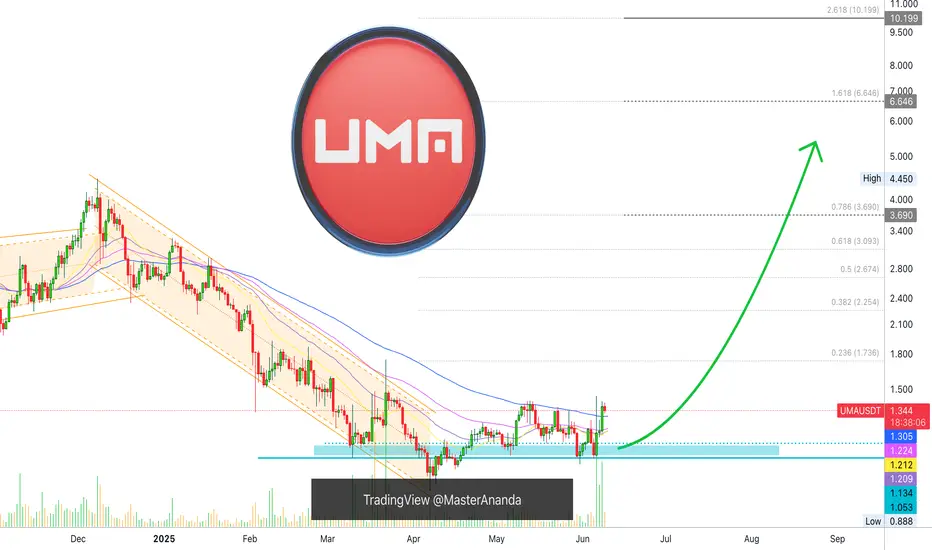
Uma Update: How To Use Moving Averages For Trading SuccessThe moving averages can be an excellent tool for trading, you can use them to confirm where the market is headed next. I no longer use them as often as before but you can use them all the time to know which pair is weak and which one is strong.
When the action is happening daily above EMA55/EMA89, the bullish bias is confirmed mid-term. When the action is happening daily above MA200, long-term growth is possible. And it keeps on going with the shorter and longer EMAs.
I just mentioned EMA89 looking at Compound (COMPUSDT), the same signal is present here.
UMAUSDT produced three days green with really high volume. It was removing EMA89 as resistance, now it trades above this level which signals that the mid-term bullish bias is fully confirmed.
Without the EMAs plotted on the chart, we have this:
The last three days look like nothing special, just a small advance. But, when the moving averages are on, you know the bulls have taken control and it makes it easy to go LONG.
See the chart:
Now you know, we are set for long-term growth. It is not me saying it, this is the message coming from the chart. I am translating the chart. The chart is saying up.
Everything I share is data supported, it is all based on the actual market, that is why we produce such a high success rate. 100% data supported analysis. Simply the best. Don't you agree?
Thank you for reading.
Namaste.
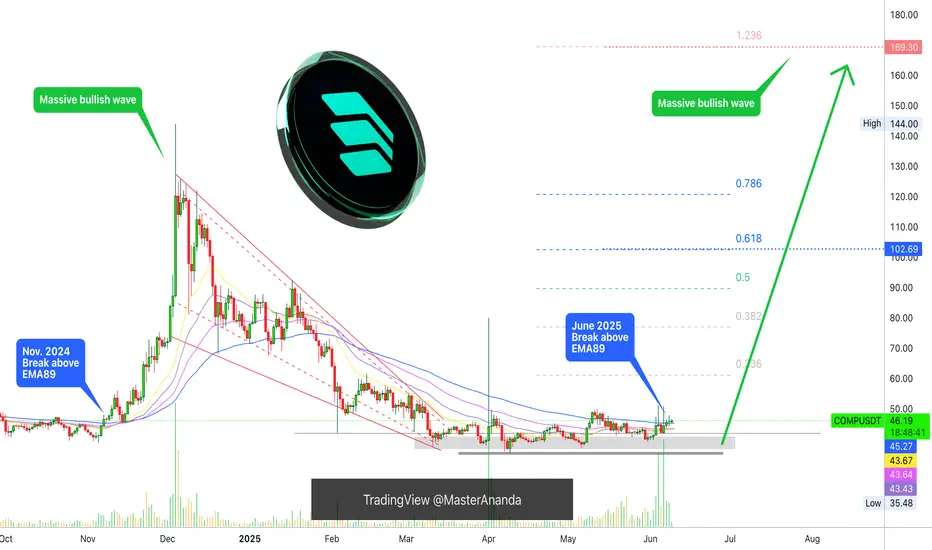
Compound Gets Even Better —Bull Market ConfirmedThe trading pair COMPUSDT seems to be struggling short-term, daily timeframe, but what is actually happening? Why all the daily candles continue to close so small even while volume is high? Let me explain.
Resistance was present on the form of EMAs. Recently, COMPUSDT managed to break above EMA21 and EMA34, then EMA55. But one major level still needed to be taken out, EMA89. This is the blue line on the chart.
Two days ago COMPUSDT moved and close above this level. Yesterday, there was a Doji but no retrace. And today the action is green above $45.27 (EMA89). This is bullish confirmed.
See what happened back in November 2024, it is all the same. When COMPUSDT managed to close daily above EMA89, we have a massive bullish wave. It will be the same but different. The difference is that this time around the bullish wave will be many times bigger, prices will go much more higher.
Thank you for reading.
Namaste.
0X New Bullish Impulse, New All-Time High Late 2025I see bullish market conditions with a long-term growing base. Each time there is a correction, or bear market, the end price of the move is higher compared to the previous cycle.
The all-time high remains in 2021. This never breaks. There has been some bullish waves but not enough to break the 2021 ath. This time it will be different.
In 2025 we get a new all-time high. Or in early 2026 we get a new all-time high. No, for this one, in 2025.
So late 2025 ZRXUSDT will produce a new all-time high and this will be the highest price ever and it will be something truly awesome.
Right now the chart is great for buyers. If you are a bear (down-red) the chart is no good. The chart isn't good for a bear because it isn't going any lower. In fact, if you were to place a SHORT here, selling with a loan, then you would end up losing everything as prices move up. You would be certain to a receive a nice liquidation, all money gone.
On the other hand, buy spot hold strong or go LONG, and you are in a great place. While the downside is limited at best, there is no limit to how high prices can go in this upcoming bullish wave.
We are seeing the end of the retrace, the higher low after the initial bullish breakout after the end of a major correction.
Here the correction started in March 2024. The first low happened in August 2024 and the lower high December 2024. At the bottom 7-April 2025 the correction ends. The small bounce is the start of the next bullish wave.
So, March 2024 = 0
August 2024 = A
December 2024 = B
April 2025 = C
That's ABC. A classic correction. After a correction we get a bullish impulse and this simply means new heights for this pair. This new high will come in a set of 3 bullish waves with two bearish waves.
1 = bullish up.
2 = bearish down.
3 = bullish up.
4 = bearish down.
5 = bullish up.
1,2,3,4,5. That's the bullish impulse.
Namaste.

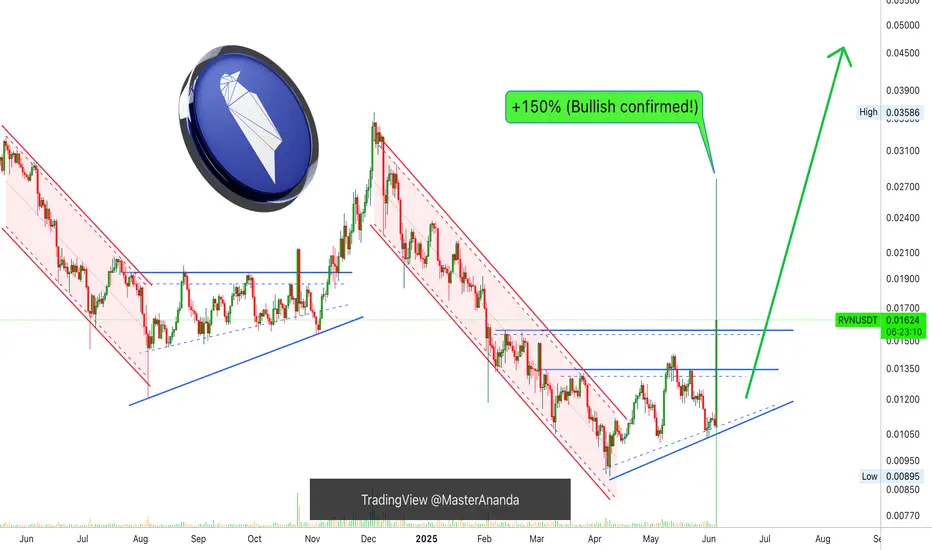
Altcoins Market Bull Market Confirmed, RavencoinI have something very, very interesting here, and it has two parts.
1) Ravencoin is breaking out with three digits green, +150% within today's candle.
2) This is very interesting because this is the exact same chart as all the other major and minor altcoins —What one does, the rest follows. It confirms the altcoins market bull market is here.
First, let me ask you something; Would an altcoin breakup by 150% in a single day in a correction or bear market? This only happens preceding a major bullish phase.
Ravencoin hit bottom early April, the low first happened on the 7th followed by double-bottom on the 9th. This led to a small recovery and now a massive bullish breakout.
All the altcoins we've been seeing, most of them, bottomed early April as well. All of these produced some growth between April and May. All of these went into a retrace late May to early June, and all those will start to break up soon.
The altcoins market bull market is already confirmed, this is proof.
Prepare for massive growth.
Thanks a lot for your continued support.
Namaste.
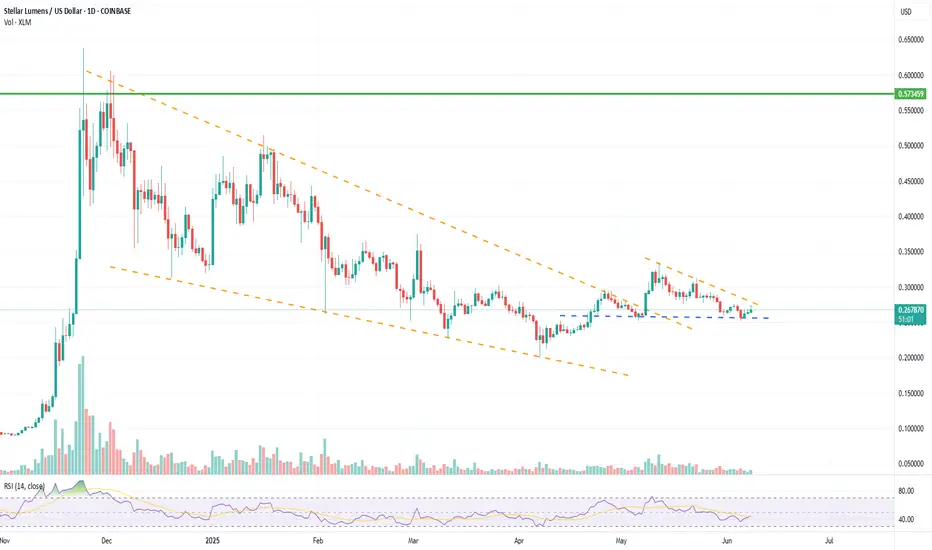
XLM Break out ??Potential break out of falling wedge for XLM
Larger Volume on break a good sign, has retested breakout level.
needs to start moving higher and break that second consolidation zone or risks falling back into old patten.
what do you think? leave a comment.

XLM break out ??Potential break out of falling wedge for XLM
Larger Volume on break a good sign, has retested breakout level.
needs to start moving higher and break that second consolidation zone or risks falling back into old patten.
what do you think? leave a comment.
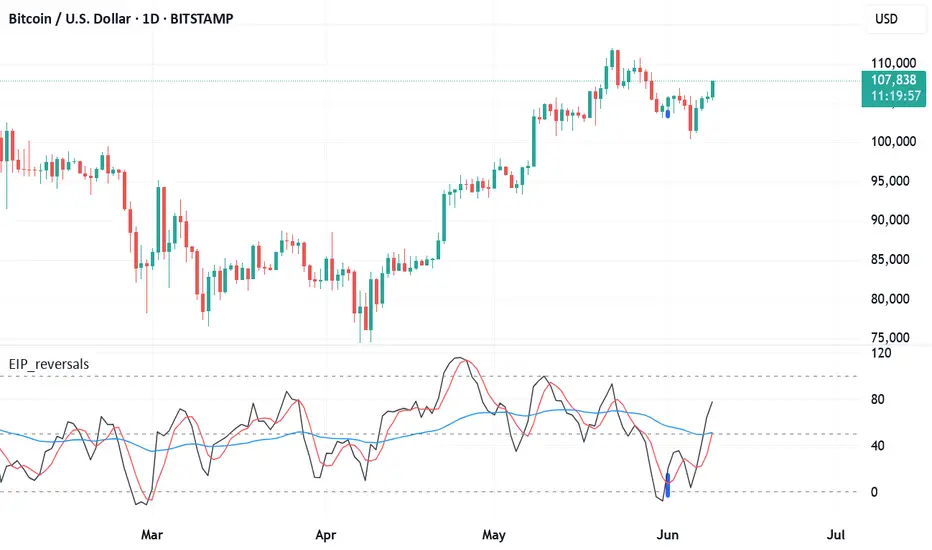
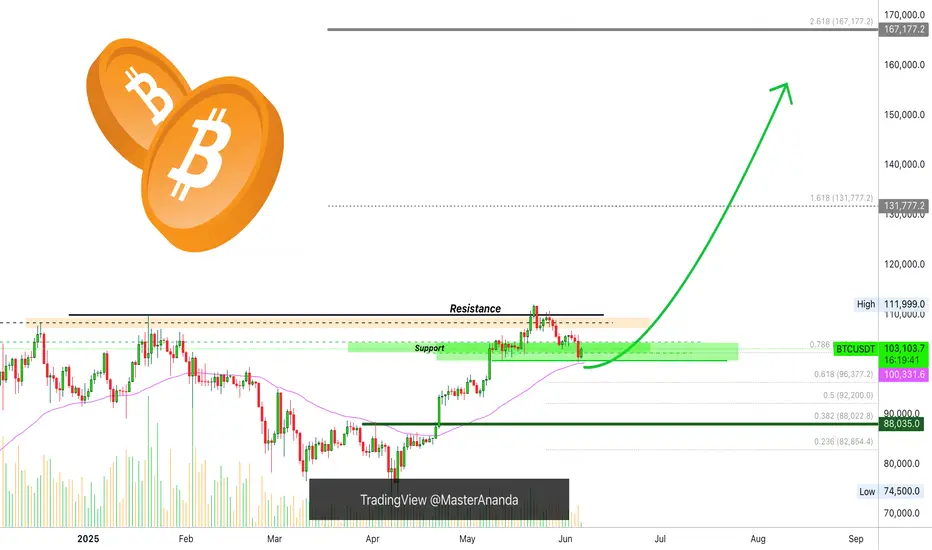
Bitcoin, Fast & Easy. $100,000 Support Holds +AltcoinsThe main support is not $100,000 but $102,000, so we make this a range. Yesterday, for the first time this range was tested and it holds easily... We are strongly bullish above $102,000 and Bitcoin is already trading above 103K.
This is really good news but we are not fully in the green yet. Bitcoin can continue sideways, consolidation, and only after closing above $106,000 we are looking for higher prices. Once $110,000 gets conquered, we can start talking about new all-time highs and sustained bullish growth. Meanwhile, the altcoins grow.
So we are not there yet but this is the best ever. For Cryptocurrency to thrive we need a strong Bitcoin and Bitcoin right now is very strong. Are you trading any altcoin? If you are, feel free to accumulate, load-up, buy and hold.
As for Bitcoin, here is a very easy trading approach:
While above $100,000, ALL-IN bullish confirmed.
If it goes below $100,000, stay out and wait to see what the market does. As soon as there is a support level created, we go LONG. If it goes below $100,000 just to recover the next day, we are again ALL-IN as soon as Bitcoin starts trading above 100K.
This process can be repeated many times but once Bitcoin takes off, buying below $110,000 is a major win because soon Bitcoin will be trading above $150,000. We have targets around $180,000 and even beyond $200,000 is possible this same year. Never forget the bigger picture.
The bigger picture is bullish for Bitcoin and the altcoins, the short-term can create confusion because the chart, market conditions, can change within hours.
But there can be a drop, a retrace or a market flush, but knowing that Bitcoin will be trading above $150,000 soon turns such an event into a non-event, it makes it into a simple hold.
The action on the side of the altcoins confirms that Bitcoin will continue to grow. Short, mid and long-term.
There is no retrace, there is no correction, only a small consolidation phase in anticipation of the next bullish wave. You already know this. If you didn't, now you know.
In 2025, Bitcoin will continue to grow. Just as it grew in 2023 and 2024.
We are entering bull market season. Bullish momentum will only start to gain force.
Namaste.
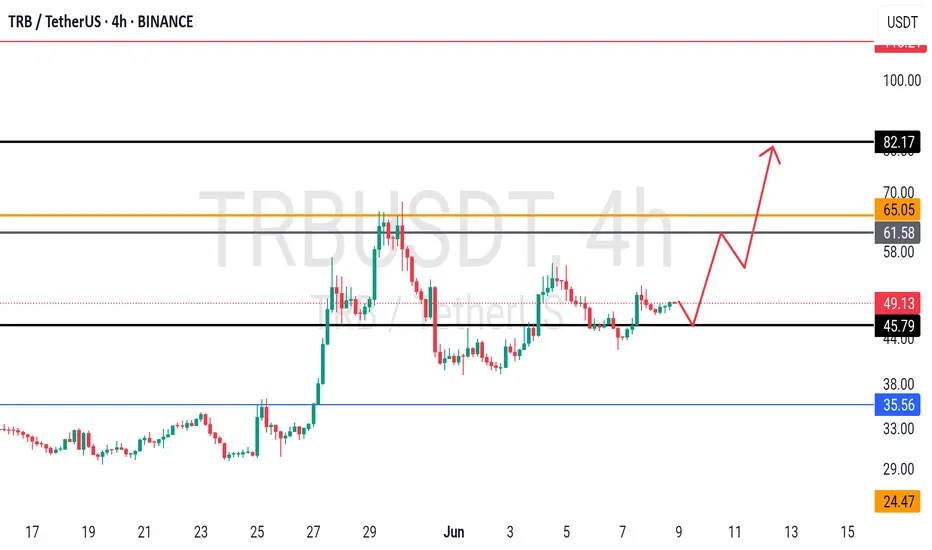
TRBUSDT - Bottom out here? What's next??#TRBUSDT ... market just near to his bottom and looking bottom out here
Keep close and if market holds his current mentioned area than we can expect a bounce from here.
Good luck
Trade wisely
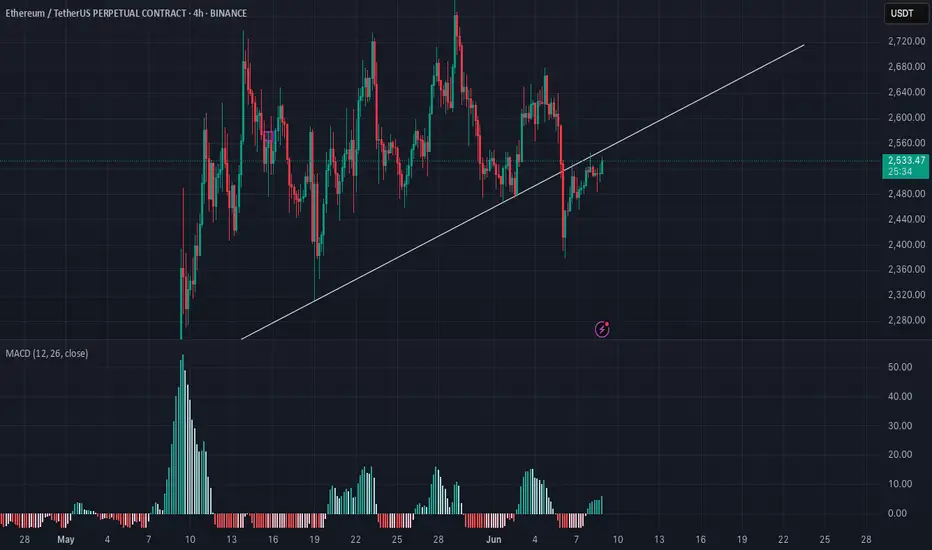
ETH is testing its resistance ETH may reject from its resistance line as ETH is showing weakness at around $2550 mark level, lets see and if it does it may go down to $2200 level. #ETH #BTC #crypto
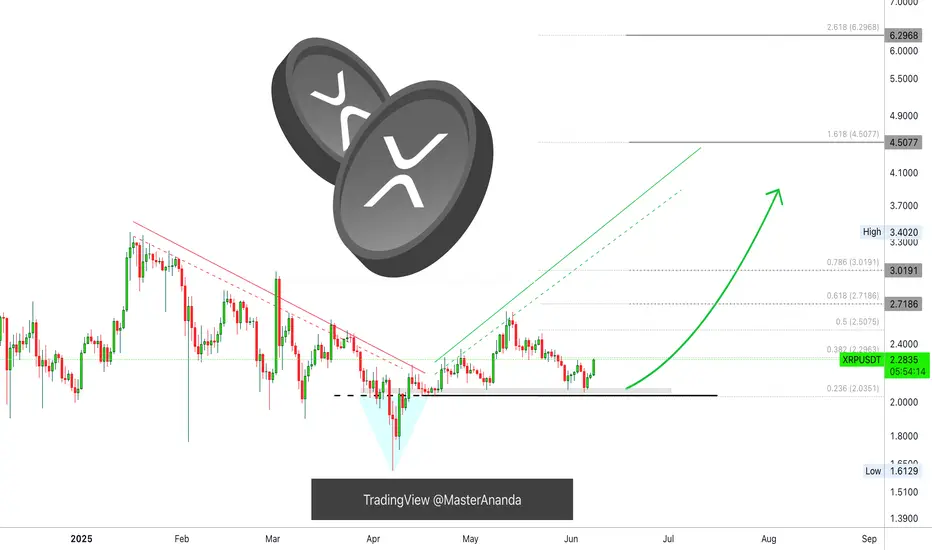
XRP Moves Forward—How To Maximize Profits, Aim At $4.5 Or Higher5-June gave us the confirmation for a higher low.
8-June is telling us the continuation of the bullish move is true. XRP moves forward.
How are you doing my friend in this beautiful Sunday?
I hope you are doing great.
The bottom happened 7-April, the peak happened 12-May.
24 Days for the retrace to be completed, between 12-May and 5-June.
It's been 27 days since we last saw some bullish action, almost an entire month.
I fully understand how people become bored, it is just too long, the market never moves straight up. But this can be taken in different ways. If the market were to move straight up, there is no chance to adapt, to recover, to plan and to learn. Now that the market made a full pause, we are ready for a new wave of growth and this time we can maximize profits on the way up.
How to maximize profits?
Hold strong. Hold long. Wait for higher targets.
Let's revisit the targets and how to approach them.
The "selling for profits" strategy where we sell a portion at each target is for blind traders. This method is used when we are trading with a high level of uncertainty about the next wave top. This method we can ignore here because we know where prices are headed next. To maximize profits with XRPUSDT, ignore $2.71, ignore $3.02, ignore the new ATH and aim straight at $4.51 with your full position with high lev. That's how to maximize profits.
Take some profits at this level only to buy more when the next retrace shows up. We are going higher, so you can keep on holding and wait for $6 or more. While we ignore the lower targets, when prices are higher we do not ignore them anymore. It doesn't matter how far up it goes, but we have to be careful after reaching $4.4.
Aim high because we are going high. The market is preparing for several months of sustained growth. Some of the older projects, mid-size and small size based on market cap., are showing signals of an entire year of bullish action ahead. It is not yet confirmed, but if it happens, this will be the biggest and best bull market in the altcoins history. A very big one.
For example, XRP peaks early because it started early and we get maximum profits from this pair. When the correction starts for XRP, the rest of the market continues growing. We can move capital from this pair to smaller pairs. And there will be thousands of those.
While XRP can grow 50% in a matter of weeks or months, a small pair can grow 150% in a single day. We have to take advantage of the big and the small ones. Diversification.
If you enjoy the content, consider follow.
Thanks for the continued support.
I'll see you at the top.
Namaste.
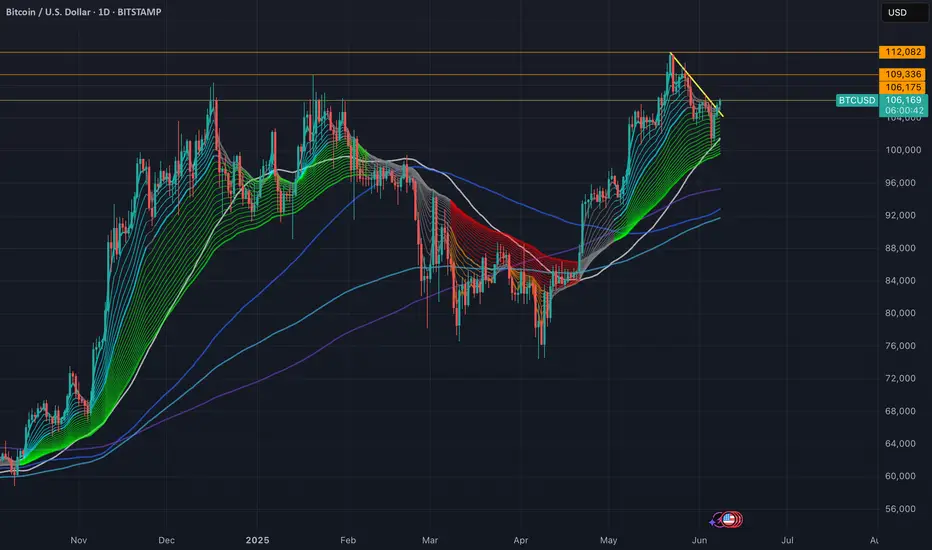
Targets for Bitcoin Bullish outlook for BTC in the coming days IF we close above 106,1 k.
The 3 day candles indicates we could have a "Three White Soldier Pattern" coming up for BTC. It would be a pattern showing a trend reversal and potenially trigger the next trend to retest the old ATH. Although, I would like to see increase in volume to confirm this during the rest of the day to be more certain on this pattern.
Expecting NASDAQ:MSTR to get really bullish aswell if this occur.
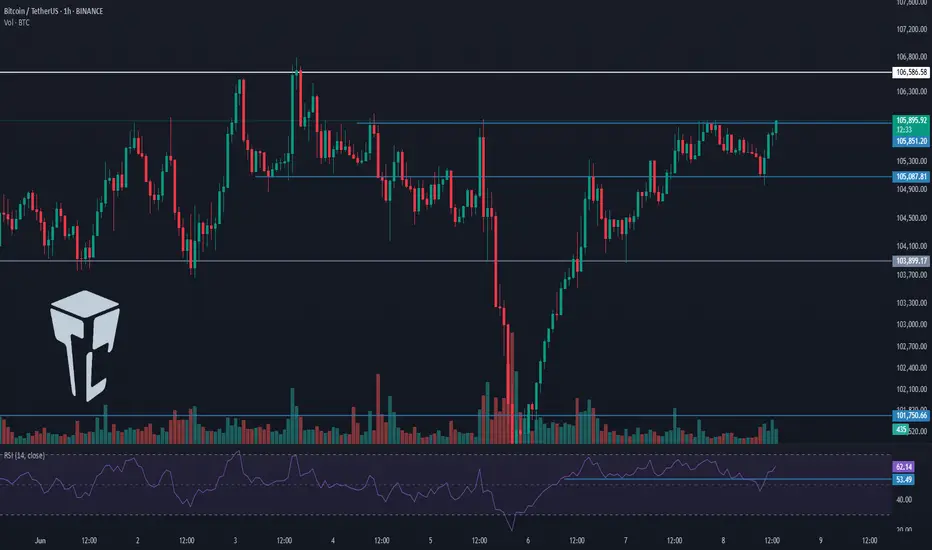
TradeCityPro | Bitcoin Daily Analysis #111👋 Welcome to TradeCity Pro!
Let’s take a look at Bitcoin and key crypto indicators. As usual in this analysis, I’ll review the futures triggers for the New York session.
⏳ 1-Hour Timeframe
As you can see in the 1-hour timeframe, none of our triggers were activated yesterday and Bitcoin has been ranging.
⭐ There was an important RSI level at 53.49, which was tested multiple times. I mentioned that breaking this level could trigger a slight correction — and that’s exactly what happened. The price pulled back slightly to 105087, retested this zone, and now RSI has returned above 53.49. Price is also moving with strong bullish momentum toward the 105851 resistance.
📊 The buying volume entering the market is quite strong, and if this increase continues, the price could begin an upward move. So in terms of both momentum and volume, we have bullish confirmation and can enter a position if the triggers activate.
📈 For a long position, the trigger we’re watching is 105851. While the main resistance is at 106586, I prefer to take the risk and open the position earlier, because I think the 106586 break won’t provide a clean entry and would be harder to act on.
✨ So my chosen trigger for a long position is 105851. Given the rising volume and high RSI momentum, we have the confirmations needed to open this trade.
🔽 For a short position, the first trigger is the break of 105087. This is a risky position since we haven’t yet confirmed a trend reversal — this would be the first signal if a downtrend begins. Personally, I’ll wait for confirmation of bearish momentum before opening a short.
👑 BTC.D Analysis
Bitcoin Dominance is still below the 64.67 level and is ranging under this resistance.
🧩 A break above 64.67 would confirm a bullish move in dominance. A break below 64.49 would signal a bearish reversal.
📅 Total2 Analysis
Total2 is ranging below the 1.15 level. A break above this zone could initiate a bullish move.
🔔 On the bearish side, the current trigger is the 1.13 level. We need to wait for this level to be broken for a trend reversal confirmation.
📅 USDT.D Analysis
Tether Dominance stabilized below the 4.79 zone yesterday and has now pulled back to it, preparing for a possible second leg downward.
🔑 If that happens, the crypto market could move upward. However, if USDT.D rises back above 4.79, its uptrend could continue.
❌ Disclaimer ❌
Trading futures is highly risky and dangerous. If you're not an expert, these triggers may not be suitable for you. You should first learn risk and capital management. You can also use the educational content from this channel.
Finally, these triggers reflect my personal opinions on price action, and the market may move completely against this analysis. So, do your own research before opening any position.
QNT Accumulating Under Resistance — Big Move Ahead?QNT is showing strength, but a key test lies ahead.
After breaking out of its previous downtrend (red line), QNT has formed a strong rising structure supported by the blue trendline.
The price is currently consolidating just below the key resistance zone, attempting to gather momentum. This is a classic sign of healthy price action — retesting higher levels while maintaining support.
As long as QNT holds the strong rising support line and the lower support zone, the bullish structure remains intact. A clear breakout above the resistance zone could trigger the next leg higher.
However, if price breaks below the rising support, we could see a pullback toward the lower zone for re-accumulation.
For now — it’s a wait and watch at the resistance. Bulls need to prove their strength.
DYOR, NFA
