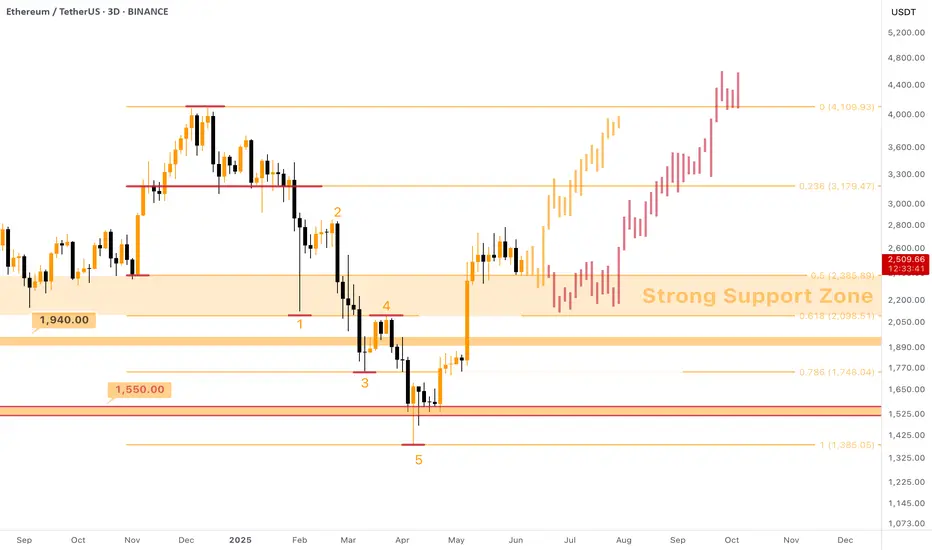
$ETH - New ATH This Year! But it takes time (as usual)I tend to believe the patience pays off
A sharp growth of almost X2 earlier this year granted #Ethereum an opportunity to take hold above major support levels and CRYPTOCAP:ETH gladly took this chance. Now the price is staying above the $2100 - $2400 support zone.
If you are looking for a safe way to X2 your capital this year, you should definitely consider buying Ethereum in this price range.
In fact, there are two possible options of further price movements:
Orange path (~33%) : light touch of the support zone, followed by a sharp pump upwards towards the $3200 resistance by the month of August 2025. Then some consolidation there and continuation with the coming of Autumn (traditionally bullish season for crypto) .
Red path (~66%) : a full-fledged dive in the support zone, down to $2150 (shadows can even reach $1950ish zone) . It will take more time, but allow people to build more proper positions, if they have not done so already. This dive can also help in gathering liquidity (from liquidating early LONGs with high leverage, everything with lev. higher than x6 will be washed down) that will later be used for pushing the price higher .
As you could understand, I'd prefer the second option , but those who know Ethereum erratic behaviour they just... know. I will start accumulating CRYPTOCAP:ETH once it reaches $2450 and will continue doing it down to $2100 using x5 leverage (if such price will ever be achieved) .
Target is $4500 - $5000. Being realistic here.
Cryptomarket
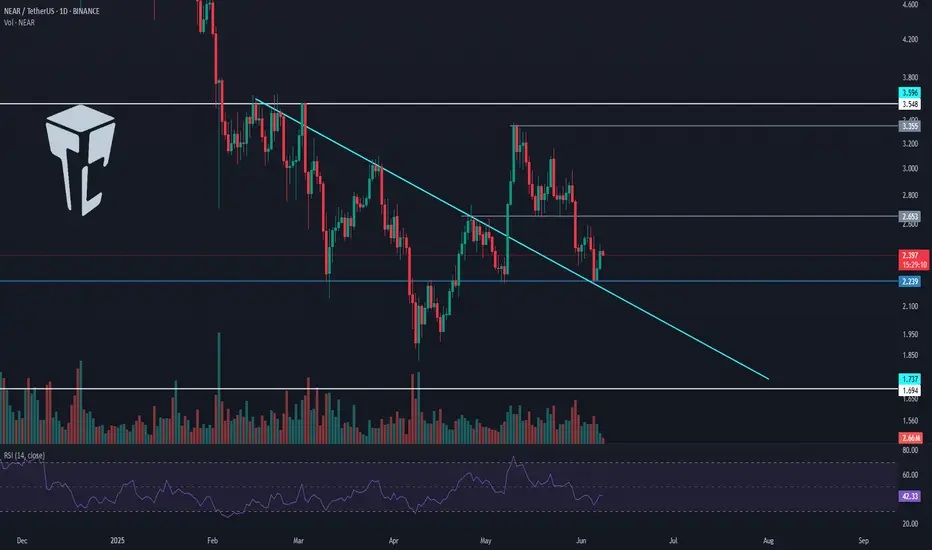
TradeCityPro | NEAR: Key Support Battle in Layer 1 AI Protocol👋 Welcome to TradeCity Pro!
In this analysis, I’m going to review the NEAR coin for you — one of the prominent AI-focused and Layer 1 protocols that has gained significant attention in recent years.
🔍 This project’s coin, with the ticker NEAR, currently holds a market cap of $2.94 billion, ranking 34th on CoinMarketCap.
📅 Daily Timeframe
As you can see in the daily timeframe, there is a very strong support level at 2.239, which has been tested multiple times. The price has once again reached this zone.
✨ If this level breaks, the price could drop toward lower supports such as 1.694. Therefore, a break below 2.239 would be a valid trigger for a short position.
💫 The trendline drawn on the chart is also a significant level. If 2.239 is broken, price could potentially react to this trendline as well.
💥 If price holds this support and attempts a bullish move, we can open a long position upon breaking 2.653.
📈 The main long triggers, including potential spot buying, are at 3.355 and 3.548. If these levels are broken, NEAR could begin a strong uptrend toward targets at 4.726 and 7.998.
📊 Currently, market volume is ranging — buyers and sellers are evenly matched. We need to wait and see which side gains dominance to follow the momentum.
✔️ On the RSI oscillator, entering the Oversold zone would confirm a short setup, while breaking above the 50 RSI level would confirm a long setup.
📝 Final Thoughts
This analysis reflects our opinions and is not financial advice.
Share your thoughts in the comments, and don’t forget to share this analysis with your friends! ❤️
Litecoin —It's All In Your Mind, Time To DecideTruly the longest consolidation phase has been experienced, since June 2022 until June 2025. This consolidation produced a broad channel for Litecoin but, make no mistake, this is a trading range.
The difference between a rising channel where consolidation is happening and a very strong bull market is the slope of the rise. The bull market price action produces a much stronger rise, as shown by the bars pattern.
The action becomes more erratic to the upside rather than stable and sideways. The market becomes euphoric because people cannot handle all the money they hold. Your account balance grows and grows and grows, so much that you lose all control. So much that you forget it, so much that you don't take action and then everything is gone.
It is incredible but still, many people do take advantage and those are mainly the ones with experience.
The first time we get it wrong. That's ok, we've all been there, nobody to blame rookie mistake.
The second time we do better but we still feel we could have done even better. If only we had more organization, more time to prepare; more experience...
The third time... This is the third time.
Thousands of millionaires are created in each bull market, tends of thousands, are you going to be one of those?
There is no competition. For you to make money nobody else has to lose money it doesn't work that way. It is different; the market gives, the market takes.
If you are ready to accept a lot the market will give you a lot.
If you are here to lose money the market will take everything away.
It is not about the whales, the bots or the exchange... It is all about you, it is all in your mind.
Some people join the last few days and make millions by buying big and selling right away, over and over. Some people lose millions by going LONG going SHORT when the market is neither going down or up. Some people are playing games.
You just need to decide, consciously and unconsciously what is your true goal. If you want financial independence, financial abundance, financial freedom, just make your choice. Say it, write it, see it, feel it... Believe it, and everything you want will be yours.
There is no limit other than your own mind.
The market will give you whatever you are ready to accept.
If you work for 10 millions dollars, that's exactly what you will get. But, if you work for 100 millions, hundreds you will get. There is no limit. It is all in your mind.
Namaste.

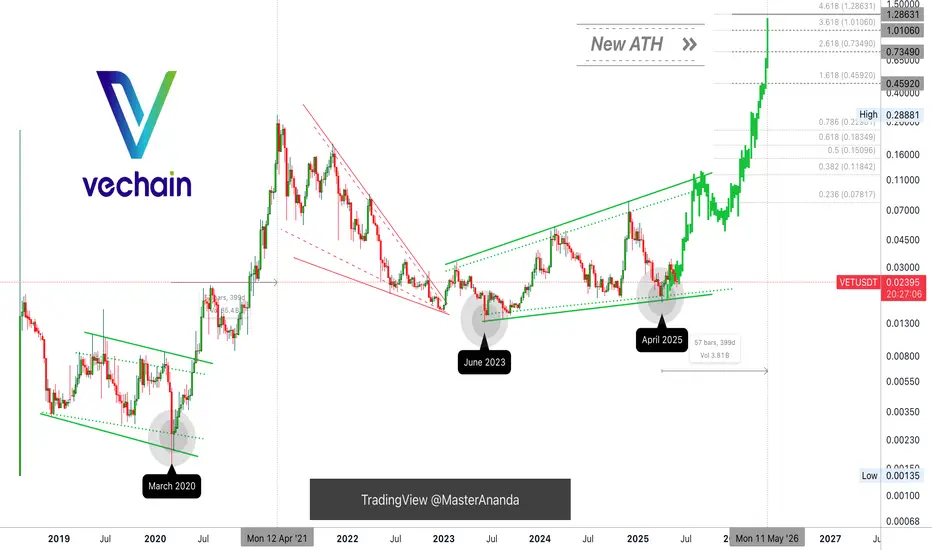
Vechain, Pick Your Own All-Time HighA mirror image from 2020-2021 would put a new all-time high for VETUSDT (Vechain) around mid-May 2026. Starts late ends late, right?
This is a great chart. Vechain hit bottom June 2023 and has been consolidating within a rising channel. A rising channel as in higher highs and higher lows. Now, this is bullish but still not a bull market but bullish consolidation.
Consolidation can happens in three different ways:
1) Purely sideways. When the action happens within a range.
2) Bearish consolidation. When consolidation produces lower highs and lower lows.
3) Bullish consolidation. As we see here, with higher highs and higher lows.
Now, this is bullish but still only part of the transition period. Bull market action is what you see on the left between March 2020 and April 2021. Notice the huge difference.
Some other projects have been producing lower lows but this isn't a bear market more like bearish consolidation. We are about to enter the bull market phase. And this phase tends to end in a bull run.
If the same pattern from 2020-2021 repeats, we can see a new all-time high in May 2026. I have four new ATH projections on this chart, pick your own.
Thank you for reading.
Namaste.
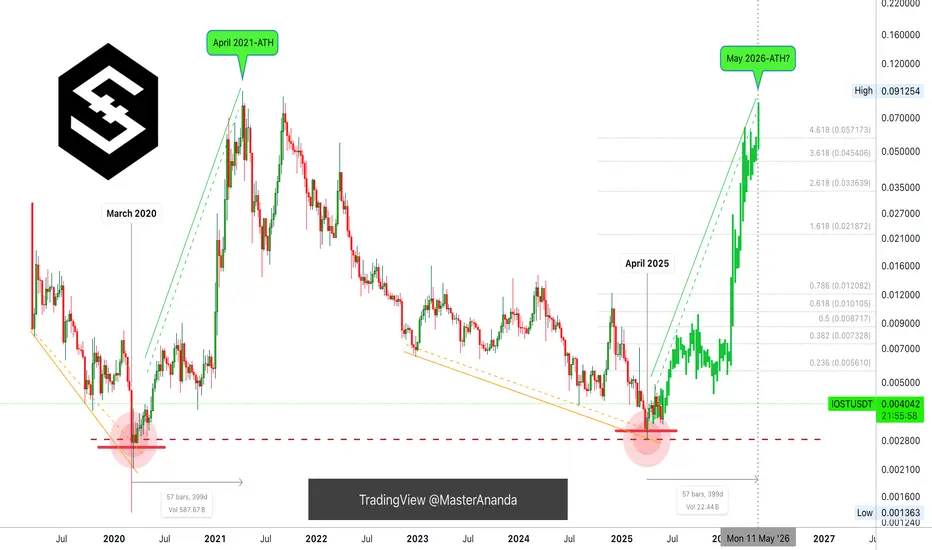
IOST: New All-Time High May 2026? Interesting... Must Read!The lowest price ever for IOST happened March 2020. The second lowest happened April 2025. We shouldn't expect for IOSTUSDT to go as low as March 2020, we can easily say/predict/assume that the bottom is already in.
Let me show you something really interesting.
IOST entered a bull market after the March 2020 bottom, supported by easy money. The bull market from bottom to top lasted 399 days.
If we do a time-fractal and project 399 days into the future counting from the April 2025 low, this would give us a date of May 2026. Interesting. We are set to have easy money this year as well, same conditions as in 2021.
I've been saying late 2025 or early 2026 for the full bull market to unravel, but this is an interesting date. I don't know how long the bull market will last, I don't know how far up prices will go. There is only one thing I know 1,000% certain, safe, Crypto is going up.
IOST already hit bottom and is printing a higher low. This higher low marks the start of the next leg-up, the continuation of the bullish impulse. This impulse should last a long time, long-term growth.
It would be awesome if we have a bull market until mid-2026, but be prepared for anything to happen. The most important action right now is to accumulate, buy while prices are low and hold. Hold strong. You will be happy with the results.
It will take a while but it is something certain. The bull market can end later this year or in 2026, that's ok. As long as everything grows, we can produce financial success. Financial freedom. Financial independence. Financial abundance. It is all yours to take.
Namaste.
The 2025 Bull Market: Do Not Sell Unless You See A New All-Time How long have you been in this market? You are about to embark on a journey; you are about to experience/enjoy the most sought after phase of the cryptocurrency market, the bull market.
If you've been around for less than four years, you've seen nothing like it. It will blow your mind.
You can see the numbers on the charts, past action and there you have your proof, but nothing can prepare you for the actual experience. Even if you've experienced previous bull markets, the actual event is mind-blowing. We are dying for you to try it. We cannot wait anymore... We just want you to earn, make money, share, have fun and enjoy. We, the Cryptocurrency family, deeply love you and wish for you amazing results.
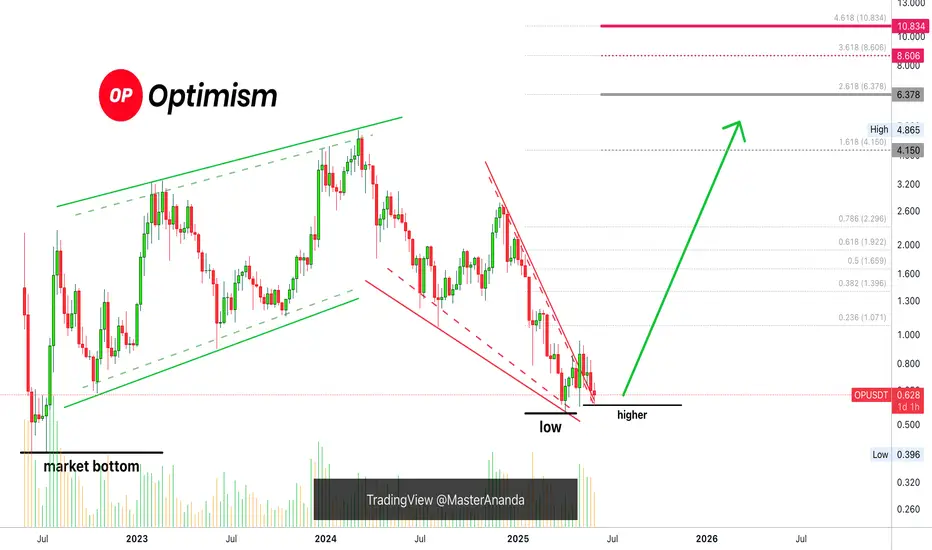
Don't be shy. Do not be afraid. Buy everything up like it is the end of the world. Once bought, hold. Do not sell. I repeat, do not sell until prices are high, really high up. For example, looking at Optimism, OPUSDT, wait for a new all-time high before taking profits.
Thanks a lot for your continued support.
Leave a comment if you enjoyed the article, it will only take ten seconds.
Namaste.
BTC Idea CRYPTOCAP:BTC Daily chart.
What will you be going for?
The bull flag which means another ATH?
Or the mini head and shoulders top if it breaks down we can see 92k CRYPTOCAP:BTC ?

BITCOIN REVERSAL INCOMING !!!! BUT WHEN????Currently we have seen a great move from 75k to new ATH 112k BUT now whole bullish momentum seems to be fading.
If we see charts, we clearly see ranges and recently Bitcoin has swept range high & reclaimed back into range, which indicates lose momentum. We may see BTC tapping 90K even 80'sK for next bullish move.
For all to maintain it's bullish momentum, Bitcoin have to stay above 74.5k and needs to break and hold above 109.5K.
Breaking below 74.5k would push BTC as low as 60-55k
STAY CAUTIOUS !!!!

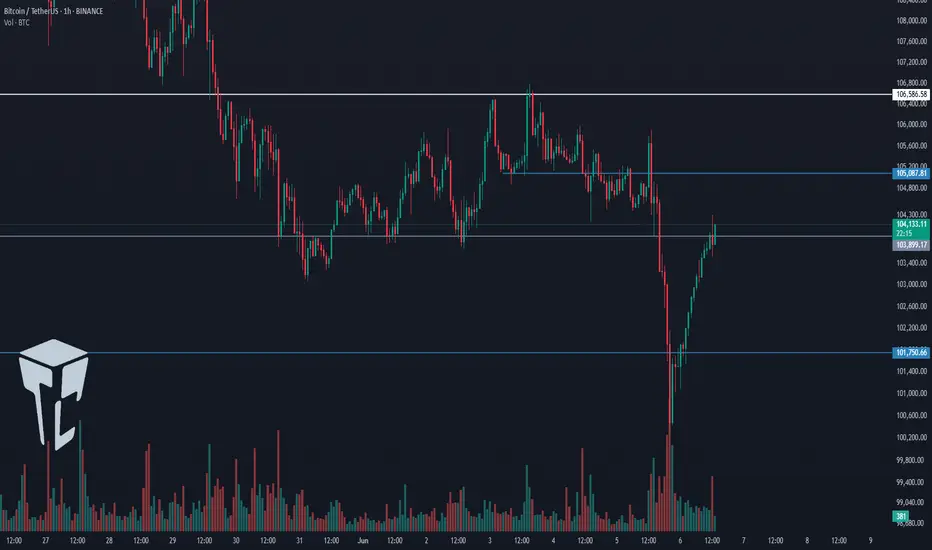
TradeCityPro | Bitcoin Daily Analysis #110👋 Welcome to TradeCity Pro!
Let’s dive into the Bitcoin analysis and major crypto indexes. In this review, as usual, I’ll cover the key futures triggers for the New York session.
⏳ 1-Hour Timeframe
As you can see in the 1-hour timeframe, Bitcoin formed a higher low yesterday and has now reached the 105087 resistance. It seems likely that this level will be broken soon.
✨ Currently, a candle has closed above 105087, but price hasn’t yet confirmed a breakout, and the move hasn’t taken off.
📈 For a long position, we can enter once the price confirms a breakout above this level. If 105087 breaks, price could target 106586. The main long position will be opened upon breaking 106586.
🛒 Strong buying volume is a very good trigger for this setup. RSI entering the Overbought zone would also provide a powerful momentum confirmation, and price could rise accordingly.
💥 If the current upward move fails and price falls below the recent low, we can open a short position upon breaking 103899, targeting 101750.
⚡️ The 53.49 level on RSI is critical — its break would serve as a strong confirmation for the short position.
👑 BTC.D Analysis
Looking at Bitcoin Dominance, yesterday it once again moved toward 64.67, but failed to break it and is now heading downward after being rejected from that resistance.
🔑 The trigger for bullish continuation remains 64.67, while 64.49 serves as the trigger for a bearish move.
📅 Total2 Analysis
This index formed a higher low at 1.13 yesterday and is now testing the 1.15 resistance. If this level breaks, the price could head toward 1.17 and 1.18.
📊 A break above 1.15 would be a valid long trigger. However, if price is rejected and moves downward, breaking 1.13 could send it back toward 1.1.
📅 USDT.D Analysis
USDT Dominance closed below the 4.79 level yesterday and is now moving toward 4.70. If this continues, the crypto market could see bullish momentum.
🧩 However, if dominance moves back above 4.9, the next bullish leg in USDT.D could begin.
❌ Disclaimer ❌
Trading futures is highly risky and dangerous. If you're not an expert, these triggers may not be suitable for you. You should first learn risk and capital management. You can also use the educational content from this channel.
Finally, these triggers reflect my personal opinions on price action, and the market may move completely against this analysis. So, do your own research before opening any position.

TradeCityPro | ATOM: Major Support Test in Cosmos Ecosystem Coin👋 Welcome to TradeCity Pro!
In this analysis, I’m going to review the ATOM coin for you. This project is part of the Osmosis network ecosystem.
🔍 ATOM, with a market cap of $1.68 billion, is currently ranked 51st on CoinMarketCap.
📅 Daily Timeframe
As you can see in the daily timeframe, ATOM is currently sitting on a very significant support zone. It has tested this area multiple times, and once again, it’s hovering around that level.
⭐ If the price finds support here and begins to move upward, we can consider entering a long position with a trigger at 4.588. The main bullish trigger will be the 5.380 level, and if that breaks, spot buying can also be considered.
✨ As I always mention with spot triggers on altcoins, it’s best to wait for Bitcoin dominance to start declining before entering. If that happens, ATOM could potentially move toward targets at 7.514 and 10.4.
⚡️ If the key support at 4.075 breaks, we can open a short position targeting 3.501. The 35.68 level on the RSI is a critical support, and a break below it would serve as a momentum confirmation.
📊 Also, keep an eye on market volume. It has been declining recently, and once volume starts flowing in on either side, we can prepare to act on the corresponding trigger.
📝 Final Thoughts
This analysis reflects our opinions and is not financial advice.
Share your thoughts in the comments, and don’t forget to share this analysis with your friends! ❤️

Polygon, Higher Low? Easy 1,000% Profits PotentialFour weeks red! Do you really believe the market will continue moving lower? If the answer is yes; think twice, stop! Think again.
Four weeks red is all that you will get you bearish bastard.
Your time is over. We are taking over, the bulls are entering the game.
You had your fun, you had it for a few days.
You can't have it anymore, I am calling my friends.
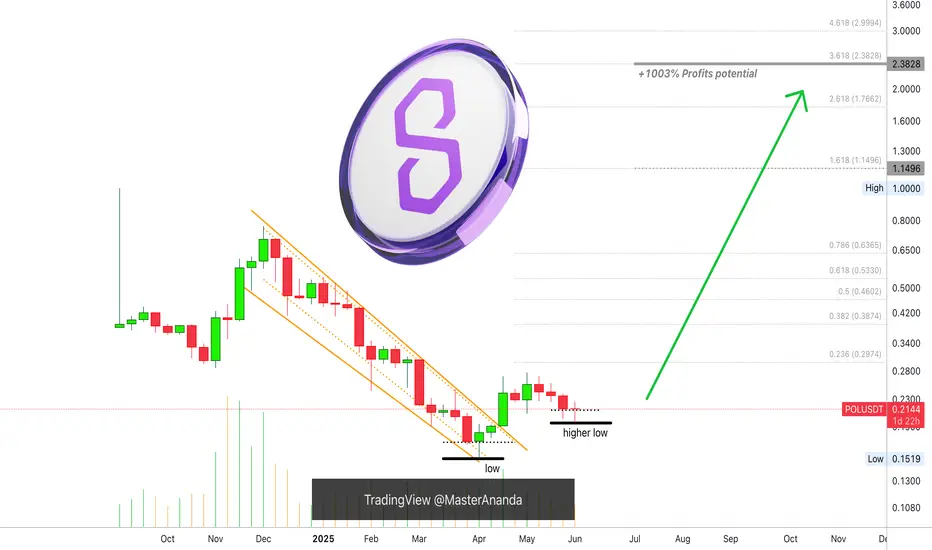
Friends, look at Polygon (POLUSDT), the chart looks great.
Whenever there is a retrace within a bull market, this is an opportunity to enter again.
Great timing, great prices; the start of a new bullish wave.
Prices are about to grow... Everything is about to grow... Crypto is going up. Are you in or are you out? Did you miss the initial bullish breakout? That's ok. The next bullish wave will 4-6 times bigger than the previous one for this pair. Sometimes even more. Here we have 1,000% profits potential as an easy target.
Get ready and be sure to be prepared.
Start buying like the world is about to end. Why?
Because there will be so much growth in the coming days, that you want to profit all the way. To profit you need to be in, you have to buy when prices are low.
You cannot wait for the green candle, the best time is now.
Thanks a lot for your continued support.
Namaste.
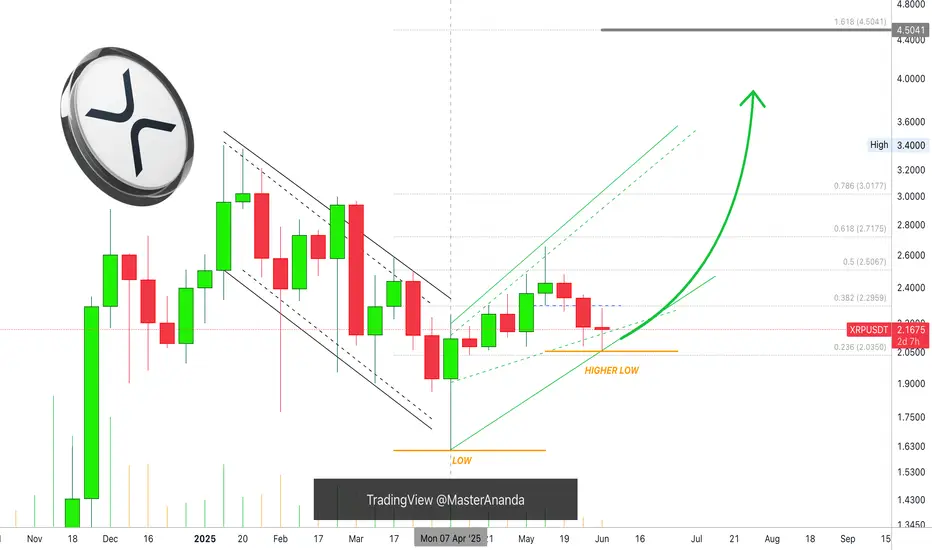
XRP Bullish, The Retrace is Over! Aim HighWhat we need to consider here is the size and duration of each move.
The rise from 7-April through 12-May amounts to 64%.
The retrace from 12-May to present week amounts to 24%.
» So the retrace is more than a third part the size of the advance.
The rise lasted 6 weeks.
The retrace so far has 3 weeks.
» So the retrace is half the length of the rise.
Both these readings are super standard for a bull market. A retrace can easily end this week or early next week followed by 2-3 months of growth. Within this new wave of growth, there will be other retraces but a correction only comes at the end of the main wave. After the correction comes another advance and then a bear market.
Ok. We have a higher low and the chart is pointing up.
After three weeks of bearish action there is no sellers pressure, trading volume is really low.
The bears have no steam, no force, no momentum; the bears are gone.
Knowing this, we can aim high...
The retrace is over!
Thanks a lot for your continued support.
Namaste.
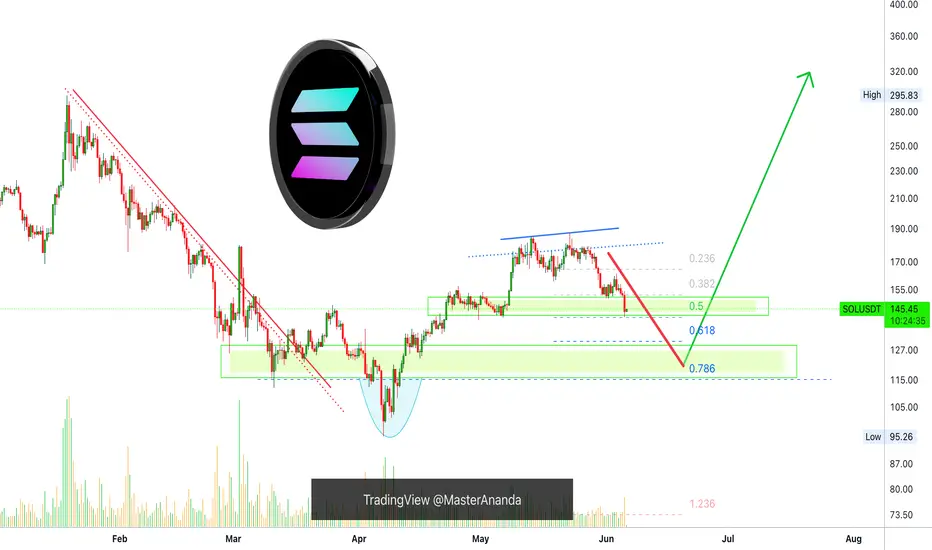
Solana Bullish, Retrace Over! Aim For $620 or $1,020 In this 2025 Cryptocurrency bull market, you should be aiming for $620 or $1,020 for Solana, $420 is the minimum.
How are you feeling today my dear friend?
I hope you are having a wonderful day.
Retraces and corrections, they can only last so long.
Solana dropped from $188 to $141 and I believe this is enough, a 24% drop (-24%).
As the retrace ends, the chart will produce a higher low and, as the higher low becomes confirmed, SOLUSDT starts a new wave of growth.
$420 is the minimum target for this bullish wave and should hit first but, you should aim higher, much higher. Crypto is showing to be many times stronger than what most people think.
Remember, the mistake we always make is not aiming too high but aiming too low. In each bull market, we tend to underestimate the market. Aim high, because we are going up.
Retraces and corrections are an opportunity to buy-in, 2nd entries, rebuy and reload.
Don't try to SHORT within a bull market, it is dangerous and not worth the risk. It is better to wait for support and go LONG. Always trade with the trend, specially if you are using leverage. Crypto is going up. Solana will now turn green.
Thank you for reading.
Namaste.

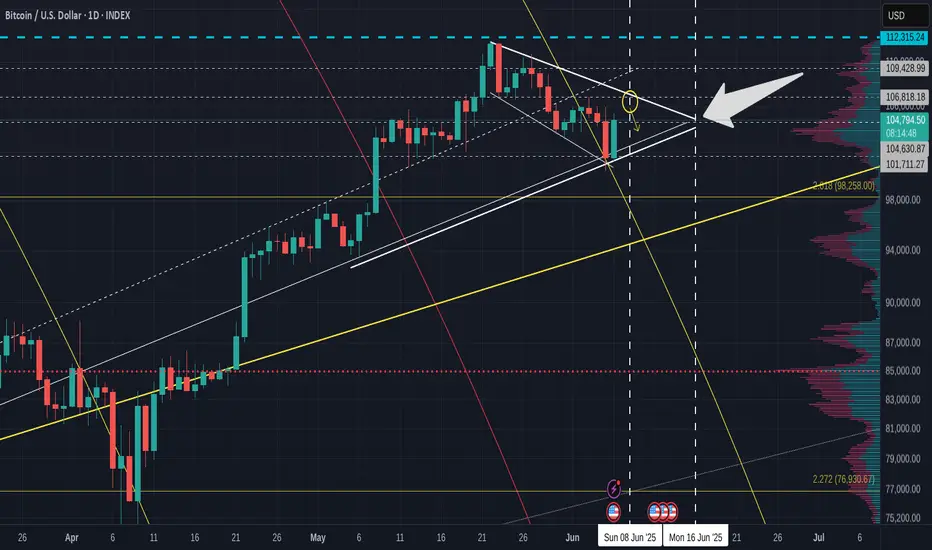
Bitcoin DAILY & 4 hour charts show possible push in 10 days ?
First of all SORRY for all the lines.
This is a working chart but they are all relevant to this post.
Main chart is DAILY and shows ua the Pennant that we appear to be printing with the descending channel inside. The diagonal line falling is the Fib Circle we recently broke through.
See how, once above the fib circle, we slid down the outside, using it as support, as we often do.
Then we hit another line of support and that created this recent push higher.
Should we continue, we will most likely go to the upper trendline, towards that circle. Circle center is around Sunday 6th.
While we are still on the daily, see that Pennant Apex...that is a Week on Sunday, the 15th.
99% of the time, PA reacts BEFORE the apex.
Should things continue, we can expect to see a rise till end of weekend, Rejection back to lower trend line and then a Rise and maybe a push Out of the pennant to new highs.....OR, and I think this is very probable, we go back to around the ATH line ( blue Dash) and Dip back down again.
It is worth remembering that we have inflation data being released in the USA next week.
People will likely wait to hear ths before making to many big moves.
The Daily MACD offers some guidence on this also
MACD nearly back on Neutral and could bounce. The Dashed line is this sunday.
MACD could continue to drop below neutral, we shall have to watch this closely.
As I mentioned, in the short term, BTC likely to reach for this circle in the 4 hour chart below.
I will admit, I expected PA to reach this point in a differnent way as posted earlier in the week, But, Hey, we still getting there..
Should we get rejected there, as I expect we will, then a revisit to 103K before a push back.
But given the inflation figures, things could get very volatile next week so CAUTION
We can see on the 4 hour MACD how we have already been rejected of Neutral once and we are heading there again
The potential to push through the neutral line exists but.......
I do expect some volatility and so we need to be aware things could change rapidly.
The inflation data is a key. Depending on if it is drooping, rising or flat, this WILL effect the situation with regard to the FED Rate decision later this month.
So, we wait, with caution and expectations
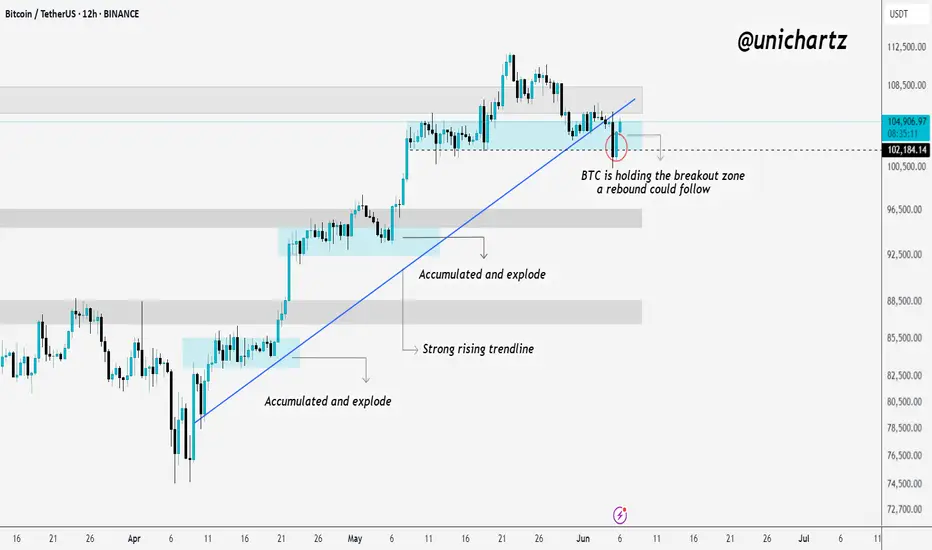
False Breakdown? BTC Eyes Rebound From Demand Zone!Bitcoin has broken below its strong rising trendline, but this move could well turn out to be a classic seller’s trap. Despite the breakdown, BTC is currently holding above the key breakout zone, which has historically triggered strong rebounds.
The price is also sitting right inside a previous "accumulated & explode" demand zone — an area where buyers have consistently stepped in. If BTC manages to hold this zone, a sharp rebound could follow, trapping late sellers and driving price higher.
However, if the support zone fails, we could see deeper downside. For now, this is a critical pivot — watch price action closely to see if bulls defend this level or if sellers gain control.
If you liked it, do comment and follow us for regular market updates.
THANK YOU
Aave Bearish, Be Aware (Do Not Buy Now, Sell or Wait)Aave grew almost 150% in 50 days. Now the market is entering a correction phase. Not a true correction only a retrace but it is almost the same.
The rising wedge is a bearish pattern. It is coupled with very low volume.
The action moved out of the rising wedge; bearish confirmed.
There is a local lower high and this points to lower before the market turns bullish again.
We keep it simple. We either wait or SHORT, but we do not buy here.
» If you are a bull, you can wait for prices to move lower to buy again or you can sell.
» If you are a bear, you can SHORT; this is an easy trade.
The market will confirm my analysis in a matter of days.
This is very easy of course.
Thank you for reading.
Stay (protect your money) safe.
Namaste.

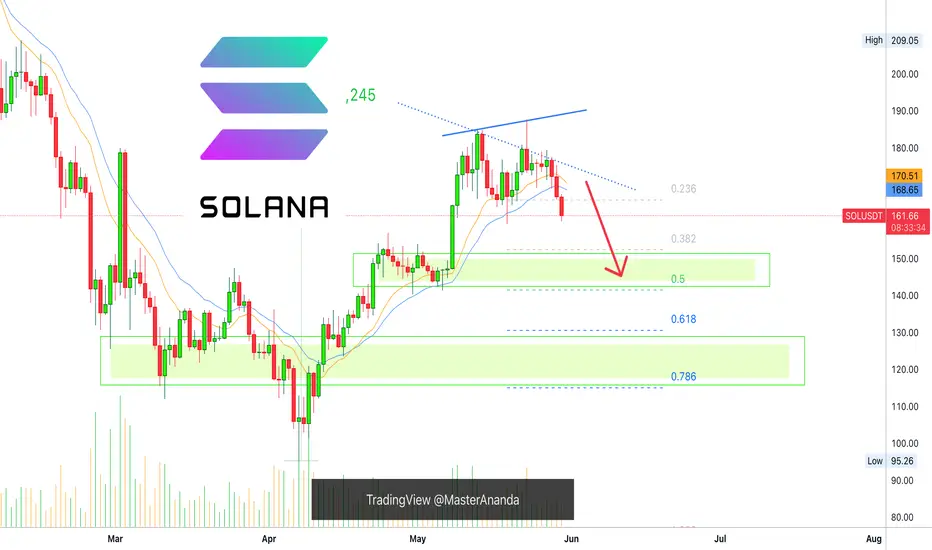
Solana Short-Term, Already Bearish After 97% UpWhat will happen in the long-term? Before we get there, let's focus on the short-term real quick because we want to know what is happening with the market now.
The market offers endless opportunities. We need to take advantage of those, our edge. We have an edge and this edge is being able to read the chart. With this edge, we can time the market and increase our trading success.
Solana grew by 97%. This is good. Of course, some pairs grew way more while others grew less. I did mentioned that when Bitcoin grows 50%, some Altcoins can grow 300%. This is exactly what happened, this is because of the size of the projects.
Some pairs grew more but these were smaller pairs. Some pairs grew less but these were bigger. That's just the nature of things.
This 97% bu-wave can be correlated to a 300-400% bullish-wave on other pairs. This means that after a growth wave comes a correction.
SOLUSDT—two main interesting levels. Won't mention them as they are shown on the chart.
Both are likely to hit but the first high is really high probability.
This is easy. Wait for support before buying again. I say "again" because you are supposed to sell at resistance, we are assuming you sold at resistance and are ready to buy at support.
Good? We are good.
The market will continue to move down and up while long-term it produces sustained growth.
We need to adapt fast and be smart, everything can change in a day.
Keep an eye on the news, we might be in front of some major event.
Political events can change everything and cannot be predicted.
Thank you for reading.
Namaste.
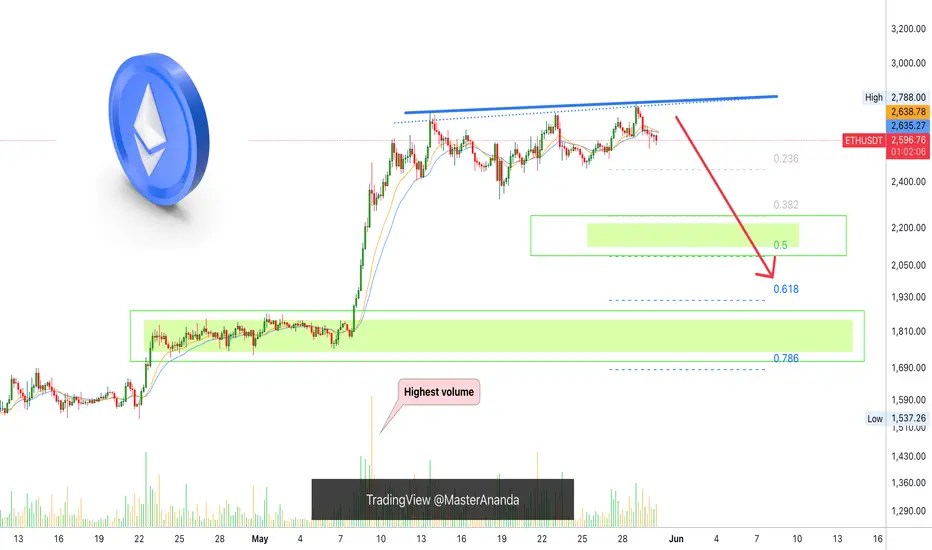
Ethereum Danger Zone —Protection, Correction or Continuation?Ethereum can be seen trading below EMA55 on the 4H timeframe. The biggest volume session happened 9-May and it was red. This tells us that there is correction potential after a very strong 101.1% bullish growth wave.
There are mainly three levels to consider for the correction potential after ~100% growth. 0.382, 0.618 & 0.786 Fib. retracement levels. After the test of these levels, whichever one comes last, we can read the chart again and see if Ethereum will continue lower or produce a bullish wave.
One thing is very certain though, after strong growth, there is always a correction/retrace. This is what you are seeing now in this chart. The start of the drop. Taking action is best.
The market moves in waves and will never stop this pattern, it fluctuates. To trade, one buy lows near support; sells high when resistance hit. 100% growth is very strong for the second biggest Cryptocurrency project, the #1 Altcoin.
After a strong bullish wave there is always a correction. After the correction there can be more correction but at some point the market turns. Each chart/pair needs to be considered individually on multiple timeframes to have a better understanding as to what will happen next.
In a single day, based on the news, market conditions can always change. Stay alert!
Namaste.
Will Solana Go Lower? Yes! Only To Recover HigherI've been asked: Will Solana continue lower?
I think it is a fair question but it is also pretty hard right now to say based on the chart, there are just too many mixed signals.
For example, if we take Solana in relation to Bitcoin, it is trading daily below EMA55 and MA200, while Bitcoin is trading daily above these levels. Bitcoin hit recently a new all-time high while Solana only produced a small recovery in May.
When it comes to the chart signals, SOLUSDT produced a volume breakout on the bearish side and the support zone was completely challenged on a single candle. What's more, Solana will grow really strong later this year, so it would be normal to see as much bearish action as possible now because later we will have sustained long-term growth.
It is a coin flip, but if you ask me, it can go a bit lower before moving up. It can go lower to end up producing a higher low.
I will wait for clear reversal signals before going LONG.
I closed all my LONGs a while back, when it became clear that the market was going into correction. Now we can just wait easily and patiently until the correction unravels, after the correction comes a new wave of growth. Down and up, down and up... The market continues to cycle. Never straight down, never straight up. It moves in waves.
Namaste.
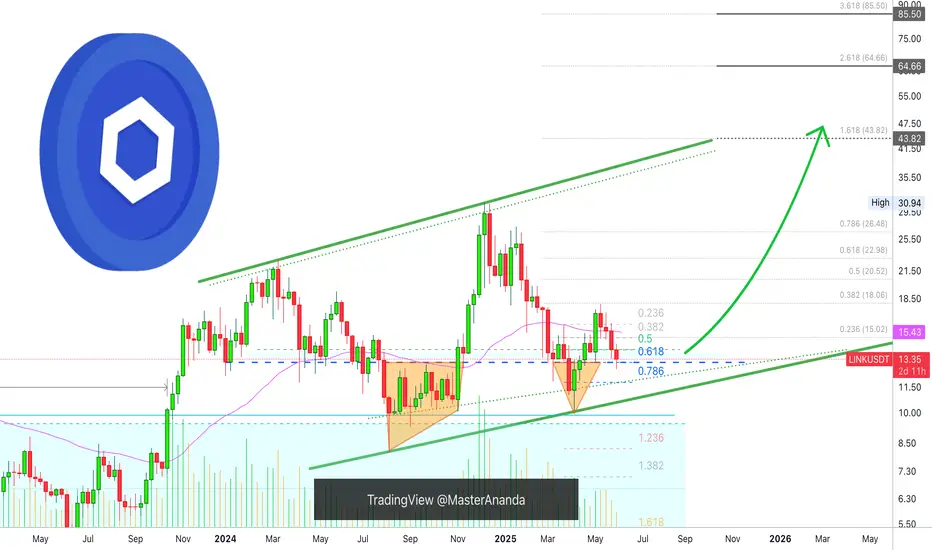
Chainlink Support Remains Intact, Short-Term Noise (10X)Notice here Chainlink on the weekly timeframe. This week wicked below our strong support on the chart marked by a blue dashed line, this level is the 0.618 Fib. retracement ratio. The baseline of the v shaped bottom and also the bottom formation of 2024.
The retrace, bearish action, so far has been going for four straight weeks. The entire rise was five weeks longs. I mentioned this previously. This means you can easily go ALL-IN on this type of chart setup, buy and hold.
The retrace can never be longer than the drop. The fact that support is holding means that Chainlink will continue growing, will resume its bullish wave. A bullish continuation.
This is a friendly reminder. I know it is hard, but this type of setup is where experts open LONG with 10X. I am not saying that you should, I just want to show you how we are attracted to and tempted to buy when the market is red. That's the time to go LONG. We sell (SHORT) when the market is green.
Thank you for reading.
Namaste.
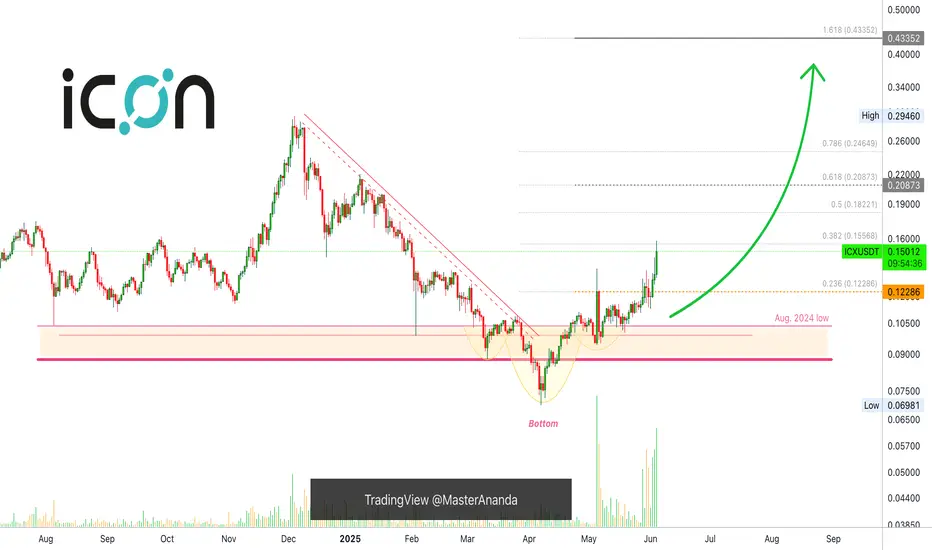
The Trading Rookie, How I Don't Make Money Fast & Waste TimeThe bottom is set and once the bottom is in bullish momentum builds up and grows. Bullish momentum is now present on this chart coupled with really high volume. The high volume is what confirms the current move being real and strong. ICXUSDT daily.
When they are not moving nothing can move them. But when they move they move.
We have the bottom and this is good so we only need a continuation and the continuation will come. Notice that this is the same chart as other altcoins, most altcoins.
This is very simple. I just wait.
If you jump in without a plan and prices retrace tomorrow, you will desperate and fold, sell at a loss. Then just three days later ICXUSDT continues to grow. You see how that works? Three days is not a long time.
It happens that the wait can take weeks but some people are ready to earn today, today alone and today only. Here is how that mentality works.
Let's say the unexperienced trader (me) do manage to buy before prices start to grow. "Awesome, finally I got one." Chasing after the next breakout everyday. The pair goes up 10%, 20%, 30%. Then stops and retraces for a few days. The rookie manages to hold and then boom, a nice 50% jump. Total growth some 70% from entry point considering the small retrace.
At this point, the rookie finds out everything about the pair he holds and prepares to "hold long-term." The pairs keep on growing and profits now reach 100%. Instead of securing a trade, a very nice double-up, 100% profits, the rookie becomes greedy and continues to hold.
The action peaks at 120% profits. From the bottom total growth reached 320% but he didn't get the bottom of course he bought when the action was already underway. Next comes the correction and selling is still not even a possibility because remember, I will hold long-term.
Long story short, when the correction hits bottom, the rookie is ready to give up. He sells everything beat down and depressed. "Crap, I missed another bullish wave." The next day, as soon as he sells the bottom prices start to grow... And the cycle repeats.
This time, instead of buying crazy or being crazy, just trust my call.
Buy those trading at the bottom. Those that everybody ignores. I share these in my profile. Wait patiently and then the market will grow. You cannot earn 500% on a pair if it is already moving, it is impossible. The only way to earn big is by buying when prices are low. Hold strong, hold long and as the bullish cycle develops, your money grows.
Short-term trading is also do-able but requires more experience and planning. When the pair is up 20-30%, you can collect profits. This can also be done at 80-100%, it depends. It depends on your trading style, your capital, your goals... It all depends on you. How are you going to profit from this 2025 bull market bull-run?
Namaste.
TradeCityPro | Bitcoin Daily Analysis #109👋 Welcome to TradeCity Pro!
Let’s dive into the Bitcoin analysis and key crypto indicators. As usual, I’ll walk you through the futures triggers for the New York session.
⏳ 1-Hour Timeframe
In the 1-hour chart, as you can see, yesterday Bitcoin activated the short trigger at 103899 and dropped below the 101750 level. This setup gave an opportunity to open a short position—hopefully you took advantage of it.
✨ After that bearish leg, the downtrend ended and the price began to rise again, now reaching back to the 103899 level.
🔍 If the price gets rejected once from 103899 and then forms a higher low compared to 101750, we can consider a long position on subsequent attempts—if 103899 breaks. If the price breaks this level sharply, the next long triggers will be 105087 and 106586.
📉 For today's short position, we can enter on a pullback to 103899. Personally, I’ll look for a bearish trigger in lower timeframes; if confirmed, I’ll open a short. The main bearish trigger remains the break of 101750.
📊 Currently, volume favors buyers, but we’ve seen divergence during this bullish leg, and volume increased on the last bearish move. So, I still see a higher probability of the market turning bearish rather than bullish.
👑 BTC.D Analysis
Looking at Bitcoin dominance, yesterday it made an upward move to 64.67 after breaking through 64.23. This 64.67 level is a strong resistance, and as shown, the dominance got rejected there.
💫 If this rejection is confirmed, there's a high chance of a retracement back to 64.23. In that case, if the market continues to drop, Bitcoin will likely be a better short than altcoins.
☘️ However, if 64.67 breaks, dominance could initiate another bullish wave.
📅 Total2 Analysis
As for Total2, after activating the 1.16 and 1.13 triggers, it dropped to the 1.1 zone and is now making a pullback to its previous support—similar to Bitcoin.
💥 For a long position, we’ll need a Dow Theory confirmation. For a short, we can wait for a pullback to 1.13 and look for a bearish confirmation to enter.
📅 USDT.D Analysis
Now onto Tether dominance: yesterday, after breaking 4.79, it moved up to 4.98. Following that, it reversed and is now back down to 4.79.
🔑 If 4.79 breaks, Tether dominance could drop further to 4.70 and 4.64. But if it holds and finds support there, another bullish leg may begin.
❌ Disclaimer ❌
Trading futures is highly risky and dangerous. If you're not an expert, these triggers may not be suitable for you. You should first learn risk and capital management. You can also use the educational content from this channel.
Finally, these triggers reflect my personal opinions on price action, and the market may move completely against this analysis. So, do your own research before opening any position.
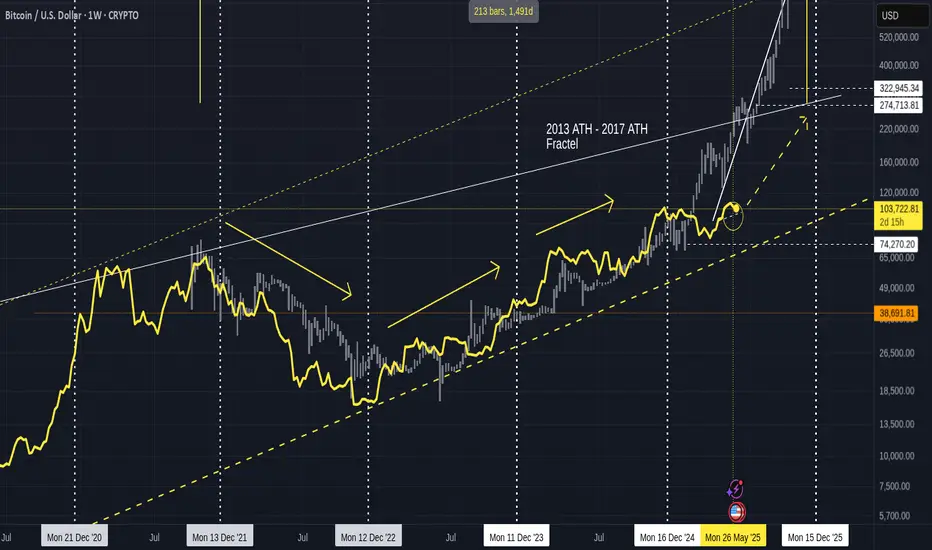
Quick BITCOIN update using old Fractal chart - a small red June
Bitcoin appears to be taking a rest when it is strictly not required.
We are heading towards the 2nd dashed arrow, which as I pointed out months ago is a very possible and more realistic path for Bitcoin to take this cycle.
We have left the 2013 - 2017 Fractal and yet are likely to follow the idea of moving higher to a new ATH from this level off the Fractal.
PA entered that circle I drew back in Feb and is still in it right now, as we can see in the chart below
We can also see how PA has bounced off the 50 SMA on this daily chart.
This does NOT guarantee a continued move higher but it may offer some levels of support.
Should this fail, we do have various levels of support down to around 94K
I will refer back to a previous post and mention that to some extents, I am expecting a RED June. This does not need to be a Big candle, just 1 usd less than the open price wil create that.
104648 was the open price, so, we can easily stay above 100K and create that red candle.
Why do we want a red candle..?
Because, to put it simply, statistically, we have a better chance of continued monthly Green candles after a red june this time
I will attach the chart below so you can read about this in more detail.
This may or may not be good for ALTS>.... but I do not have many now.....just my preference