Is Bitcoin Repeating Its 2021 Price Action? | TRADEDOTSWe’ve observed that Bitcoin CME:BTC1! appears to be repeating a previous wave pattern. If it follows its historical price action yet again, here’s what we might expect:
2021 Comparison
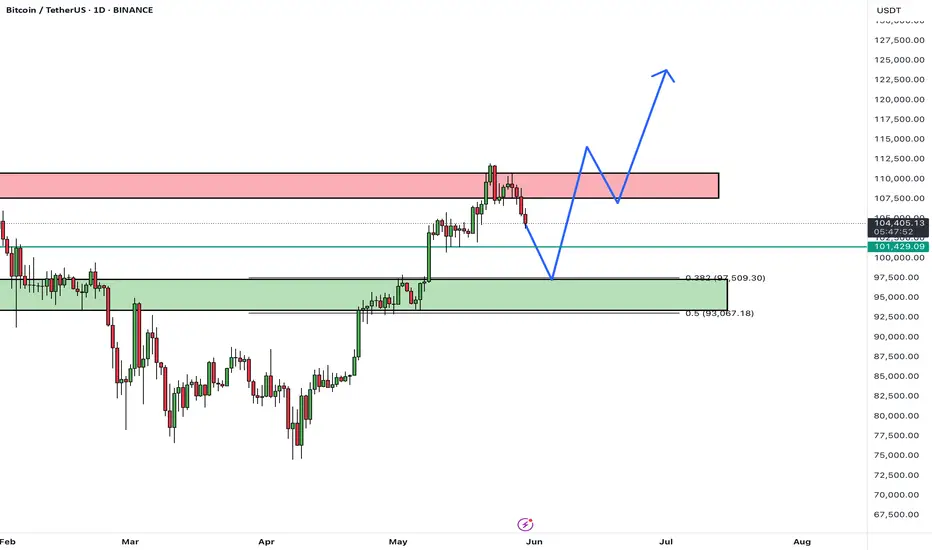
Back in 2021, Bitcoin formed two large rounded wave structures where the second wave exceeded the first, forming two consecutive all-time highs followed by a huge drawdown. This year’s price action looks very similar to the beginning of the second 2021 waves. If it continues to unfold in the same way, we anticipate a new all-time high before the end of this year, followed by a notable pullback into early next year.
Key Support at $96,000
As long as BTC holds above $96,000, the bullish trend remains intact. This level has shown great demand and volume support, reinforcing its role as the floor for the short-term uptrend.
Upside Potential to $117,000
If buyers continue to support the market above $96,000, BTC could reach the $117,000 region, setting another all-time high. This expectation follows the earlier wave pattern seen earlier this year and completes a close parallel to the 2021 bull run.
Deeper Pullback Expected
After a potential new high, a larger correction is likely. Drawing on previous pullback price action, a 30% dip toward $82,000 could align with a higher-time-frame trendline and significant support area—mirroring the wave structure from 2021.
Final Thoughts
BTC remains structurally bullish above $96,000
A pullback to the $82,000 region could present a key buying opportunity if it occurs.
Cryptomarket

BTCUSDTHello Traders! 👋
What are your thoughts on BITCOIN?
Bitcoin entered a corrective phase after a liquidity hunt above the recent highs and is currently in a short-term pullback.
We expect this correction to extend toward the identified support levels, after which a new bullish wave may begin, potentially leading to fresh all-time highs.
The broader trend remains bullish, and the current correction could offer a buy-the-dip opportunity in line with the ongoing uptrend.
Don’t forget to like and share your thoughts in the comments! ❤️
Phemex Analysis #87: Pro Tips for Trading Hyperliquid (HYPE)Hyperliquid ( PHEMEX:HYPEUSDT.P ) has rapidly become one of the most talked-about cryptocurrencies over the past two months. Impressively defying broader market uncertainties, HYPE soared from a low of $9.313 on April 7 to a remarkable high of $40.019 on May 26—achieving an astounding growth of approximately 329%.
However, caution is advised, as recent price action has formed a classic "Head-and-Shoulders" pattern, with the third peak emerging around June 3. This technical setup often indicates weakening bullish momentum and potential trend reversal. Given this scenario, let's delve deeper into several possible outcomes that could unfold for HYPE in the upcoming days.
Possible Scenarios
1. Bearish Reversal
The Head-and-Shoulders formation signals a potential bearish reversal. If HYPE breaks below the critical support levels at $31.5, especially with increased trading volume, and subsequently breaches the $30 support, the likelihood of a sharp downward movement intensifies.
Pro Tips:
Short Positions: Consider initiating short positions upon confirmed breakdowns below $31.5 or $30. Always employ tight stop-losses to manage risk effectively.
Long-Term Accumulation: For those with a longer-term bullish outlook on HYPE, watch closely for price stabilization around lower support levels at $25.5 and $24.3, which could offer strategic entry points for buying the dip.
2. Retesting the $30 Support Level
Another plausible scenario is that HYPE might retrace to the $30 support level, characterized by declining trading volume. If volume diminishes significantly at this level, it could indicate that selling pressure is weakening, setting the stage for consolidation rather than further declines.
Pro Tips:
Grid Trading Strategy: Utilize grid trading to systematically capitalize on potential range-bound movement between clear support at $30 and resistance near $38.
Risk Management: Remain disciplined by setting clear stop-losses above the resistance or below support to protect against unexpected breakouts or breakdowns.
3. Breakout Rise (Bullish Scenario)
While considered less likely given current technical patterns, crypto markets often defy expectations. A bullish breakout above the immediate resistance levels at $37.2 and subsequently $39.7—particularly if accompanied by strong positive news or substantial trading volume—could signal another significant upward move.
Pro Tips:
Watch Resistance Levels: Stay alert for decisive breakouts above $37.2 and $39.7, validating the bullish scenario.
Confirmation Required: Only enter long positions if breakouts are confirmed by sustained volume and supportive fundamental news.
Conclusion
Hyperliquid (HYPE) currently stands at a crucial technical juncture, presenting multiple strategic opportunities for traders. Whether anticipating a bearish reversal, a consolidation phase, or a surprise bullish breakout, successful trading will depend on vigilance, technical confirmations, and disciplined risk management. Stay adaptable, carefully monitor key price levels, and remain informed about news and market developments to confidently navigate trading HYPE.
Tips:
Elevate Your Trading Game with Phemex. Experience unparalleled flexibility with features like multiple watchlists, basket orders, and real-time adjustments to strategy orders. Our USDT-based scaled orders give you precise control over your risk, while iceberg orders provide stealthy execution.
Disclaimer: This is NOT financial or investment advice. Please conduct your own research (DYOR). Phemex is not responsible, directly or indirectly, for any damage or loss incurred or claimed to be caused by or in association with the use of or reliance on any content, goods, or services mentioned in this article.

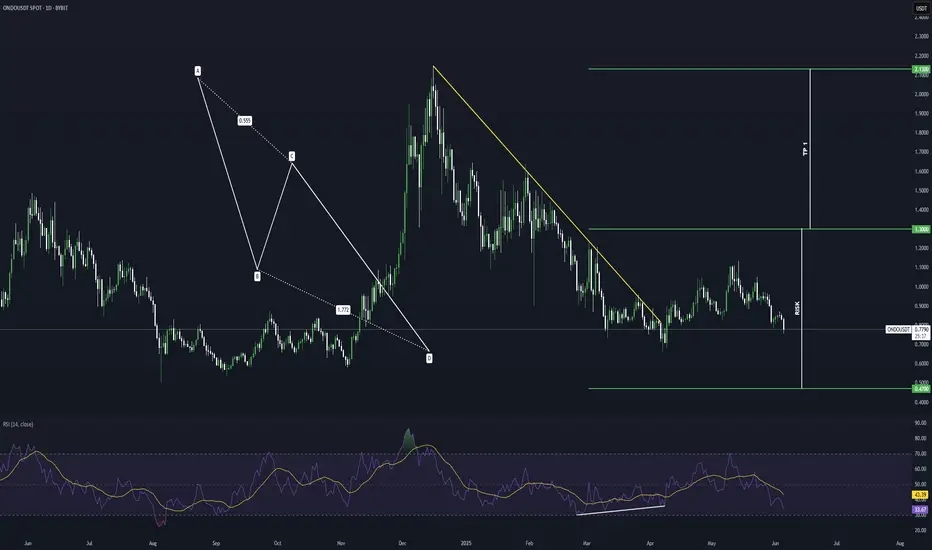
ONDO Finance Potential Bullish Breakout OpportunityONDO Finance seems to exhibit signs of overall potential Bullish momentum if the price action forms a prominent Higher High with multiple confluences through key Fibonacci and Support levels which presents us with a potential long opportunity.
Trade Plan:
Entry : 1.3
Stop Loss : 0.47
TP 1 : 2.13
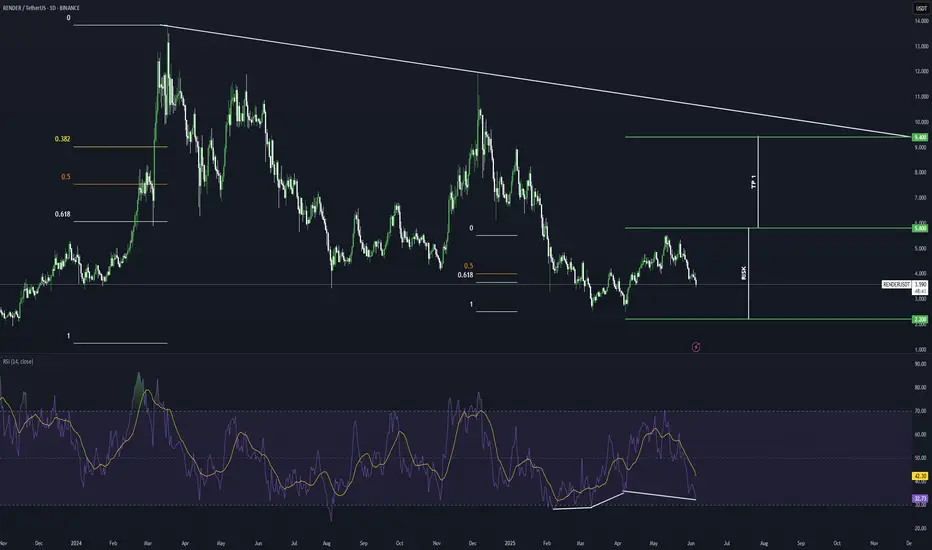
RENDER Potential Bullish Breakout OpportunityRENDER seems to exhibit signs of overall potential Bullish momentum if the price action forms a prominent Higher High with multiple confluences through key Fibonacci and Support levels which presents us with a potential long opportunity.
Trade Plan:
Entry : 5.8
Stop Loss : 2.2
TP 1 : 9.4
BTCUSDT - at CUT n REVERSE AREA ? Holds or not??#BTCUSDT.. market just reached near to his ultimate aea that is around 104300
keep close that area because should holds above that if there is further buying scnerios.
otherwise below that not at all.
good luck
trade wisely
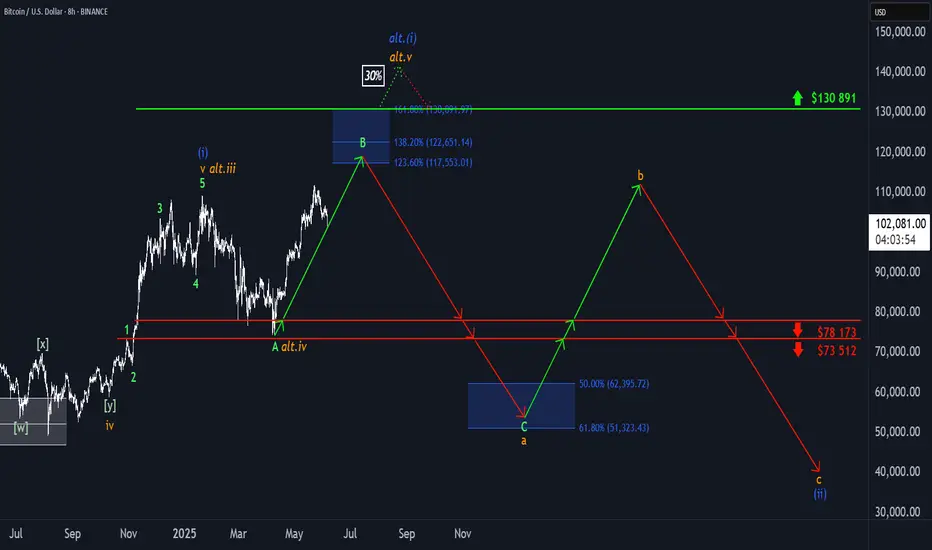
BTC: Facing Resistance?Bitcoin recently encountered renewed selling pressure, stalling the anticipated continuation of green wave B. Under the primary scenario, this corrective upward movement should still extend into the upper blue Target Zone between $117,553 and $130,891, where the price is expected to reverse and initiate green wave C. That move should complete with a low in the lower blue Target Zone between $62,395 and $51,323, thereby finalizing orange wave a. Following a corrective advance in wave b, the larger wave (ii) should reach its conclusion. There remains a 30% probability for the alternative scenario, in which BTC pushes above the upper blue Target Zone, establishing a new high in blue wave alt.(i)— which would delay the expected pullback.
📈 Over 190 precise analyses, clear entry points, and defined Target Zones - that's what we do.
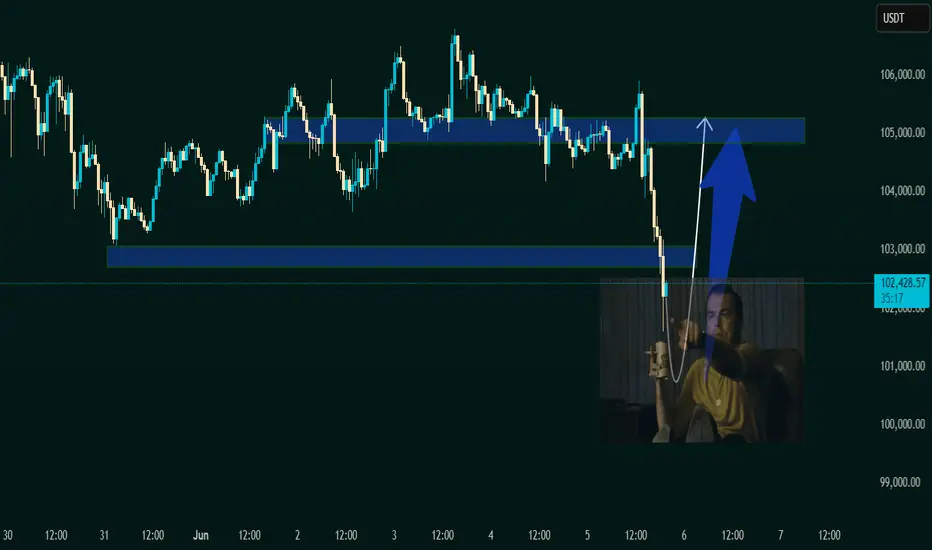
"Caught the Dip – Next Stop: Resistance Zone 1. Current Price Action:
The asset has bounced off the demand zone around 101,500 – 102,000 USDT.
It is now trading at 102,204.56 USDT, indicating early signs of the expected bullish move.
A white curved arrow suggests a rounded bottom pattern, often signaling a bullish reversal.
2. Demand Zone (Support):
Remains the same as the previous chart: 101,500 – 102,500 USDT.
Price reacted exactly at this zone and is starting to move upward.
3. Supply Zone (Target Area):
Clearly marked at 104,800 – 105,500 USDT.
This is where the expected bullish move could face resistance or where traders might look to take profit (TP).
4. Visual Reinforcement:
The large blue arrow indicates strong bullish momentum is anticipated.
The meme (Leonardo DiCaprio pointing) emphasizes that the reversal is happening as previously predicted — likely for motivational or engagement purposes in a VIP group.
---
🧠 Technical Sentiment:
Bullish Bias confirmed: Price bounced exactly from the demand zone.
Momentum Shift is underway, as indicated by the reversal pattern.
A potential "Buy Confirmation" is in play with room to ride up to the 105K resistance zone.
---
🎯 VIP Trade Setup Recap:
Parameter Value
Entry Zone 101,500 – 102,000 USDT
Current Price 102,204.56 USDT
Target (TP) 105,000 – 105,500 USDT
Stop Loss (SL) Below 101,000 USDT
Bias Bullish / Reversal
---
📌 Suggested Title:
"Reversal In Motion – Ride to 105K 🎯🚀"
TOP10 Altcoins Ready To Move, Strong Growth Potential —CommentWe already went through part 1, session 1, of the TOP10 altcoins that were yet to move and this time we are going to go deeper. We will go deeper and we will do it better. We are going to be looking at altcoins that are ready to move but it all depends on you.
Are you in?
If you are then leave a comment now!
That's all you need to do.
Bitcoin is ready and bullish and ready to grow.
Bitcoin is hyper-bullish, as bullish as it gets because our strongest support ever wasn't even tested in the recent retrace which was a weak retrace because it only lasted a few days.
The altcoins are super good right now with a higher low and ready to grow, but, with tens of thousands of options, which ones will you go for?
In the first wave trading pairs in the cryptocurrency market grew between 100 and 300%. Check. Perfect prediction, but things are about to get better.
The next wave instead of being capped at 300% can go much higher, the lower end will also be higher and pairs will grow some 200-500%. Some will grow more of course and others will grow less but this is the average.
I will look at the pairs from the TOP65 altcoins by marketcap, and do some bonuses as well. Are you interested?
»»» If you are interested, leave a comment with "Share the TOP10 Altcoins READY Move" and if there is enough interactions I will do this post for you.
So, which one is your favorite altcoin right now, the one that you think is ready to grow?
I'll see you in the comments section...
Thanks a lot for your continued support.
The altcoins market is starting to heat up.
Namaste.

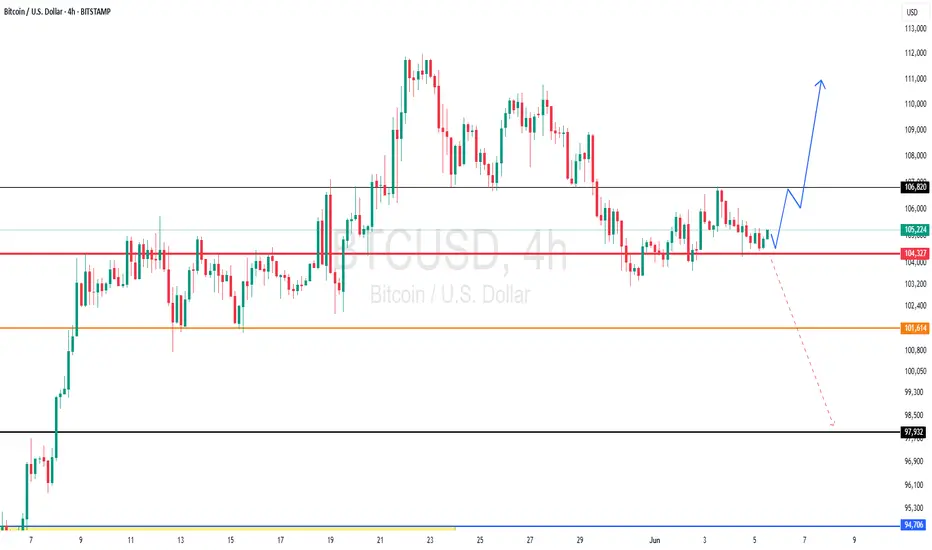
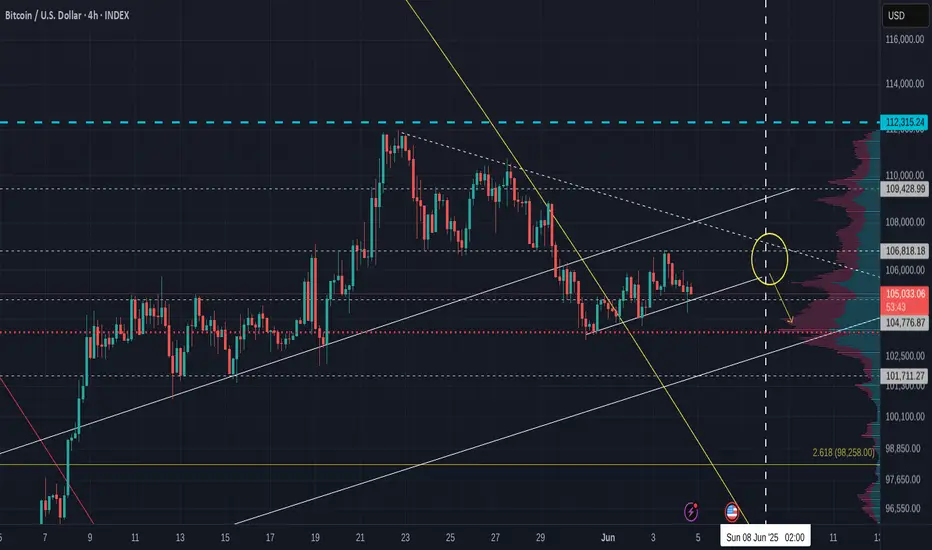
Bitcoin 4 hour update and longer term outlook for next 5 days
Bitcoin is in a Rising channel after dropping.
This can be easily called a BEAR FLAG and it needs to be paid attention to for a number of reasons.
The line of support that held PA up in May is now close overhead resistance and we are climbing towards an apex around 11 June.
PA always reacts before APEX
I would expect this to happen from the 8th June but could obviously happen before.
I can see PA dropping to around 102K, on the POC ( red dotts ) off the VRVP
We will have to see what happens form there but there is a strong line of support just below this.
The 4 hour MACD is currently being rejected from Neutral back down into oversold.
The Daily MACD is continuing to fall Bearish and will reach neutral bu the weekend, the 7th
This could be the beginning of a longer term Bearish move and could end up back in the mid 95K before it finishes over the next 8 weeks
HOWEVER, PA does have the ability to turn the tables on the newly woken Bears
We will have to take this a step at a time right now.
But as emtioned in apost earlier today, I do expect us to NOT move to much higher in the near future but more to range once again, maybe for up to 8 - 10 Weeks
We shall see and watching the Dominance chars right now is a VERY good idea
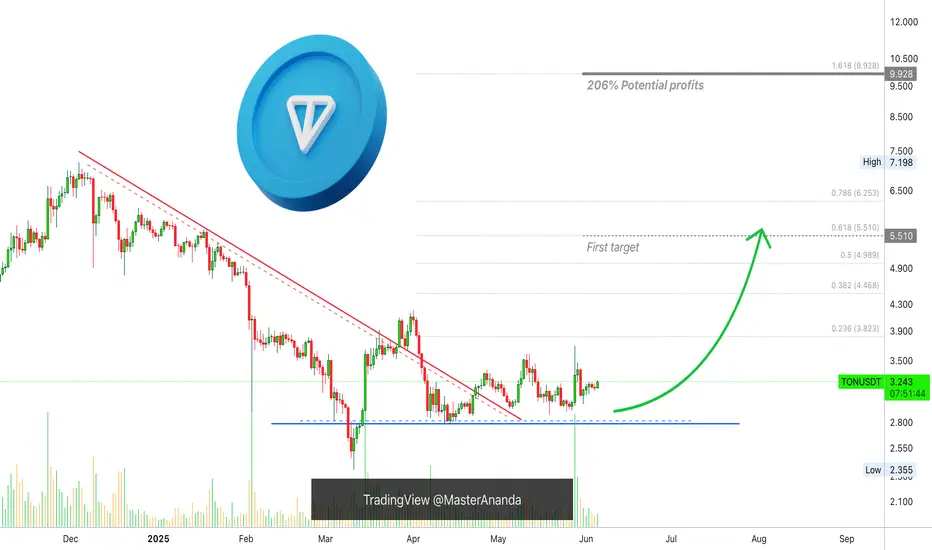
Toncoin Major Advance Now! New All-Time High Incoming (PP: 200%)Toncoin entered its current price range in February, four months ago. After some shaking, this project has been sideways and four months sideways is a very long time when it comes to Crypto, there is good news of course.
When the drop happened in March a bottom pattern was confirmed. A bottom means the bearish trend ends and the market prepares to change.
Just a few days ago, TONUSDT produced really high volume, signaling the start of a new uptrend, higher highs and higher lows.
This post is a friendly reminder just to let you know that Toncoin is about to go up and it will de so really strong.
The signals are in. Consolidation has been strong. The action is happening above support.
An advance now will be strong first, then fast, then slow followed by additional growth. I mean, the bullish action won't stop at $5.51 nor $10 ($9.92), it will continue growing, growth long-term. We are set to experience a new all-time high, the strongest bullish action in the history of Toncoin, it is starting now.
Thank you for reading.
Namaste.
TradeCityPro | Bitcoin Daily Analysis #108👋 Welcome to TradeCity Pro!
Let’s dive into the analysis of Bitcoin and key crypto indices. As usual, in this analysis, I’ll review the futures session triggers for New York.
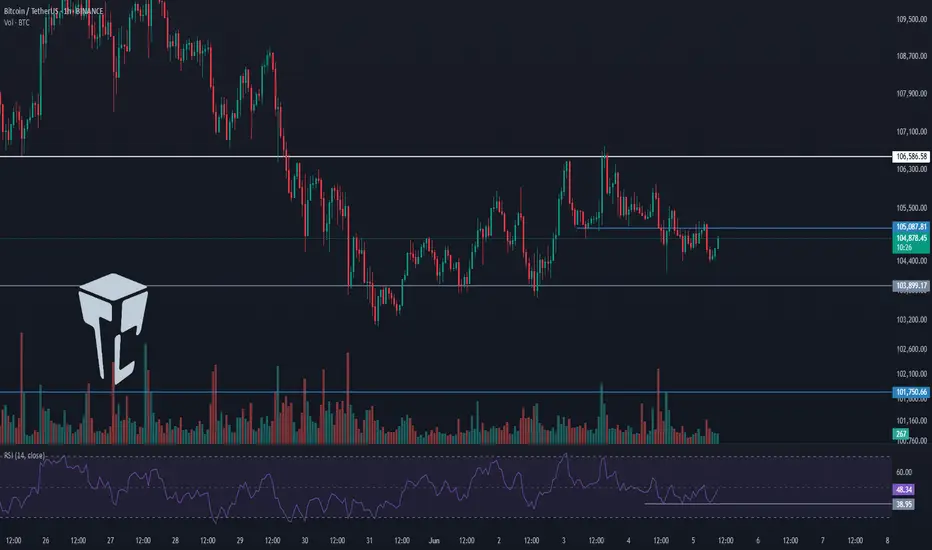
⏳ 1-Hour Timeframe
As you can see in the 1-hour timeframe, yesterday the 105087 trigger was activated, and now after a pullback to that level, the price is heading toward the 103899 support.
💥 If you entered a short position based on the 105087 trigger, you can hold it until 103899. If you haven’t opened a position yet, you can consider today’s triggers.
🔽 The first short trigger for today is the 103899 level. A break below this level can start a major bearish move. Personally, I’ll enter a short if this level breaks.
⚡️ Breaking below 38.95 on the RSI will give us a suitable momentum confirmation. If selling volume increases, the probability of a bearish move will rise.
📈 For long positions, our first trigger is the same 105087 level. If a higher low is formed compared to 103899 and this level breaks, it will provide a good long opportunity.
💫 The main long trigger is 106586. If this level is broken, the uptrend can resume and price could move toward higher resistance levels.
👑 BTC.D Analysis
Looking at Bitcoin Dominance, a range box has formed between 63.93 and 64.23.
✨ A break above 64.23 confirms bullish continuation, while a break below 63.93 confirms a bearish trend in dominance.
📅 Total2 Analysis
Moving to Total2, yesterday it closed below 1.17, and now after a pullback, it's heading toward 1.16.
✅ If 1.16 breaks, a short position can be opened. If the downward move turns out to be fake, a break above 1.18 gives us a long trigger.
📅 USDT.D Analysis
Looking at Tether Dominance, yesterday it confirmed above 4.70 and is now moving toward 4.79. A break of 4.79 could signal a continuation of the upward move.
📊 If it closes back below 4.70, the price could move toward 4.64. A break below 4.64 would signal a bearish trend in USDT dominance.
❌ Disclaimer ❌
Trading futures is highly risky and dangerous. If you're not an expert, these triggers may not be suitable for you. You should first learn risk and capital management. You can also use the educational content from this channel.
Finally, these triggers reflect my personal opinions on price action, and the market may move completely against this analysis. So, do your own research before opening any position.
ETH Weekly – Signs Aligning for a Long Setup
ETH is forming subtle higher lows above the 0.5 Fibonacci level and the 200MA—both sitting near the same key support zone.
The 50MA is currently acting as resistance, but structurally we’re seeing MLR > SMA > BB center, and the PSAR flipped bullish since the week of May 12.
We now have all the signals needed for a valid long entry on this timeframe.
Feel free to drop your thoughts in the comments—good or bad, all engagement is appreciated.
Take profits. Manage risk. Stay sharp.
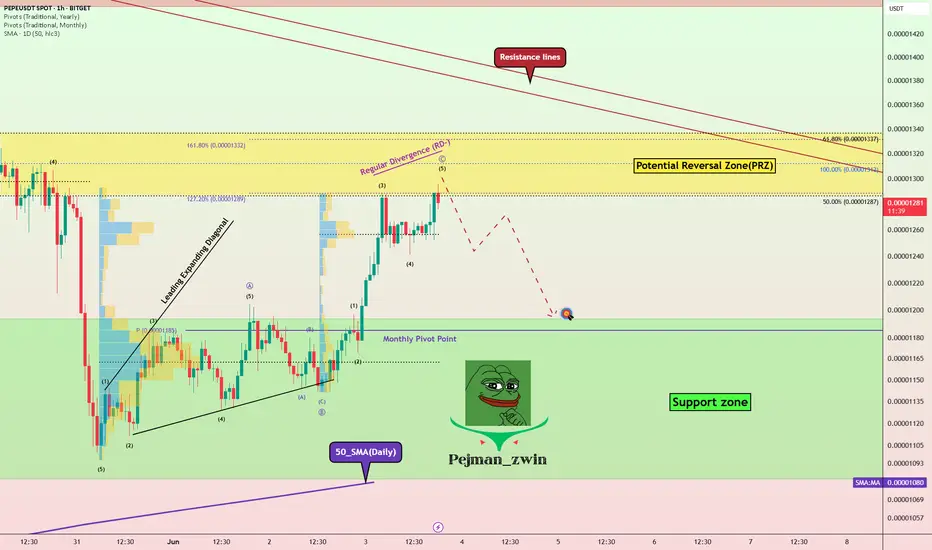
PEPE at Key Reversal Zone — Support Test Coming Soon?Today I want to look at the PEPE token ( BINANCE:PEPEUSDT ), which is part of the memecoin category, and provide you with a short-term analysis on the 1-hour timeframe .
PEPE token is trading in Potential Reversal Zone(PRZ) .
In terms of Elliott wave theory , the PEPE token appears to be completing the microwave 5 of the main wave C . The structure is a Zigzag Correction(ABC/5-3-5) .
Also, we can see the Regular Divergence(RD-) between Consecutive Peaks .
I expect the PEPE token to attack the Support zone($0.0000120-$0.0000108) after completing the main wave C .
Note: Stop Loss = $0.0000362
Please respect each other's ideas and express them politely if you agree or disagree.
Pepe Analyze (PEPEUSDT), 1-hour time frame.
Be sure to follow the updated ideas.
Do not forget to put a Stop loss for your positions (For every position you want to open).
Please follow your strategy and updates; this is just my Idea, and I will gladly see your ideas in this post.
Please do not forget the ✅' like '✅ button 🙏😊 & Share it with your friends; thanks, and Trade safe.
TradeCityPro | ALGO: Bearish Pressure Builds Near Key Support👋 Welcome to TradeCity Pro!
In this analysis, I’m going to review the ALGO coin for you. The Algorand project is one of the Layer 1 and RWA projects.
⚡️ The coin, with the ticker ALGO, currently holds a market cap of $1.63 billion and ranks 53rd on CoinMarketCap.
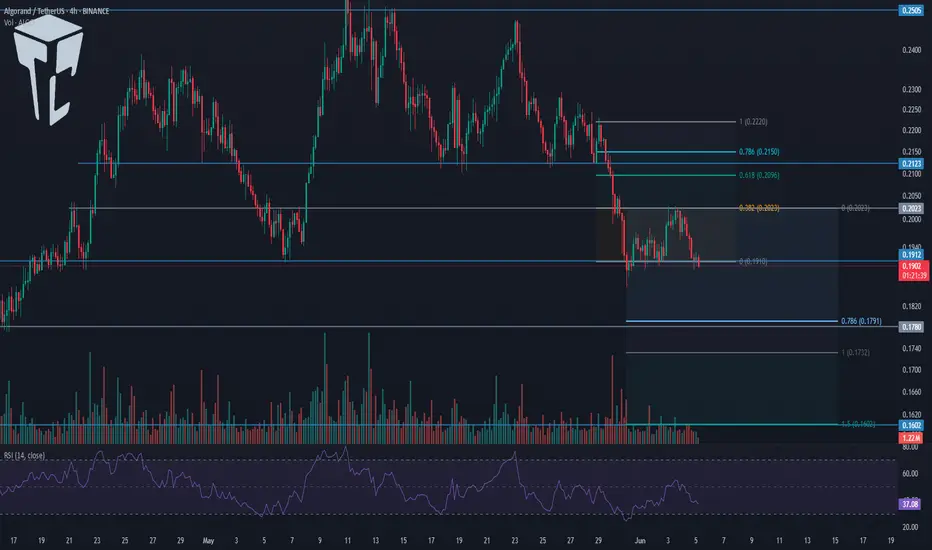
⏳ 4-Hour Timeframe
As you can see in the 4-hour timeframe, after the price reached the 0.2505 resistance level, a bearish phase began, and with the breakdown of the 0.2123 level, the first bearish leg extended down to 0.1912.
✔️ After this drop, the price retraced up to the 0.382 Fibonacci level and now has returned to the 0.1912 zone. Given the strong bearish momentum in the market, the probability of breaking this level is quite high.
✨ If 0.1912 is broken, the extension wave could begin. According to Fibonacci projections, the targets for this position are 0.1780, 0.1732, and 0.1602.
💥 An entry of RSI into the Oversold zone would serve as a very strong momentum confirmation for this position. If that happens, the price may reach the 0.1602 target.
📊 Volume also plays a key role. Currently, the selling volume isn’t very strong, which might result in a fake breakout of 0.1912. I suggest waiting to see whether sell volume increases, because without volume, price movement is unlikely.
📈 For a long position, the first trigger we currently have is the 0.2023 level, which is a significant high and overlaps with the 0.382 Fibonacci retracement level. Breaking this level could resume the long-term bullish trend.
💫 The momentum confirmation for a long position would be the RSI breaking above the 50 level. A breakout here could kick off a bullish trend in the higher timeframes.
📝 Final Thoughts
This analysis reflects our opinions and is not financial advice.
Share your thoughts in the comments, and don’t forget to share this analysis with your friends! ❤️
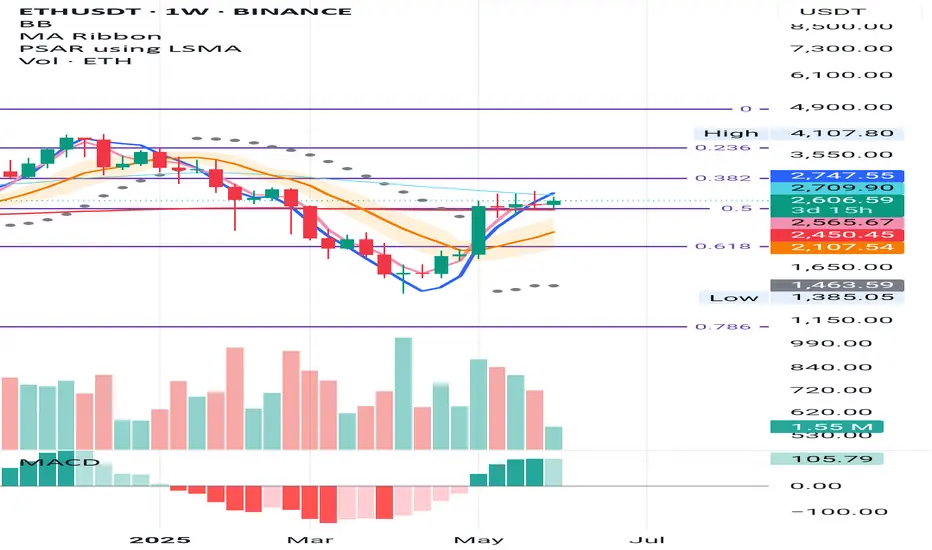
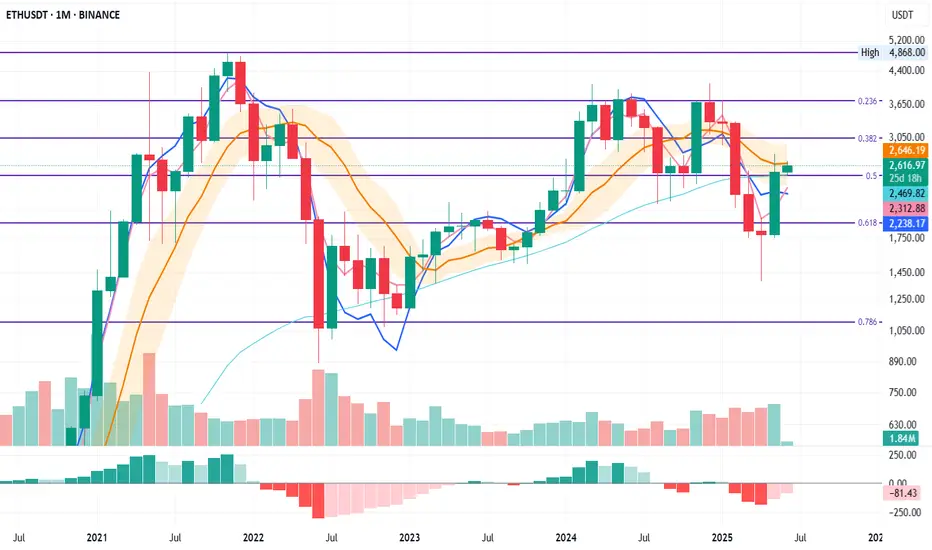
ETH Monthly – Fibonacci Structure in Play
ETH has been respecting the monthly Fibonacci levels with surprising precision.
There was a clear double top at the 0.236 Fib in May and November 2024, with a base forming at the 0.5 Fib. That same 0.5 Fib now acts as support, aligned with the 50MA.
The BB centre is currently stopping price, but for how long remains to be seen.
SMA is above MLR and rising, which supports a bullish bias.
If this structure holds, the next resistance zones may align with the higher Fib levels.
Feel free to drop your thoughts in the comments—good or bad, all engagement is appreciated.
Take profits. Manage risk. Stay sharp.
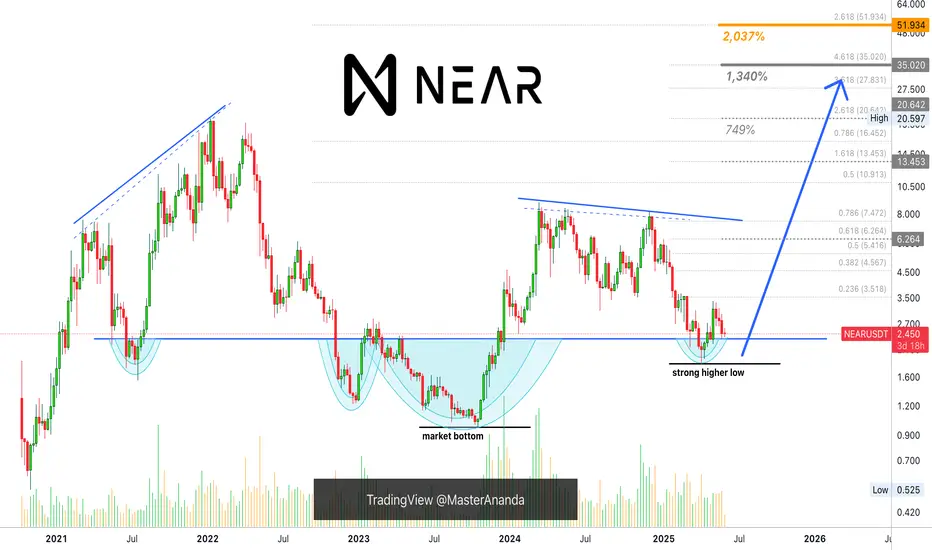
NEAR Protocol Can Hit $35 or $52 in 2025 (PP: 2,000%+)Back to what I was doing... NEAR Protocol (NEARUSDT) closed red three weeks and this week is the fourth week with the action being bearish, why am I bullish?
Four weeks of bearish action and there isn't much, well, bearish action. Total drop is less than 30%. If you look back to January, or say May 2022, four weeks red would be something completely different; market conditions are not the same.
The market now is not bearish nor crashing so we are only seeing a retrace, a retrace is a small correction that ends in a higher low. Wait, let me make a long story short, NEAR Protocol is set to grow.
The market bottom in October 2023 is much, much lower compared to the low hit April 2025, much lower. So we have a very, very strong higher low. This only reveals something we already know, NEAR is bullish and bullish means up. Prepare for growth. The 2025 targets can be seen on the chart.
» How likely is a new all-time high in 2025?
Probabilities are really, really high. NEAR Protocol has a very strong chart that points to a long-term higher high next. The ath being $20, it can easily go higher thanks to the strong higher low mentioned above.
» How long will it take for this new ath to be hit?
Can be anywhere between 4-8 months. I know it is a wide range but with thousands of altcoins, some will move first while others will take longer to reach their bull market top. But late 2025 is the main date and some altcoins will continue bullish through early 2026.
Yes, this pair can be approached with leverage.
Low leverage is better. Low risk is better. Spot is best.
Thanks a lot for your continued support.
Namaste.
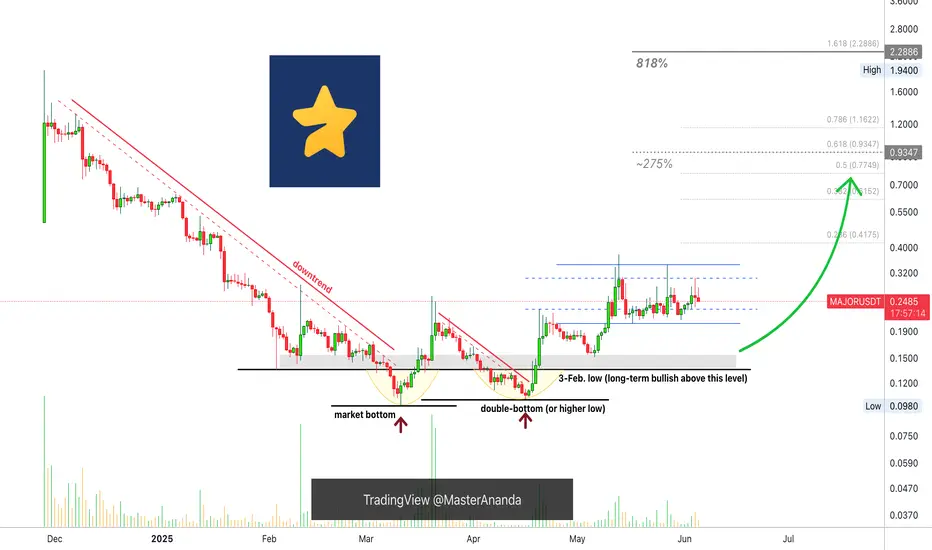
Major Enters Bullish Zone, 800%+ Profits Potential MappedSo this is a game on the TON network. It is good you called this to my attention because I love games. I don't play them but I love them, I think these are good for the Cryptocurrency market.
We are looking at MAJORUSDT, thank you for taking the time to read.
It is my pleasure to write for you and I am always grateful for your continued support... Let's read the chart.
There is high volume on the chart, twice. After 3-February and after mid-March. In both instances the high volume happened on green candles. It is an early reversal signal.
MAJORUSDT was moving down, a downtrend; this is when the candles were producing lower highs and lower lows. 11-March 2025 comes the bottom and the downtrend ends. The end of the downtrend is good news, this market is no longer bearish, it goes from bearish to sideways.
The initial recovery, small, peaks 20-March after 165% growth. Then comes the first retrace and the pair is bullish and strong because it ends in a higher low. 7-April of course, when the entire altcoins market bottomed. This higher low is a technical double-bottom. From this point on, instead of the initial breakout and sideways, we have the start of a bullish wave.
MAJORUSDT starts to grow and now it is up. Current action is happening 153% higher compared to March low, the market bottom.
After some higher highs and higher lows, MAJORUSDT is now sideways again, consolidating but this time bullish, building strength before the next bullish jump. So we can expect some more sideways, with some swings followed by additional growth. You can find two nice targets on the chart.
» The first target sits at $0.9347 for 275% profits potential, the second goes beyond 800%.
I love you.
Thanks a lot.
Your support is appreciated.
Namaste.
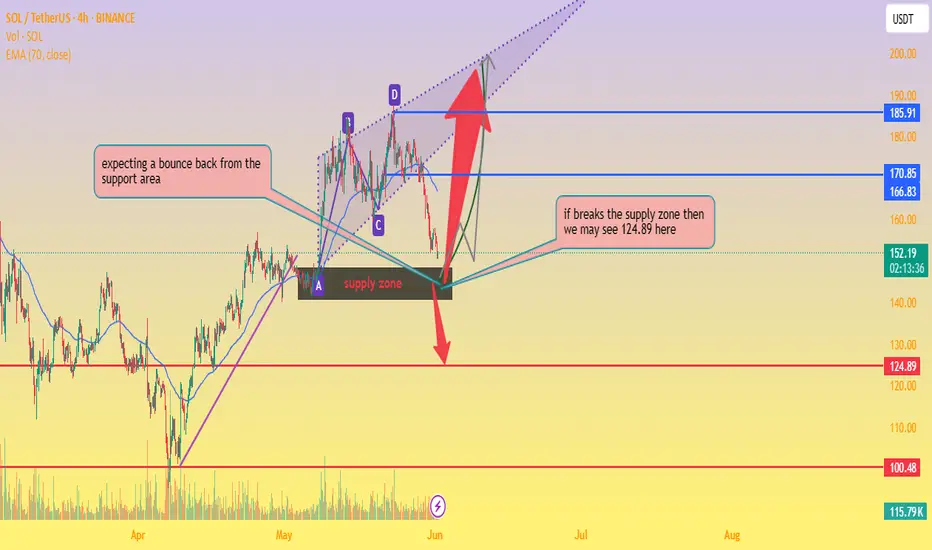
SOL/USDT Key Reversal Zone – Bounce or Breakdown?📊 Chart Analysis:
Current Price: $151.91
EMA 70 (Dynamic Resistance): $166.82
Support Area: Around $150, overlapping with a key supply zone.
Chart Pattern: Harmonic/ABCD structure completing near support.
🧠 Observations:
Price is testing a strong support/supply zone.
📦 If bounce occurs, potential targets:
🎯 First Target: $170.85
🎯 Second Target: $185.91
📉 If support breaks, then:
⚠️ Target: $124.89
📉 Next Major Support: $100.48
🧭 Trade Plan:
🔹 Long Entry (on bullish confirmation):
Entry: $152–$155
SL: Below $149
TP1: $170.85 🎯
TP2: $200 🚀
🔹 Short Entry (on breakdown confirmation):
Entry: Below $148
SL: Above $153
TP: $124.89 🧨
support and drop down your thoughts about it thanks
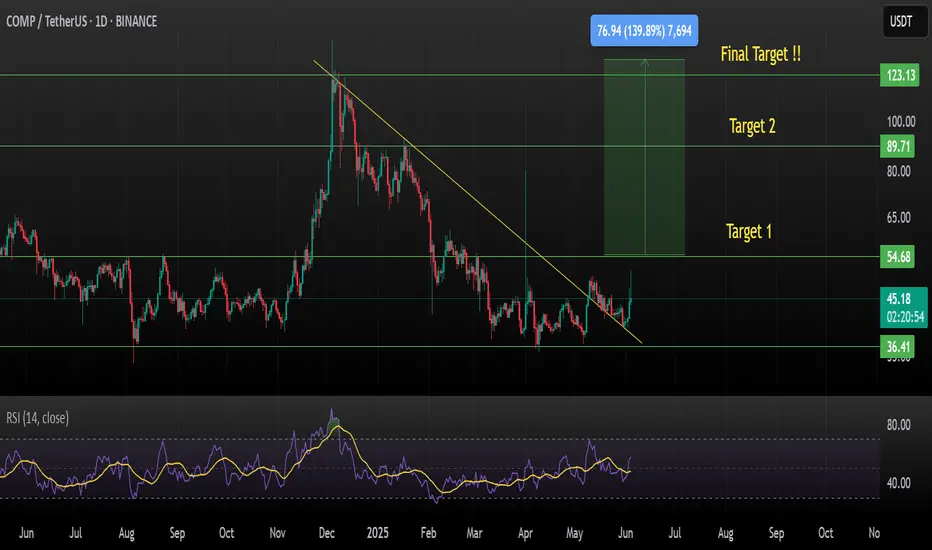
COMP/USDT Breakout Alert !!COMPUSDT has broken out of a long-term downtrend line on the daily timeframe, signaling a potential bullish reversal.
Chart Analysis:
Downtrend line broken with a strong bullish candle
RSI recovering to 57.28 — showing improving momentum
Price holding above local support near $36.41
Key Levels:
Support: $36.41
Resistance Levels / Targets:
Target 1: $54.68
Target 2: $89.71
Final Target: $123.13
Bias: Bullish — as long as price sustains above the downtrend line and holds support
Timeframe: 1D
Strategy: Watch for retest of breakout zone ($43–$45) as potential entry, with targets as mentioned.
This is not financial advice, please research before investing, as we are not responsible for any of your losses or profits.
Please like, share, and comment on this idea if you liked it.
#COMPUSDT #CryptoTrading #TechnicalAnalysis #Altcoins #Breakout #BullishSetup
If price doesn’t break you, it’s building you.ETH has been printing higher-timeframe indecision — but within that noise, the structure is crystal clear. We're trading between two OBs. That’s not chaos. That’s preparation.
Here’s the map:
Price has respected the lower OB multiple times — but has yet to displace from it
There’s a clean FVG below, untouched — it’s the draw if this OB fails
To the upside: upper OB is where the game flips — either distribution or continuation
Until then, this is a defined range between intent and indecision
Execution here isn’t about speed — it’s about patience.
How I’m positioning:
A break and close below the OB = short into the FVG at ~2469
If price instead consolidates here and pushes up, I’ll wait for rejection at the upper OB for a reversal short
Only if we displace through the top OB and hold it, do I flip bias back to longs
This isn’t the time to guess. It’s time to observe. Let price do the heavy lifting — your job is to interpret.
More like this — structure-driven setups with real intent — are detailed in the profile description.

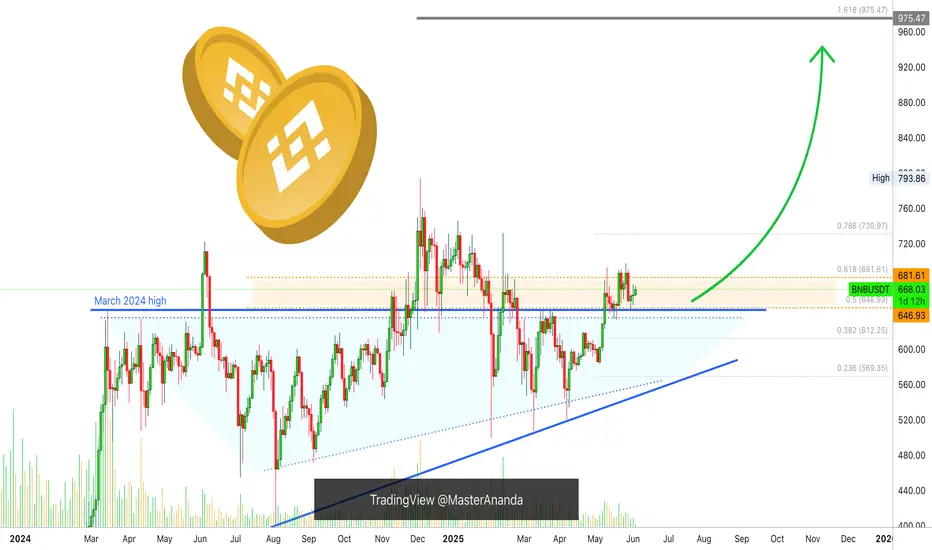
Binance Coin Consolidation Bearish or Bullish? $975 TargetThat's the question I am about to answer.
The action is happening above the March 2024 high. Binance Coin's current consolidation is considered bullish because it is happening above this level. There is also a series of higher lows since 2-Feb. 2025. There has been a strong recovery in the last four months.
The fact that the recovery is slow and extended gives it strength.
The action is sandwiched between 0.5 and 0.618 Fib. extension levels. These two levels work as immediate resistance and support.
Bullish patterns and signals are present all across this chart.
» BNBUSDT is bullish. Next strong target and new all-time high will be $975.
Thank you for reading.
Namaste.
Bitcoin-is that it for now ? Lazy summer, take off in September?
Not posted this chart for a while but we may find it has become Very relevant to what to expect for the next few months
First thing to note is that PA is once again in TOP of range box and ALSO got rejected off the Long Term Blue line that has rejected BTC PA ATH since 2017. This also coincidened with the 1.618 Fib Extension.
Rejection here was highly likely and given how PA had pushed up, it is not surprising to see PA at least taking a breath.
For me, even though we do have the ability to push higher, I am not to sure we will just yet.
The weekly MACD could offer some credence to this idea
The Arrow points to an area that could turn out to be similar to what we are doing now.
The MACD has begun curling over after a prolonged push higher. While There was strength left, PA took a breath and regrouped.
The Chart below shows this period and how BTC PA reacted...and is circled
This was in Dec 2023 to Jan 2024.
PA had just had a sustained push higher and needed a break.and following a 7 week range, PA moved up another 67%
7 weeks from now brings us to near August.
There are charts that point towards a move in August / September
Here is another chart that offers some confluence to this idea.
The Dotted line is a line of support that PA has used as support numerous times this cycle and currently, is almost bang on the 50 SMA. Assuming that PA goes back down to that and bounces again, a 67% rise takes us back up to the Top of Range
Should we drop that far, to the 50 SMA again, we are in the 92K - 95K zone, scaring a LOT of people, wrecking Leverged players and putting Fear everywhere.
PERFECT FOR BUYING
This area also happens to be the 1.382 Fib extension on the main chart, the next Major line of support below us currently.
Should we fall through that, we reach the Bottom of Range and the intersection with the 50 SMA in.......August
So, we have to wait and see. We can push higher now but to do so would require breaking through that long term Blue line of resistance. I am not sure we can do that just yet.
Also, Should we post a RED June candle, Even a small one, the ideas in the Monthly candle post I recently posted also back up the idea of a lazy summer...... and a move higher around Mid to late August
Stay safe
