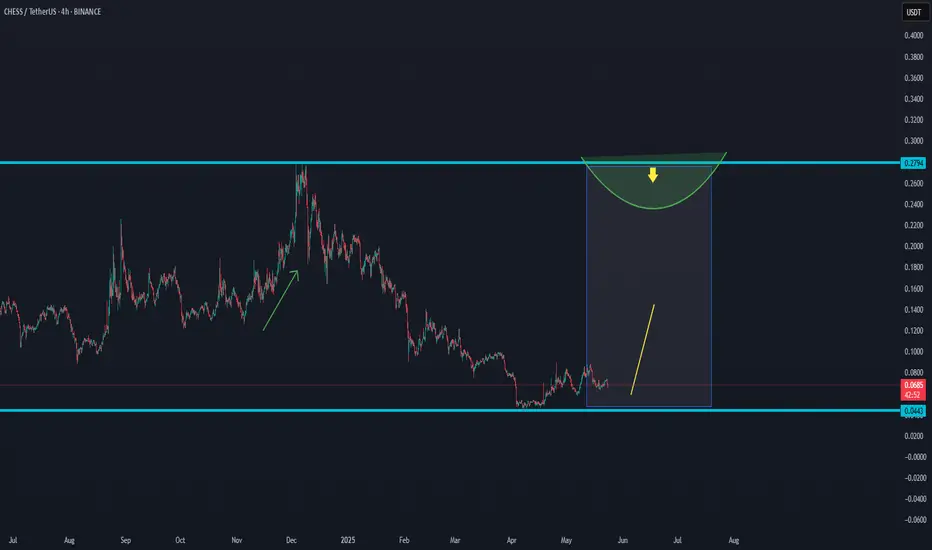
CHESS.USDT NEW INCREASE ROUNDEAs a trader, it's important to follow the market and the unexpected trends.
CHESS/USDT shows a possibility for a new increase in the coming time frames, after the long-term breakdown.
Let's follow the data and see if this coin is able to increase as the chart shows.
interesting to follow for the coming time frames for new confirmations.
$0,10 is an important target that this coin could hit in the coming time.
If the cycle gets confirmed, this coin could go to $0,25 as a high target and $0,35 as a best target.
In trading, never expect instant results; the market goes as it needs to go.
Risk management is the key.
Cryptomarket
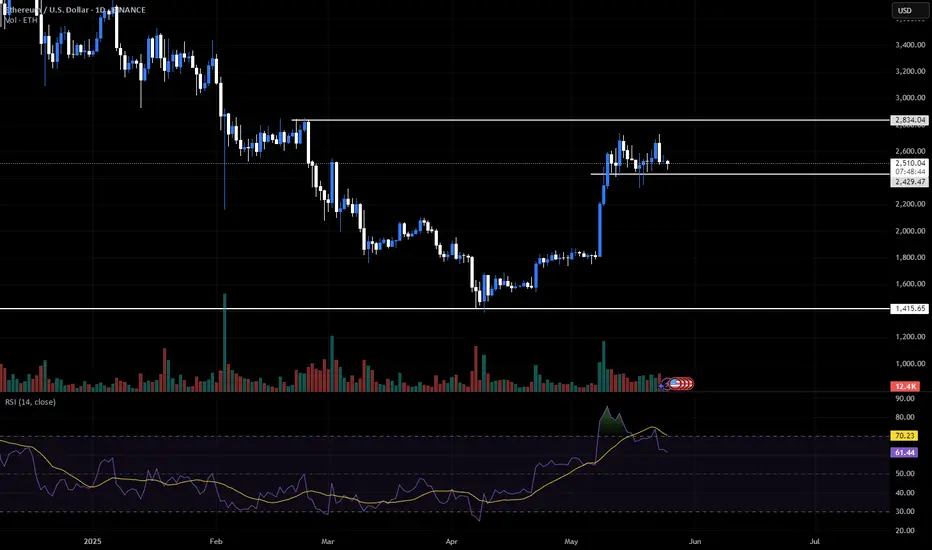
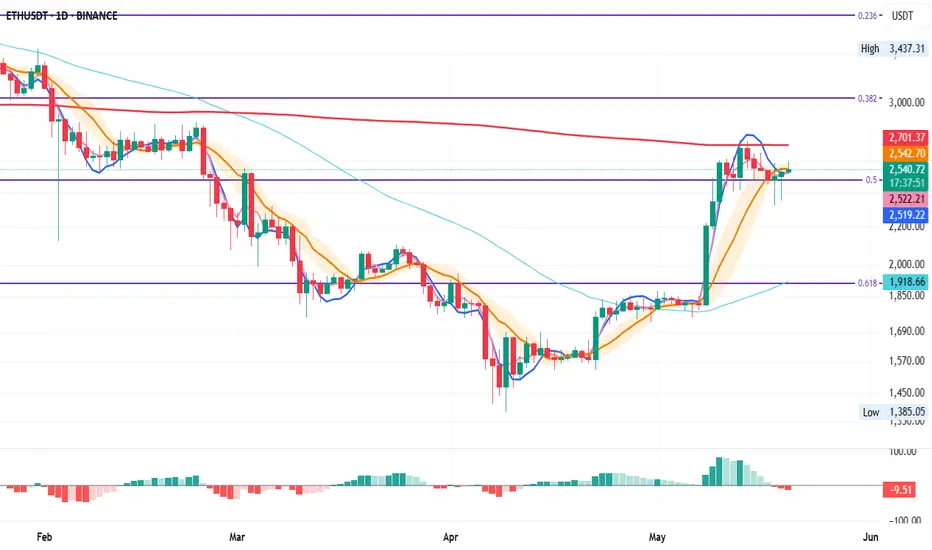
ETH Update — RSI Divergence & Double Top FormingEthereum is showing a clear RSI divergence paired with a developing double top, making this a key area to manage risk.
I’ve personally taken profit on my longs and am watching how price reacts in this range.
- Next resistance: $2,840
- Key support: $2,200
Right now, I don’t like the risk-to-reward of holding. There’s more downside exposure than upside potential from this level — at least until structure confirms otherwise.
BTC Hits ATH Time But Dont Let Euphoria Ruin Your PerceptionBitcoin has pushed into new all-time highs and is now testing the same resistance zone we saw back in December–January. While the breakout is technically impressive, price is stalling at the exact level where strong sell pressure previously kicked in.
Today’s weekly close is a key confirmation point. But the bigger issue? Next week is stacked with macro volatility — PPI, FOMC, and other data drops that could rattle risk-on assets.
⚠️ What I’m Seeing:
- Weekly RSI divergence continues to build
- Volume is drying up, not confirming the move
- Macro pressure is incoming — timing matters
🧠 My Bias:
I wouldn’t be surprised by a final liquidity grab into the $120K–125K range — enough to trap late longs and generate downside liquidity.
Personally, I’m de-risking. Not shorting yet — just locking in some gains.
Ask yourself: Are those extra 10% upside gains worth the risk of giving back 30%-50%?
Not calling tops. Just following structure.
Always open to opposing views — discussion sharpens conviction.
Don’t let euphoria cloud your perception.
📉 Stay safe out there.

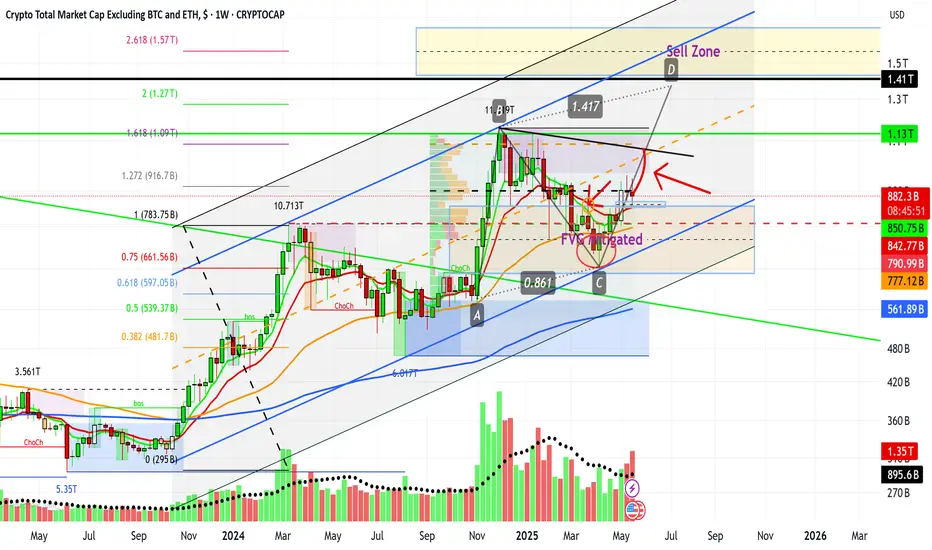
Total3 Crypto Market CapWe know very well that Trump, at the moment, is able to move markets overnight. We also know well that such a market is difficult to navigate.
Nevertheless, we do have chart indications, as in this case:
- volatility, money inflow and others are in the middle.
- on the weekly, Total3 has bounced from the underlying structure, which may signify strength.
- the candle resting on the weekly FVG will be closed later.
- the indicators look good but not too good. Based on some altcoins (weekly), I see hope there.
- gray and delicate situation.
- best strategy: scalp, small profits, buy the dip and hold. Little or no leverage. Don't get hurt.
I will update to keep you posted on developments.
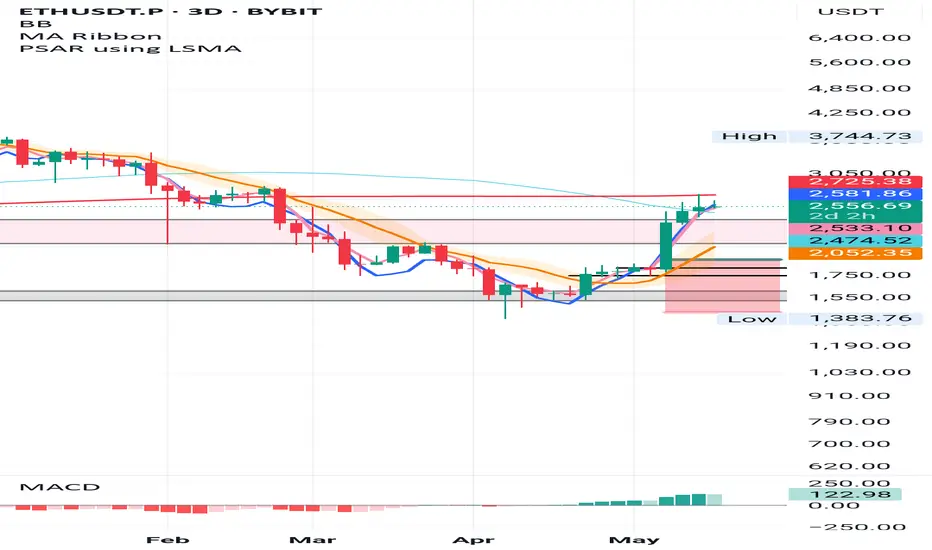
ETH 3D – System Trigger, 200MA Test & Death Cross Insight
This was the actual trigger for my ETH long.
The system gave the green light on 3D:
✅ PSAR flip
✅ MLR > SMA > BB center
Now ETH is testing the 200MA from below, which lines up with the 50/200 death cross — often seen as bearish, but here it likely confirms the bottom already built through March–April.
MACD is pushing up strong.
The signal came from this chart — and I'm still in the move.
ETH Update: Pressed Between Key Levels on the Daily
ETH is currently pressed between the 200MA and the 50% Fibonacci level—two major areas of interest.
On May 14th, we saw a clear rejection at the 200MA, followed by solid support at the 50% Fib on May 18th-19th. 📉
MLR < SMA < BB Center isn't ideal, so we need to play it safe and let price do its thing. If we close above the BB Center and macro conditions support the move, we could see upside. 🌱
⚠️ Keep safe, follow for unbiased TA, and always manage risk! 📊
OTHERS 200MA – Next Attempt: If and When?
On the Others daily chart, there’s a formed inverse head and shoulders. The base of the formation acted as support during the last drop after rejection from the 200MA.
Now, price is attempting to push through the BB center, with SMA and MLR helping from underneath. Additionally, there’s a clear ascending trendline that continues to act as dynamic support.
Only price action will confirm the next move toward the 200MA.
Posts come from time to time—interactions help with visibility.
Manage risk—it’s the only constant

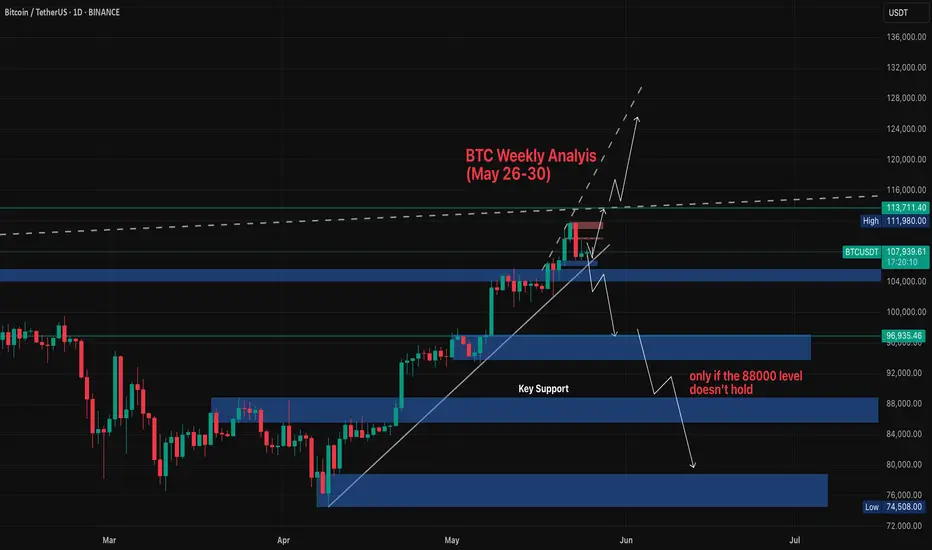
Weekly Analysis for BTC (May 26–30)BTC played out clean last week. Broke above 108k, tapped a new ATH at 110.5k, and pulled back slightly. Structure still bullish — 4H HLs holding strong and 107k retest held nicely into weekend close.
Key level to watch is 110k. If we break that with momentum, price can push to 115k or even 120.7k based on fibs and hype continuation. If we reject again, we might pull back to 107k or 100k — still a buy zone unless 88k breaks.
On the macro side, confluence is heavy:
– ETFs still driving big money inflow
– US debt growing after Trump’s new tax bill
– Moody’s downgrade adds more pressure
– Geopolitical tensions + safe-haven flow also helping BTC hold strength
– Holiday week in the US (Memorial Day), so volume might be low — fakeouts possible if liquidity dries up
Best zones to watch this week:
🔸 110k breakout for continuation
🔸 107k and 100k pullback buys
🔸 110.5k ATH for possible rejection scalps
As long as 88k holds, structure is clean. Bias remains bullish with both TA and macro pointing up.
Will be posting more detial daily anaylsis. follow for more updates. Or check out Streefree_trade IG.
PENGU 12H – System Entry Triggered
PENGU just gave a system entry on the 12H time frame.
📌 The black line represents entry points from the 3D and 1W time frames. It has acted as a key level in the past and has now been flipped into support again.
📈 Price is currently pushing into the pink box, which may act as short-term resistance. Keep an eye on how long it takes to break through this zone—if it lingers too long, we might see a temporary rejection.
🟢 OBV is rising
🟢 MACD is turning bullish
🟢 Fundamentals look very strong
I believe PENGU still has upside potential from here.
✅ Stick to the system—no guessing tops. Let price action guide the decisions.

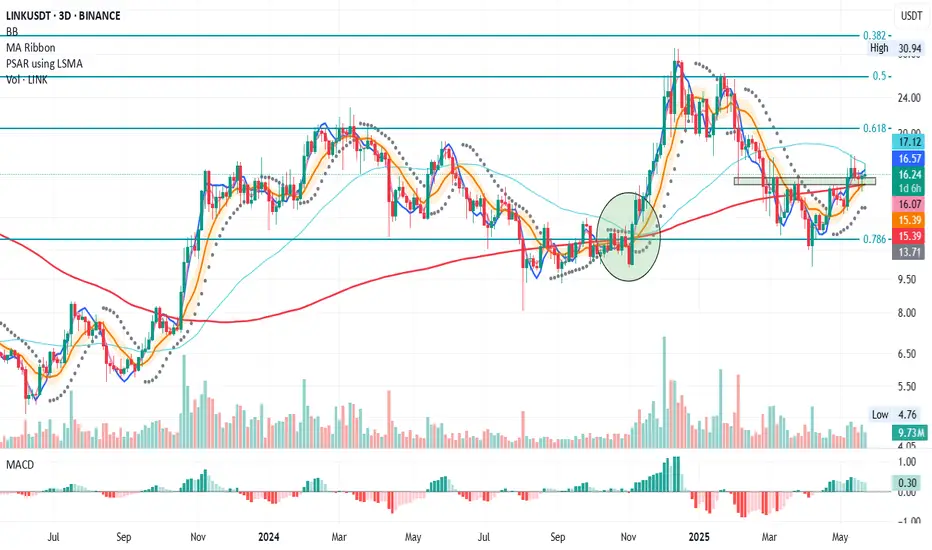
LINK 3D – Watching the 50MA Reclaim
After a clear rejection at the 200MA on April 25, LINK is now trading above the 200MA, but has faced rejection at the 50MA.
The green zone represents a key support area that started forming on Feb 3.
✅ MLR > SMA > BB Center, confirming that the bullish structure remains intact.
🔍 Note how the BB center and SMA are now aligned. The last time this happened (see orange zone) was also after a drop, and the recovery only started after price reclaimed the 50MA.(see green circle)
Unless macro headwinds (e.g. tariff war escalation) drag the market down, the key level to watch is the 50MA. A close above it could mark the next leg up. 📈
Thanks for reading!
If you found this useful, give it a like or drop a comment.
Manage risk, take profits.
XRPXRP just created a Inversion FVG on the 1h timeframe, paired with a sweep of the Previous Day Lows, indicates a strong move upwards.
We should see a retest of Previous Day High at $2.36 which may lead to a test of a 4h FVG between $2.38 - $2.40.
If we get any big announcements this weekend, we may see run towards $3 heading into the week.
Have an exit strategy once we have our banana move, it's been a great journey.
LOCK IN.

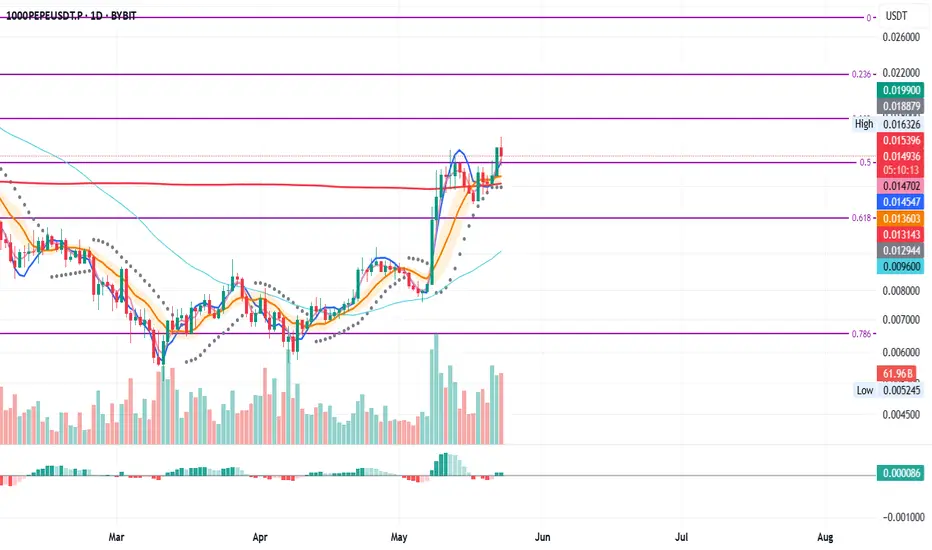
PEPE Daily – Testing Key Fib Support
After getting rejected at the 0.5 Fibonacci level on May 14, PEPE is now retesting it as support.
On the way down, price found support at the 200MA, even after briefly closing below it on the daily chart.
You could argue MLR > SMA, but both are still above the BB center and the 200MA, which maintains the overall bullish structure.
⚠️ Watch for a daily close below the 0.5 Fib—that would weaken the structure and could lead to further downside.
Look closer at smaller time frames.
Thanks for reading—if you found this engaging, react or comment.
Always manage risk and take profits. 📊
TradeCityPro | Bitcoin Daily Analysis #101👋 Welcome to TradeCity Pro!
Let’s dive into the analysis of Bitcoin and key crypto indices. As usual, I’ll go over the futures session triggers for the New York market.
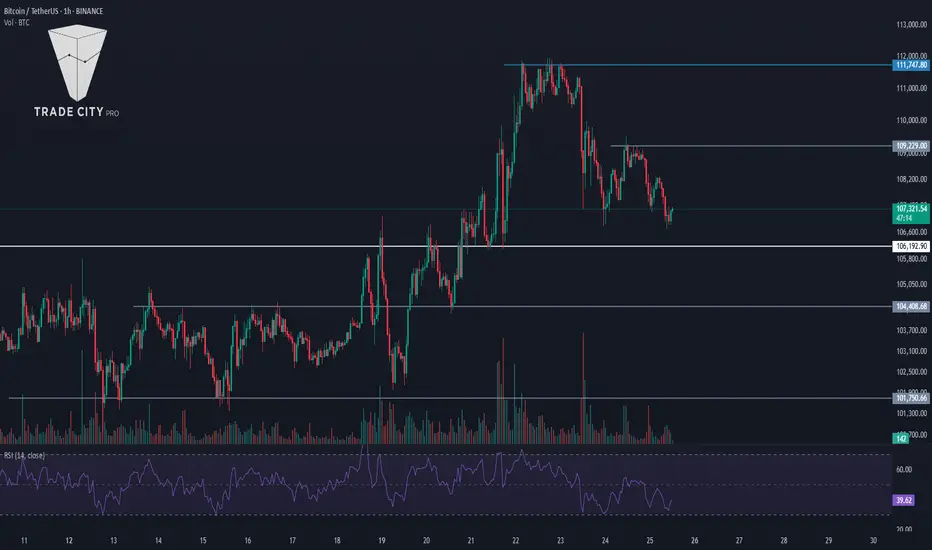
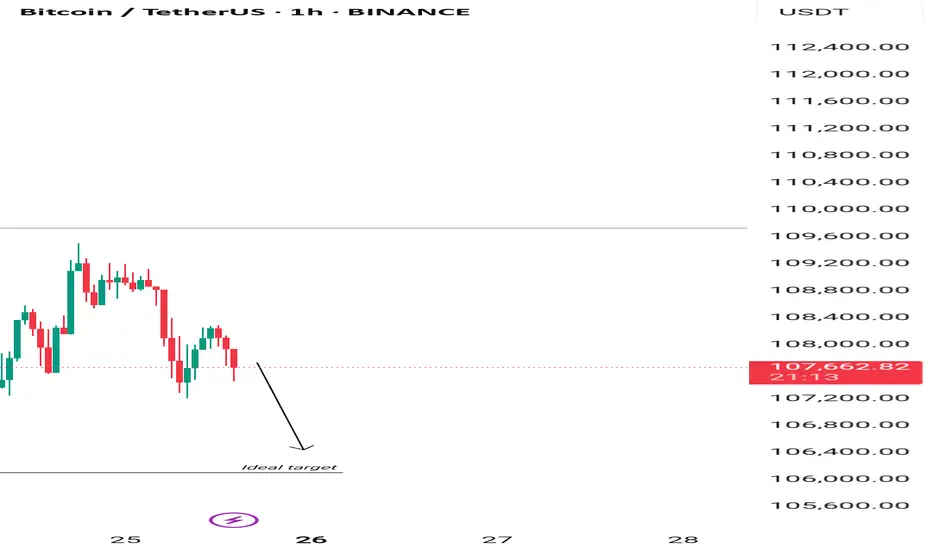
⏳ 1-Hour Timeframe
As you can see on the 1-hour chart, after Bitcoin reached the top at 111,747, the market entered a corrective phase and BTC has pulled back to around 106,192.
🔍 For now, I’m not adjusting the 106,192 level because it remains a very strong support zone. If the price reaches this level and shows a solid reaction, we can look for entry triggers on lower timeframes.
💥 Currently, the trigger for a long position is at 109,229. This level previously caused the price to make a lower low, so breaking it could inject strong bullish momentum into the market.
📈 The main long trigger is at 111,747. However, this level is a strong supply zone and won’t be easy to break, so trading this level will be challenging.
📊 On the bearish side, we’re watching the RSI oscillator for a potential entry into the oversold zone. If RSI enters oversold territory, strong bearish momentum may follow and increase the chance of breaking below 106,192.
👑 BTC.D Analysis
After a retracement to the 63.50 level, BTC dominance has initiated a new bullish leg, reaching up to 64.32.
⭐ If 64.32 is broken, it confirms further upside toward 64.63. Conversely, if 63.97 breaks, we get confirmation of bearish momentum returning.
📅 Total2 Analysis
Total2 is currently forming a descending triangle after being rejected from 1.26T. Price is hovering around the 1.18T support.
⚡️ If 1.18T breaks, we could see a drop toward 1.15T. For a bullish breakout, we need to see a break of the trendline and activation of the 1.22T trigger.
📅 USDT.D Analysis
USDT.D is currently trading below 4.62. A break below this level would confirm further downside.
🎲 A break of 4.51 would further confirm a bearish trend in USDT dominance, signaling strength across crypto markets.
❌ Disclaimer ❌
Trading futures is highly risky and dangerous. If you're not an expert, these triggers may not be suitable for you. You should first learn risk and capital management. You can also use the educational content from this channel.
Finally, these triggers reflect my personal opinions on price action, and the market may move completely against this analysis. So, do your own research before opening any position.
TradeCityPro | HNT: Testing Resistance in DePIN Uptrend Structur👋 Welcome to TradeCity Pro!
In this analysis, I’ll review the HNT coin. The Helium project is a U.S.-based Web3 and DePIN initiative.
✔️ This coin has a market cap of $9.26 million and is ranked 97th on CoinMarketCap.
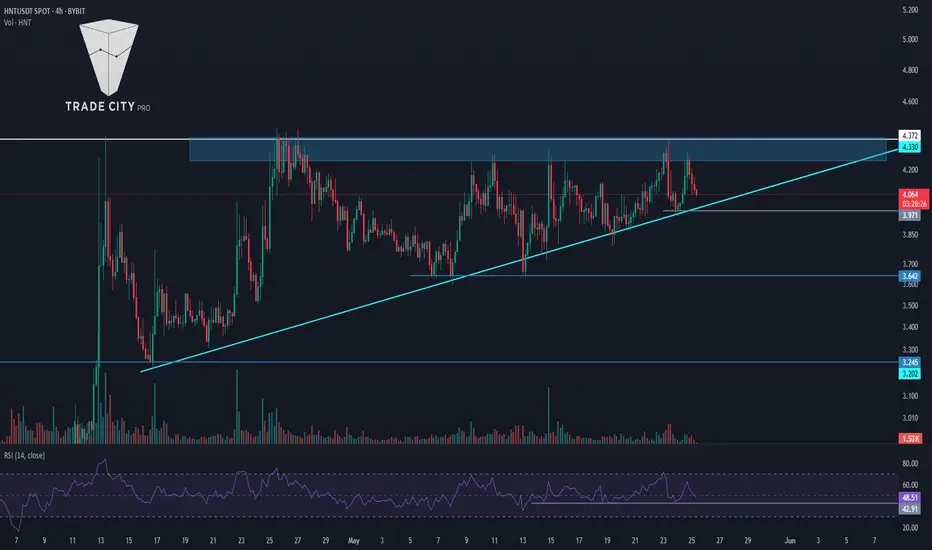
⏳ 4-Hour Timeframe
On the 4-hour chart, HNT has an ascending trendline with a resistance zone near 4.372.
💥 If this resistance is broken, the main upward move may begin, and a breakout above this level confirms a bullish trend for HNT.
📈 So for a long position, you can enter on the breakout or a pullback to this zone. The next resistance level is 5.333.
🔽 For a bearish scenario, the ascending trendline must be broken first to signal a potential reversal. A break below 3.971 would be the first confirmation of that trendline break and can be used as a short trigger.
⚡️ The main short trigger would be a break of 3.642, which could push the price down toward 3.245.
🧩 The RSI oscillator is currently sitting on the 42.91 support; a breakdown here would confirm bearish momentum for a short setup.
📝 Final Thoughts
This analysis reflects our opinions and is not financial advice.
Share your thoughts in the comments, and don’t forget to share this analysis with your friends! ❤️
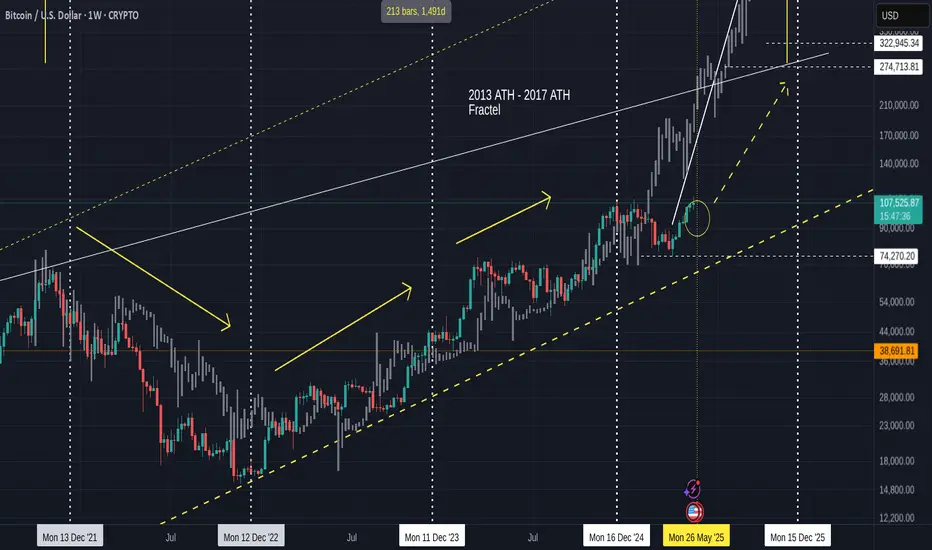
Quick BITCOIN Fractal update, Not on Fractal but still good
BITCOIN still in that target circle, first posted in Feb 2025, and I expect to remain here till early June.
This daily chart shows us where exactly we sit in the circle.
There are a number of reasons why we may remain here a little longer but one thing to always look at is the MACD.
The Weekly is still rising Bullish with room to move higher
The Daily is choppy and currently just fallen below its Signal line
We need to watch this area as between the MACD and its Histogram, we could see a Strong Bearish Divergence
The shorter term 4 hour shows how support in approaching
The habit has been for MACD to bounce off Neutral line but if we look at that Histogram, we can see the volatility there and so this could point to a weaker reaction in the near future.
In conclusion, the potential for a drop lower exists but the lower time frame MACD can also show us that some support is available maybe
Lines of support for BTC PA suggest a Low of around 105K should curent support fail.
Bitcoin Dominance (BTC.D) is currently rising again while the others are dropping.
If BTC PA Drops while this is rising, ALTS will Bleed heavy
Continued Range is the likely option till we reach June and then, Mid June, 18th, we have the FED Rate decision.
This could trigger renewed reaction.
We have reentered a zone of upmost CAUTION till we get some stronger momentum signals
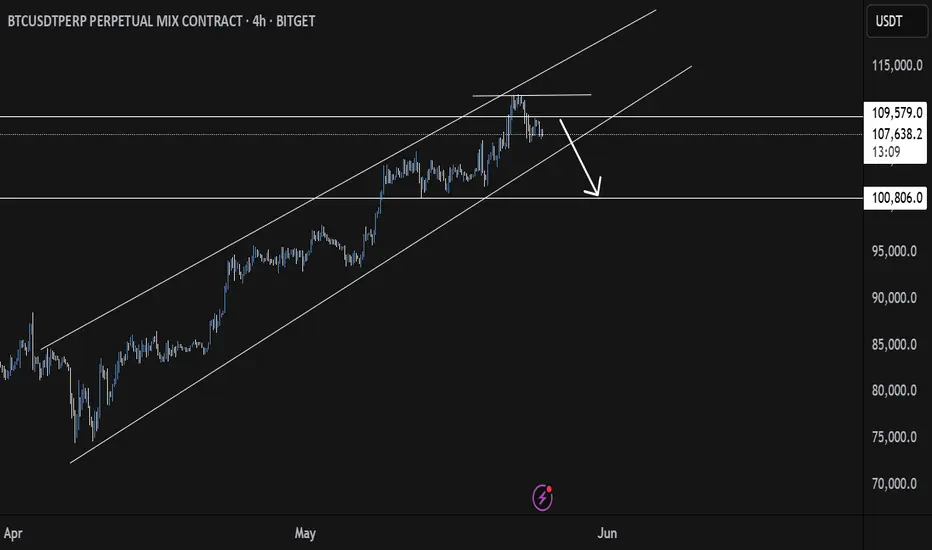
Is the BTC Bull Tired ? A Healthy Pullback May Be on the Horizon🚨 Market Watch Update 🚨
Hey fam while the macro trend is still bullish overall, I'm noticing signs that this current uptrend might be running out of steam. There’s a good chance we’re nearing a breakdown from the rising channel, which could open the door for a healthy correction down toward that ~$90K area.
Last week’s breakout really shook things up a ton of short positions got liquidated, which helped push the price higher in the short term. Classic squeeze move. 👀
But here’s what I’m watching next
🔻 In the near term, I’m leaning slightly bearish. I wouldn’t be surprised if price pulls back into the $102K–$99K zone sometime this week. That range could offer a decent reset before the next major move.
🧠 Remember, when green candles start popping, retail FOMO tends to kick in hard — folks jump in late, thinking the rally will never end.
That’s exactly where market makers step in, taking profits and reloading at better levels. Don’t be the exit liquidity.
Stay patient. Stay sharp. And as always I’ll keep you posted with a deeper dive soon. 🎯
BTCUSD | IntradayAlthough we have a buy direction on the daily time frame, there is a small correction in it, and we can try to take advantage of its movement!
Feel free to discuss
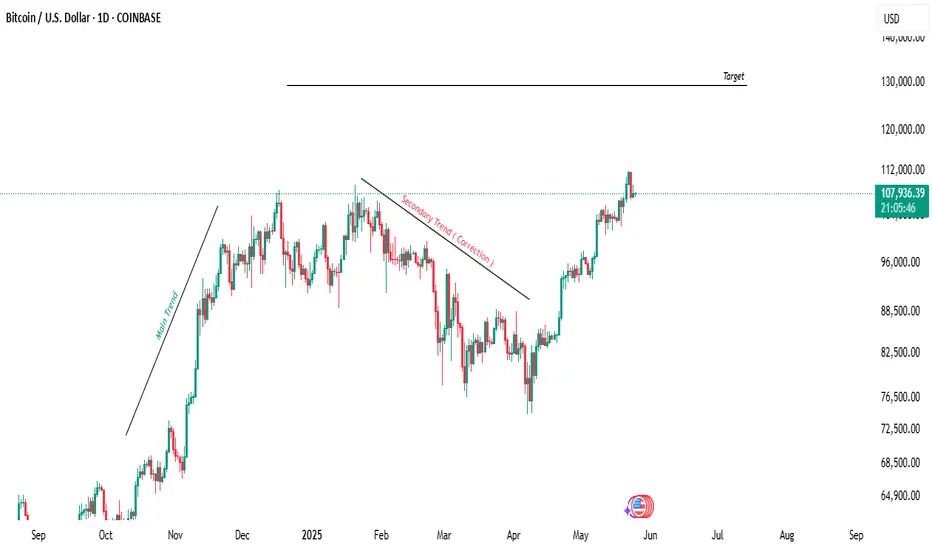
Bitcoin Daily Timeframe TargetAs we can see at Daily Timeframe :
1. As we have learned about market structure, bitcoin has finished its correction phase, and now in daily view, as the initial target bitcoin will touch the level that I have determined
2.Daily view will lead us to buy trade direction, this means the probability of buy is greater than sell, whoever takes sell trade will be eaten by whales
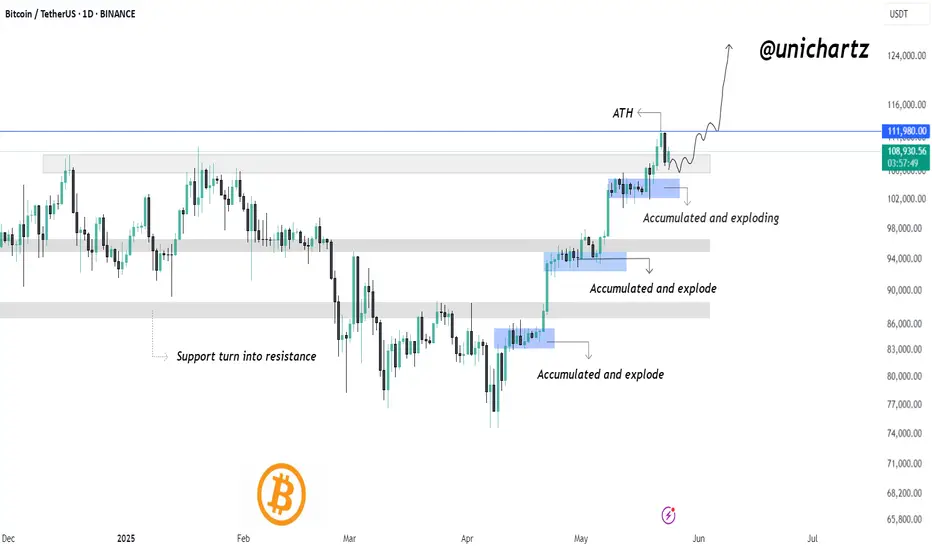
Bitcoin’s Breakout Pattern Continues – Is $120K Next?MARKETSCOM:BITCOIN Quick Update
Bitcoin is showing strong momentum — each time it accumulates, it breaks out to a new level. This "accumulate and explode" pattern has played out cleanly three times already.
Now, BTC is consolidating just under its all-time high. If this range holds, another breakout could be coming soon.
The structure remains bullish as long as price holds above the $103K zone. A clear break above ATH could send it toward $120K and beyond.
BTC Futures : My first attempt with a target price of 0Hello friends; I think not believing in Bitcoin is as natural as believing in Bitcoin.
I can't express my opinion here with moving averages and/or RSI levels.
The Beyond Technical Analysis might make sense for this trade.
If we are wrong, what is important here is our position and risk management. We do not open a transaction to say "I told you so".
I cannot explain this with any technical analysis method, blockchain data, etc.
Technically; everything that will be built based on this is the same as building a sand castle.
I don't think Bitcoin has an equivalent.
If we consider serious inflation rates, it is obvious that people will have much bigger and more vital priorities than buying Bitcoin or other cryptocurrencies. I am not even talking about electricity costs.
I definitely don't think it can be in the same class as Gold.
This trade alone offers us a very good risk/reward ratio.
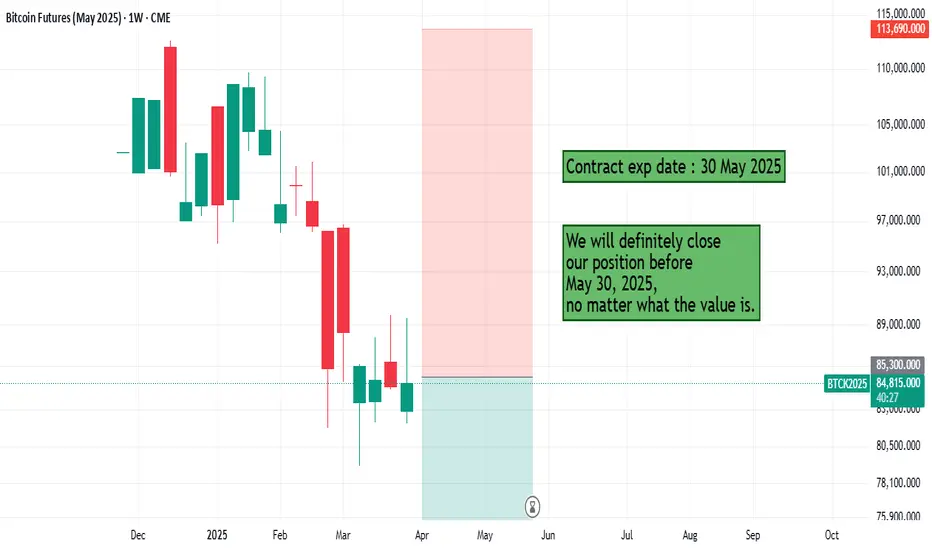
I chose the contract covering the next period ending on May 30th, not the continuous CME contract, in order to save time.
A good place for a first try.
I will definitely try something similar.
I don't think I will have any views other than the short side in the future.
For years I have been asked, "If you don't believe us, why don't you open a short position?" I will try to achieve this.
So there's also an experimental side to this.
HIGHLIGHTS
We are closing our position before the contract switch date of May 30, 2025, without looking at the price. If necessary, we will try again in the next contract.
The value of 113690 is our stop value. We end our trade at this value.
We choose the smallest value as the position size.
If you expect something to be 0,
you should choose trading instruments that evaluate your position in currencies rather than in BTC value.
I chose CME because it is suitable for this.
Contracts that are further away are definitely not liquid.
It may be difficult to find buyers even at high values.
Target : 0
Absolutely no margin addition.
Best regards.
TradeCityPro | Bitcoin Daily Analysis #100👋 Welcome to the 100th Bitcoin Analysis!
I'm really happy we've shared this 100-day journey together, and I hope you've been able to benefit from these analyses along the way.
💥 Every single analysis I've posted so far has been the basis for real trades that I've taken myself. I'm glad to say the overall result of those trades has been profitable, and I hope your results have been positive too.
⚡️ Today, I want to do a full multi-timeframe breakdown of Bitcoin and other major crypto indices. Let’s dive in and see where the market stands.
💰 Bitcoin Analysis
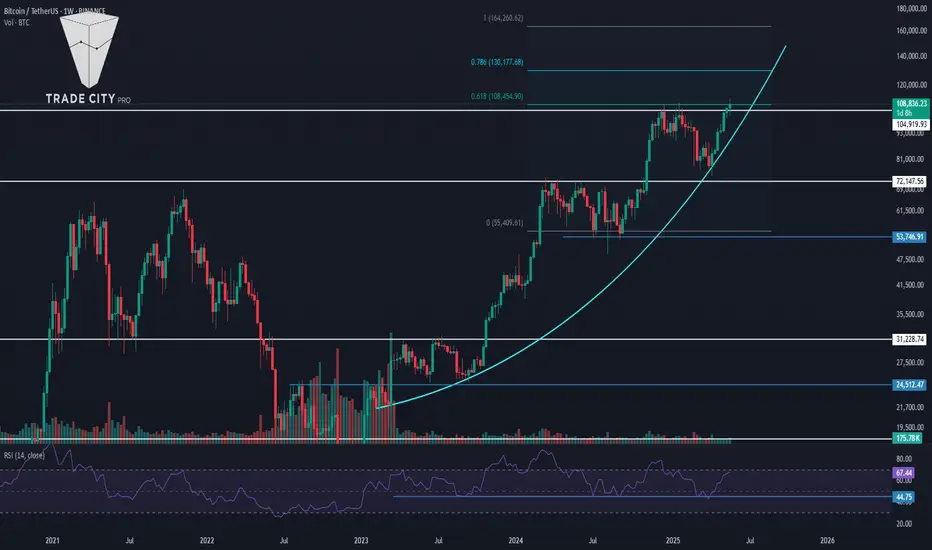
📅 Weekly Timeframe
As you can see, in the weekly chart, Bitcoin reacted to an ascending curved trendline during its recent correction phase and retraced up to around 72,147.
💫 On the RSI, we also have a key support level at 44.75, which has held again. The combination of this support with the curved trendline has created a potential PRZ (Potential Reversal Zone), and price has since resumed its upward move.
✔️ Last week’s candle managed to close above the resistance at 104,919 for the first time ever. Many in the market expected that a weekly close above this level would trigger a sharp rally toward 130,000 or even 160,000.
📊 However, that hasn’t happened—this week’s candle is still small and lacks strong bullish momentum.
✨ We can now view the range between 104,919 and 108,454 as a resistance zone. Although the price has entered this zone, we haven’t yet confirmed a breakout. That confirmation would come with a weekly close above 108,454.
📈 Despite the strong momentum before breaking ATH, price seems to be losing steam now. That’s not necessarily bad—it’s actually expected, since this area is one of the most important supply zones for Bitcoin and won’t break easily.
🔽 If price gets rejected and this move turns out to be a fakeout, there’s a real possibility of a trend reversal. We’ve got a potential double top forming, which is usually the first signal of a reversal. If price then breaks the 72,147 support, it would confirm the end of the current uptrend. A lower high and lower low afterward would confirm a new downtrend.
⭐ At this point, I can’t give you a new spot-buy trigger in this timeframe. The trigger was around the curved trendline. Since price has moved away, we need to wait for a new setup to form.
Let’s check lower timeframes for more detailed price action.
📅 Daily Timeframe
In the daily chart, after getting support at 76,087, price started moving up and with the breakouts of 87,700 and 91,953, the bullish phase began.
🔍 Currently, price is holding above 106,250 with increasing volume since the 91,953 breakout. Everything looks ready for Bitcoin to begin its main move and enter an extension leg up.
🚀 If this happens, price could target 129,000 and even 150,000. RSI will be key for confirmation—if it re-enters Overbought territory and holds above 77.81, higher targets become more likely.
🛒 The previous spot-buy triggers I gave were at 87,700 and 91,900. If you entered with those, I recommend holding for now and waiting for signs of a trend change before taking profits.
🔔 If you didn’t buy earlier, I can’t provide a new entry just yet—we need to wait for a new structure and trigger to form.
🔽 For now, I still see the trend as bullish. A bearish scenario would require a fakeout below 106,250—if price drops and forms a lower high and lower low, the uptrend would be over and a downtrend would begin.
⏳ 4-Hour Timeframe
After breaking 106,250, price rallied to 111,826 and is now pulling back to 106,250.
✔️ RSI is holding above its local support at 44.48, and as long as it stays above that level, market momentum remains bullish.
📈 You can consider entering a long on a pullback to 106,250. A breakout above 111,826 would be the main trigger for a new long.
🔑 Right now, there’s no valid reason to short, so it’s best to wait for a clear bearish structure before considering that.
👑 Bitcoin Dominance (BTC.D)
📅 Weekly Timeframe
After several green weekly candles, BTC.D printed a large red candle, pulling back toward the midline of its ascending channel and rejecting from 64.77. However, it’s now moving back up again.
💥 With this strong momentum, there’s a good chance BTC.D could break out of the channel. If 64.77 breaks, we could see a push toward 71.04.
⚡️ To confirm a bearish reversal in BTC.D, we’d need to see a breakdown below the lower trendline of the channel. That would likely signal the start of an altseason.
📅 Daily Timeframe
BTC.D has been in an uptrend and even broke above its channel briefly. But after hitting 65.31, it started a correction and dropped to the midline at 62.22.
🎲 It quickly bounced from 62.22 and is now moving upward again. Given the bullish structure, it could retest the 65.31 high.
📈 If it forms a lower high and breaks below 62.22, that would confirm a trend reversal. A breakout above 65.31 would confirm continuation of the uptrend.
⏳ 4-Hour Timeframe
BTC.D rallied to 64.31 and is now trying to retest that level. If it breaks above 64.31, the next target is 65.41.
🧲 If it forms a lower high and breaks 63.51, we’d get a confirmation that the bullish leg has ended, increasing the chances of a move to 62.17.
✔️ Total2 (Altcoin Market Cap Excluding BTC)
📅 Weekly Timeframe
After breaking the curved trendline, Total2 fell to around 816B before bouncing alongside Bitcoin.
⚡️ Currently, it’s ranging between 1.15T and 1.26T for the past three weeks.
🧩 If price breaks this range, it could rally toward 1.61T, which is the most important supply zone for Total2. A breakout here would likely trigger a strong altcoin rally.
🛒 If that breakout coincides with a drop in BTC.D, it would be an excellent spot-buy opportunity for altcoins.
📊 If the current rally fails to reach 1.61T and forms a lower high, another drop toward 816B is likely. This time, the chance of breaking that support would be high—confirming a trend reversal.
📅 Daily Timeframe
Price is stuck in a range between 1.15T and 1.26T.
🔼 A breakout from either side would likely lead to a strong move. A break below 1.15T could extend the decline toward 861B, while a break above 1.26T would target 1.62T.
⏳ 4-Hour Timeframe
Same structure as the daily chart. Long trigger = 1.26T breakout. Short trigger = 1.15T breakdown.
🔑 If price forms a higher low and starts moving back up, the likelihood of breaking 1.26T increases. The next target would be 1.33T.
✔️ USDT Dominance (USDT.D)
📅 Weekly Timeframe
USDT.D is ranging between 3.78 and 6.22.
📉 It recently formed a lower high below 6.22 and broke below 5.06, now heading toward 3.78.
🤔 If USDT.D drops to 3.78, we could see a major market rally—Bitcoin might move toward 130,000 or 160,000.
🚀 If 3.78 breaks, the next support is at 2.53, which would mark the start of a major bull run.
📅 Daily Timeframe
USDT.D has hit support at 4.40 and is now approaching a descending trendline that’s been holding since the 6.22 top.
📈 If that trendline breaks, the trigger is at 4.70. A breakout here could lead to a move to 5.02.
🔽 If price gets rejected again, the short trigger is at 4.40, and the next support is at 3.81.
⏳ 4-Hour Timeframe
Support at 4.38 has held, and price is now above 4.50 and approaching the trendline.
🎲 If 4.50 fails and price drops to 4.40, a break below 4.40 confirms a bearish continuation.
📊 If the trendline breaks, use 4.74 as your confirmation trigger.
❌ Disclaimer ❌
Trading futures is highly risky and dangerous. If you're not an expert, these triggers may not be suitable for you. You should first learn risk and capital management. You can also use the educational content from this channel.
Finally, these triggers reflect my personal opinions on price action, and the market may move completely against this analysis. So, do your own research before opening any position.
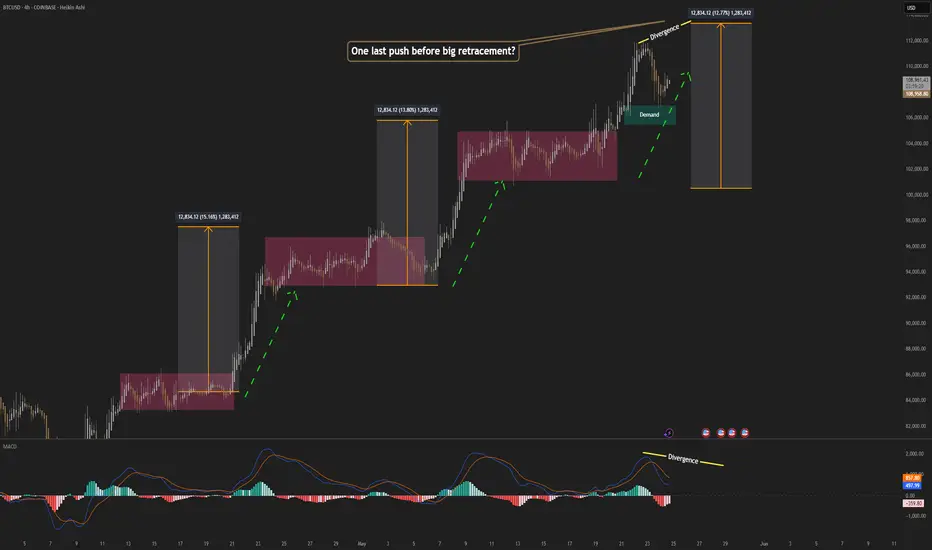
BItcoin; Heikin Ashi Trade IdeaCOINBASE:BTCUSD
Picture tells more than 1000 words!
Thank you for checking out!
Heikin Ashi VS Regular candlesticks - EducationalNASDAQ:AMZN
Everything is explained in the video.
I hope you will find it very educational and test it. Those who trade stocks will probably switch to Heikin Ashi :)
Thank you!
