Heikin Ashi VS Regular candlesticks - EducationalNASDAQ:AMZN
Everything is explained in the video.
I hope you will find it very educational and test it. Those who trade stocks will probably switch to Heikin Ashi :)
Thank you!
Cryptomarket

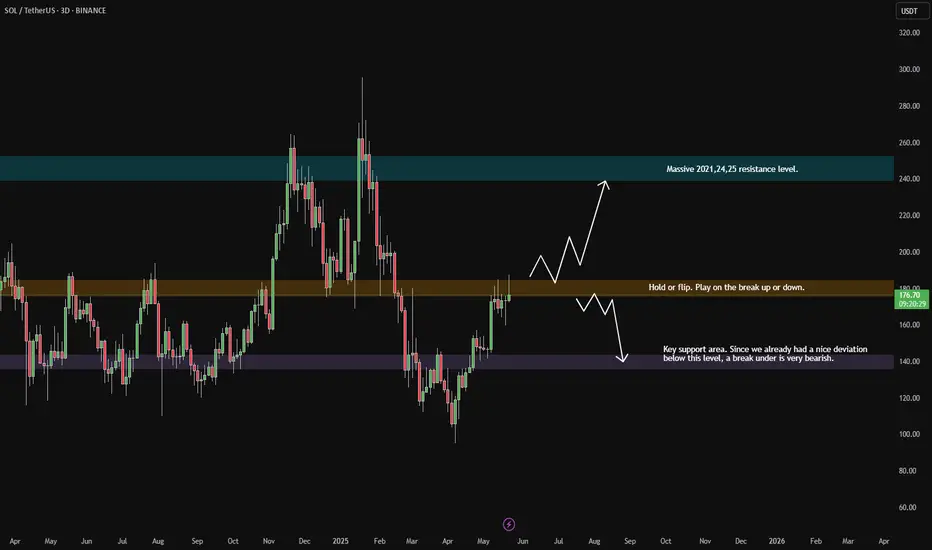
SOL macro plan3D chart looks very simple here. Simply act on the break on the current zone and take the position to target opposite liquidity area.
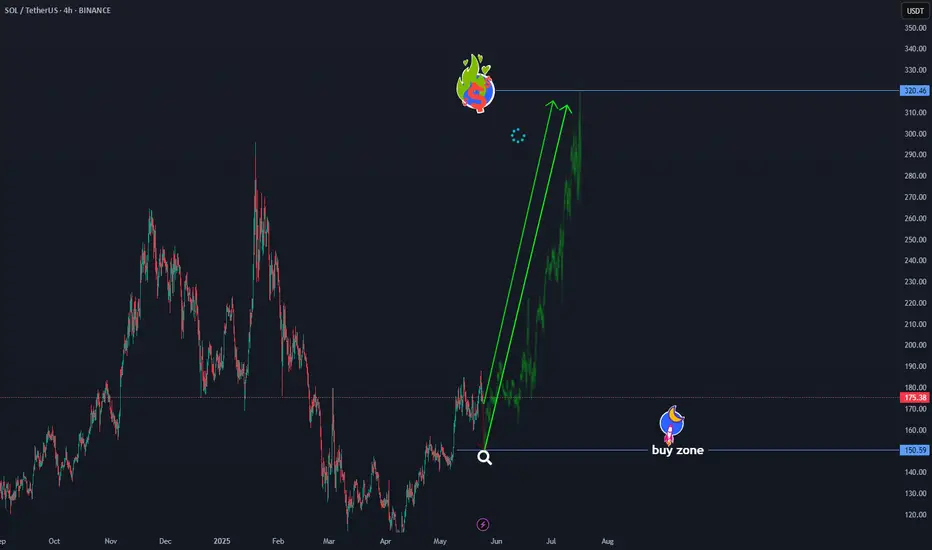
solusdt will go to towards 320$solusdt BINANCE:SOLUSDT will go towards $320
In the current area, a downward correction to $150.5 is possible, but ultimately the final destination is $320,
Market geometry doesn't lie.
$320 is an index for this symbol.
INJ/USD Bullish Heist: Crack the Vault & Grab the Loot!Ultimate INJ/USD Heist Plan: Snag Profits with the Thief Trading Strategy! 🚀💰
🌍 Greetings, Wealth Raiders! Ciao, Hello, Bonjour, Hola! 🌟
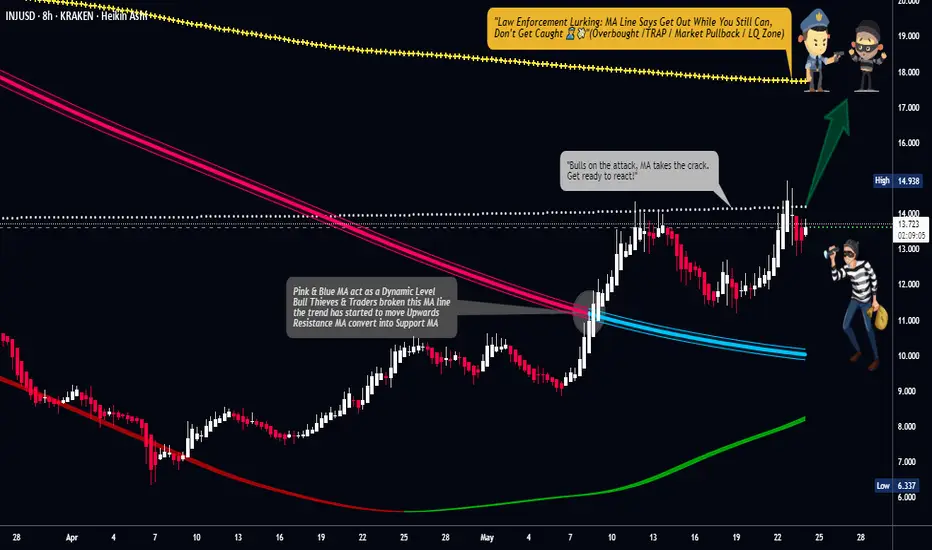
Fellow profit hunters, get ready to crack the INJ/USD "Injective vs U.S Dollar" Forex vault with our slick Thief Trading Strategy! 🤑💸 This plan blends razor-sharp technicals and fundamentals to loot the market. Follow the chart’s long-entry blueprint to strike at high-risk zones like the Yellow Moving Average Zone. It’s a wild ride—overbought conditions, consolidation, and potential trend reversals mean bears are lurking! 🐻 Stay sharp, grab your profits, and treat yourself—you’ve earned it! 🎉💪.
📈 Entry: Storm the Vault!
"The heist is on! Wait for the breakout (14.700) then make your move - Bullish profits await!"
The market’s ripe for a bullish grab! 💥 Place buy limit orders within the most recent 15 or 30-minute swing low/high levels. Set alerts on your chart to stay locked in. 🔔
🛑 Stop Loss: Guard Your Loot!
Set your Thief SL at the nearest swing low or candle wick. on the 8H timeframe for day/swing trades. Adjust based on your risk tolerance, lot size, and number of orders. Safety first! 🔒
🎯 Targets: Claim Your Prize!
🏴☠️ Short-Term Target: 15.700
👀 Scalpers, Listen Up!
Stick to long-side scalps. Got deep pockets? Jump in now! Otherwise, join swing traders for the heist. Use trailing stop-loss to lock in gains and protect your stash. 💰
🐂 Why INJ/USD is Hot!
The "Injective vs U.S Dollar" bullish surge is fueled by key fundamentals. Dive into Macro, COT Reports, On Chain Analysis, Sentiment outlook, Intermarket trends, and future targets via the linkss below for the full scoop. 👉🔗. Stay informed to stay ahead! 📰
⚠️ Trading Alert: News & Position Management
News releases can shake the market like a heist gone wrong! 🗞️ To protect your profits:
🚫 Avoid new trades during news events.
🛡️ Use trailing stops to secure running positions.
💥 Boost the Heist!
Hit the Boost Button to supercharge our Thief Trading Strategy! 💪 Every click strengthens our crew, making it easier to swipe profits daily. Join the squad, trade smart, and let’s make money rain! 🌧️💵
TradeCityPro | CORE: Watching Trendline and RSI for Next Move👋 Welcome to TradeCity Pro!
In this analysis, I’ll be reviewing the CORE token. This project is one of the DeFi infrastructure developers for Bitcoin and also runs its own Layer 1 blockchain.
💥 The token currently holds a market cap of $826 million and is ranked 86th on CoinMarketCap.
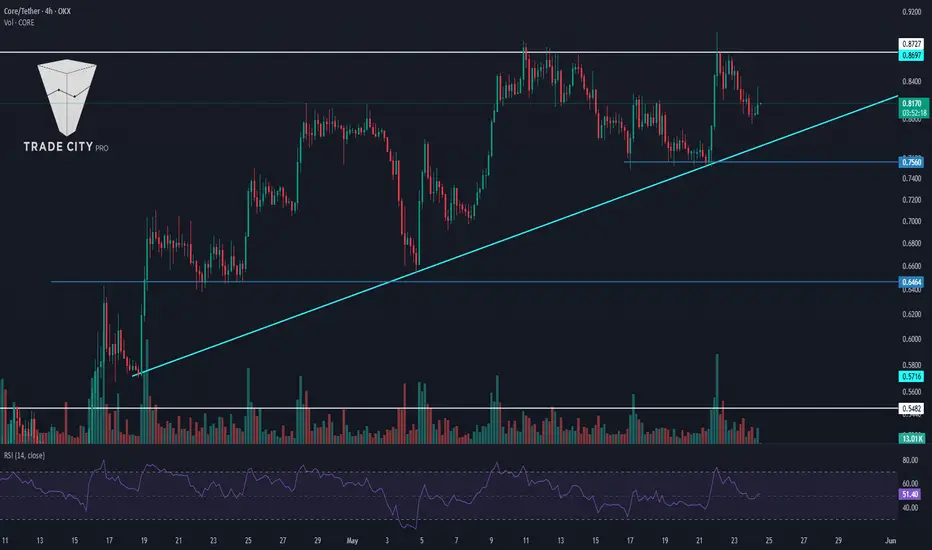
⏳ 4-Hour Timeframe
As seen on the 4-hour chart, CORE is in an uptrend supported by an ascending trendline, with price consistently moving higher along it.
✅ In the last bullish leg, price only managed to retest the previous high around 0.8727 and is now undergoing a pullback.
⚡️ This shows signs of weakness in the bullish momentum. If the price fails to close above 0.8727 and drops back to the trendline, the risk of a trendline breakdown increases.
🔍 There’s also the potential for price to form equal highs and higher lows, forming an ascending triangle, which would favor a bullish breakout scenario.
🔑 Watch the RSI oscillator closely. Historically, every time RSI reached the 70 zone during a bullish move, the trend topped out and reversed. So if RSI manages to break above 70 this time, it could trigger a much stronger bullish leg.
📈 For a long position, potential entries include a breakout above 0.8727 or a bullish bounce off the ascending trendline.
🔽 For a short position, the first trigger would be a break of the trendline and activation of the 0.7560 support zone.
📝 Final Thoughts
This analysis reflects our opinions and is not financial advice.
Share your thoughts in the comments, and don’t forget to share this analysis with your friends! ❤️
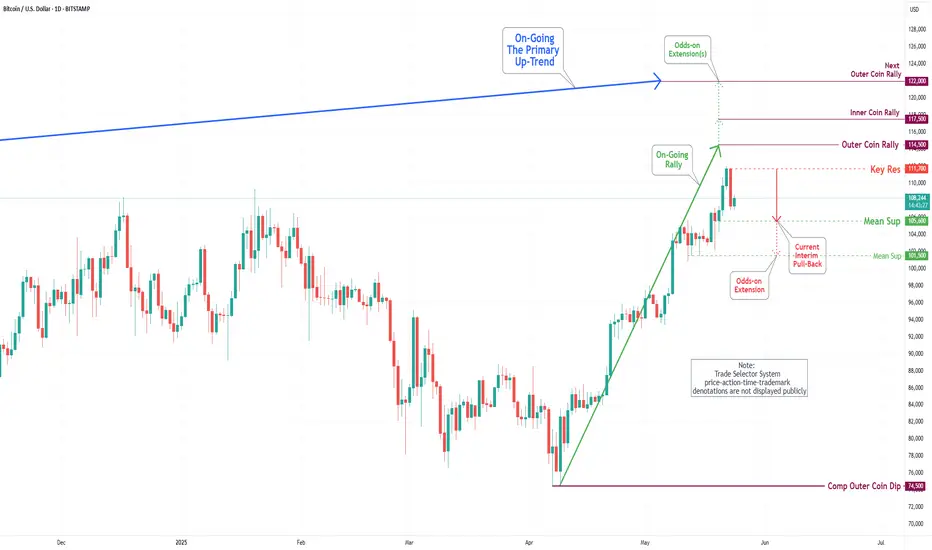
Bitcoin(BTC/USD) Daily Chart Analysis For Week of May 23, 2025Technical Analysis and Outlook:
In the course of this week's trading session, Bitcoin demonstrated significant upward movement, surpassing both Mean Resistance at 105000 and Key Resistance at 106100. This progression also facilitated the surpassing completed Inner Coin Rally at 108,000, and the highly anticipated Outer Coin Rally marked at 110000. As a result, the cryptocurrency experienced a substantial decline, currently aiming toward Mean Support at 105600, with a potential further decline toward an additional Mean Support target at 101500.
It is essential to acknowledge the possibility of an upward momentum emerging from the current level, which may enable a challenge to Key Resistance at 111700. Success in this regard could result in reaching the Inner Coin Rally at $114500 and, subsequently, the Outer Coin Rally at 122000.
BCH/USD Crypto Profit Raid: Steal Gains with This Blueprint!🔥 Chart Heist Blueprint: Snag Profits in BCH/USD "Bitcoin Cash vs U.S Dollar"! 🚀💰
Crafted for sharp traders ready to raid the BCH/USD "Bitcoin Cash vs U.S Dollar" market, this sleek strategy fuses razor-sharp technicals with savvy fundamentals to maximize your gains. 📊🕵️♂️ Surf the bullish surge, but watch for traps in the Overbought Resistance Zone where bears could strike! 🐻 Lock in your loot before the tide turns. 🌊
- 🎯 **Entry Tactics: Hit the Sweet Spot**
- Long on pullbacks near 440.00 (or) the Silent entry : Institutional Buy Zone at 380.00 (or) above price level. 🏹
- Set alerts for breakouts or pullbacks to strike in real-time. 🔔
- 🛡️ **Stop Loss Hacks: Guard Your Gains**
- Place stops below the nearest 4-hour swing low or candle wick. 🔧
- Tailor stops to your risk and lot size—precision over recklessness! ⚡
- 💸 **Profit Goals: Cash In Big**
- Bullish traders aim for 510.00 or exit early if momentum dips. 📈
- Scalpers focus on long-side quick wins, trailing stops behind big players. 🚀
- 📡 **Market Edge: Why This Plan Wins**
- BCH/USD "Bitcoin Cash vs U.S Dollar" is charging bullish, driven by COT data, macro shifts, sentiment outlook, and intermarket flows. 🔍
- Check the linkss for deeper insights. 🌐
- ⚠️ **News Alert: Dodge the Chaos**
- Skip new trades during major news releases. 📰
- Use trailing stops to secure profits on active trades. 🔒
- 🤝 **Join the Profit Crew**
- Boost this plan, share the vibe, and let’s raid the markets together! 🤑
- Stay sharp for the next big score in the XPD/Palladium heist! 💥
Happy trading, chart bandits! 🎭📉

$INJ on WeeklyThe asset bounced within the Demand zone on the Weekly, creating room for a possible rally up to the $20-25 area.
Volatility is still open but with steadily decreasing bearish pressure.
A Daily FVG overlaps with the Weekly FVG so as to create possible room for maneuver.
The widely used RSI has broken the barrier of a bearish trendline that has lasted since December 2023. Whether it maintains the trajectory will only be seen at the close of this week.
Funding rates positive.
Open Interests slightly up.
Detail not to be overlooked in the coming days: the market cap line is rising, but the price is lagging slightly. Positive sign.
Stable volume, with an improvement in the last two days. Very mild data.
With the whole crypto sector seemingly showing signs of life, I am confident of its uptrend.
Remember: until proven otherwise.

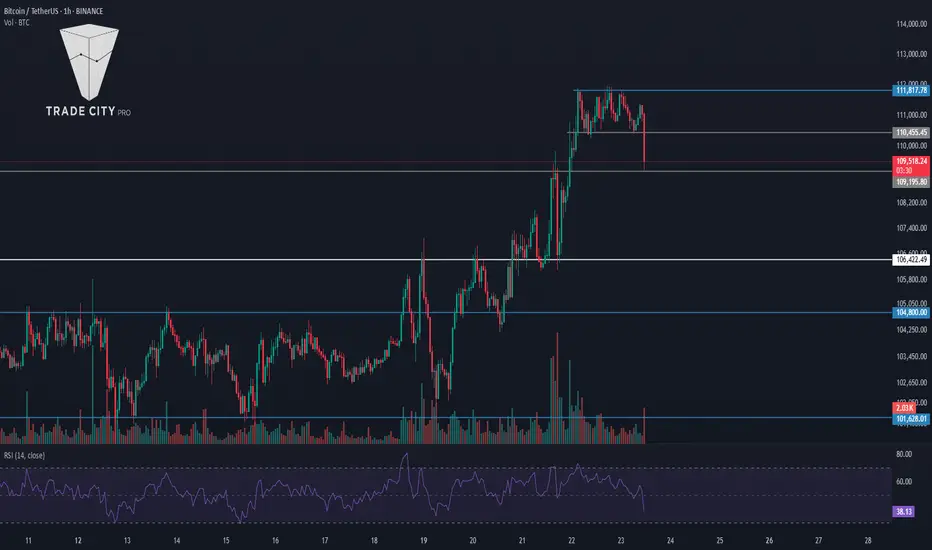
TradeCityPro | Bitcoin Daily Analysis #99👋 Welcome to TradeCity Pro!
Let’s go over the Bitcoin and major crypto index analysis. As usual, I’ll cover the key futures session triggers for New York.
⏳ 1-Hour Timeframe
As you can see on the 1-hour chart, Bitcoin is still trading below the 111817 level and has formed a support at 110455 after multiple rejections from that resistance.
✔️ If this 110455 level breaks, we could see a deeper pullback toward 109195, and potentially even down to 106422.
✨ The RSI oscillator is currently sitting at the 50 support level again. If RSI breaks below 50, it would indicate a weakening bullish momentum and increase the likelihood of a bearish scenario.
💥 However, if RSI holds above 50, it would confirm that buyers are still in control, and the probability of the uptrend continuing increases.
⚡️ The 111817 level remains a very clean and strong trigger for a long position. If price breaks this level, the market could make another leg up.
📊 Make sure to watch the volume closely. If buy volume starts to increase, a breakout above 111817 could offer a strong entry for those not already in a position.
👑 BTC.D Analysis
Bitcoin dominance broke below 63.76 yesterday, which helped altcoins rally, but it has since recovered and moved back above that level.
📈 For now, dominance is ranging between 63.76 and 64.30. A breakout from either side would confirm the direction of the next move.
📅 Total2 Analysis
Total2 was rejected from the 1.26 resistance and has now fallen below 1.23. If this downward move continues, the next support levels are at 1.18 and 1.15.
🔑 If price finds support here and moves back up to retest 1.26, a breakout from that level would be a fresh long trigger.
📅 USDT.D Analysis
Tether dominance found support at 4.38 and is now moving upward.
🧩 As long as it remains below 4.51, the overall market momentum is still considered bullish. But if it manages to stabilize above 4.51, the likelihood of a broader market correction increases.
❌ Disclaimer ❌
Trading futures is highly risky and dangerous. If you're not an expert, these triggers may not be suitable for you. You should first learn risk and capital management. You can also use the educational content from this channel.
Finally, these triggers reflect my personal opinions on price action, and the market may move completely against this analysis. So, do your own research before opening any position.
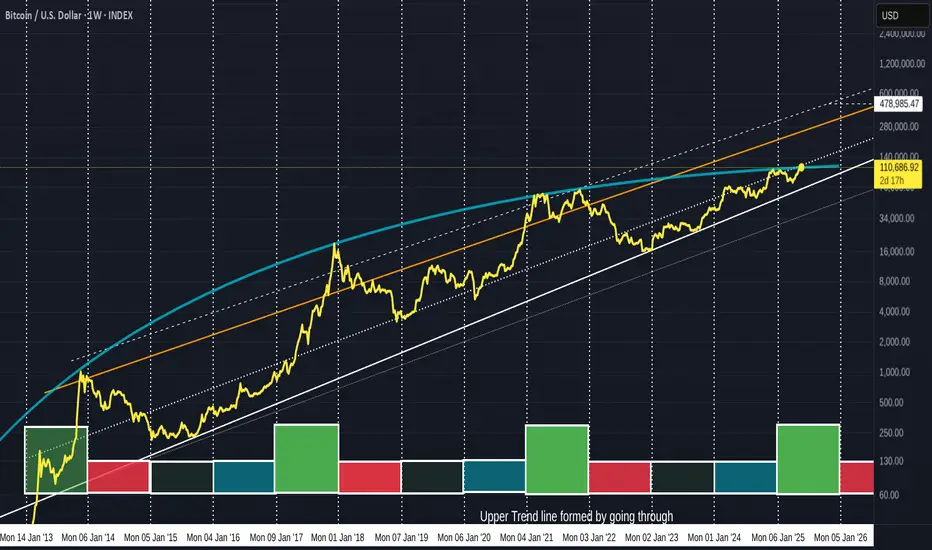
BITCOIN 5 lines and 3 indicators to watch now we in new ground
I will be presenting a number of charts here and each has a different story to tell right now.
The 5 lines are All valid trend lines.
The Vertical lines are January year markers
The white line at the bottom is th e long term support line from 2013
The Dotted line is a threshold line
The Blue Arc is a line that has rejected EVERY ATH since 2013
The orange line is a marker that, once crossed has Always led to a New cycle ATH
The upper dashed line is the line of rejection of all ATH since 2017
The Weekly Bitcoin PA chart
Here we can clearly see how that Blue Arc has rejected PA previously. We can see how PA has reached a point of intersection and once it crosses that blue Arc, there is a line of rejection just above.
This Blue line needs to be crossed and held as support.
The Daily version of this chart shows ua how we have just crossed that blue Arc.
It also shows us how FRAGILE this is right now. PA is currently testing that Blue line as support
This needs to Hold. If we manage to hold this line and bounce, Stiff resistance is found around 120K
The following charts are showing the following indicators
The 3 indicators used are
RSI - Relative Strength Index. used to measure the speed and change of price movements
TSI - True Strength Index, used to indicate trend direction and overbought/oversold conditions.
ADX - The Average Directional Index (ADX) is used to measure the strength of a trend, not its direction
The 4 hour chart - short term expectations for the weekend
Bitcoin PA the Yellow line at the Top, the indicators are in the order listed above,
First thing to see here is how BTC PA is retesting that Blue Arc - this really needs to hold
RSI (blue) - OVER BOUGHT, It has fallen below its own MA ( average) and could easily drop further today. Looking back along this, we can see how the 4 hour RSI likes to range along the Neutral line, so we may see it drop back to that level today, tomorrow
TSI is also OVER BOUGHT. We can see when TSI is up here, PA ranges while it cools off. But there is room for one little push here if required
ADX ( yellow ) is high showing trend could be getting near exhausted, The orange line is the DI+. This shows positive prince direction, the Red one is DI- and shows that negative price direction is climbing slightly.
In the short term, we need to see PA hold above the Blue line but the likelihood is to possibly back below. There is support below.
The WEEKLY shows us that PA has the ability to continue for a while longer but we are getting near a point where PA needs to recover
Here we can see how the RSI and TSI are both up high, on the edge of OVER BOUGHT but with the ability to rise further.
What is VERY important to take note of here is that ADX.
It is Low, this is indicating that the weekly Trend has lost strength now. It could continue lower.
Remember, ADX DOES NOT SHOW TREND DIRECTION, JUST STRENGTH
So, the thing to see here is that we are in an area where we could see a New Trend begin. This trend could be either Bullish or bearish
On a weekly chart, this change can take a long time to appear in PA
And for the Longer Term, The Monthly Chart gives us hope for a fuhrer push higher for the rest of the year but one little warning bell
WE See Both RSI and TSI up high again, where they have been since 2024. But neither of them are up in OVER BOUGHT as much as they have been in previous cucle Tops.... So we can assume room to move higher.
But what does ring a bell is that ADX again. It is once again, in a place of Change and on this chart, showing that the current trend can start becoming weaker. However, DI+ has plenty of room to move higher
So, in conclusion, we see that BITCOIN has the ability to continue higher but in the short term, we may see a pause and possinle Volatility
Trends are about to change, This could take Weeks and PA can continue higher while a trend weakens.
For me. we are in the last few months of this cycle and at a point of Decision.
PA MUST get over that Blue Arc that has rejected Every ATH since 2013.
If PA fails this, we go back to sub 90K but this is unlikely,
There are numerous projections that see BTC PA in price discovery reaching the 120K before serious resistance.
On this chart, if PA follows pattern and trends, we could see 378K by year end
Getting over that irange line is KEY
Stay safe everyone.
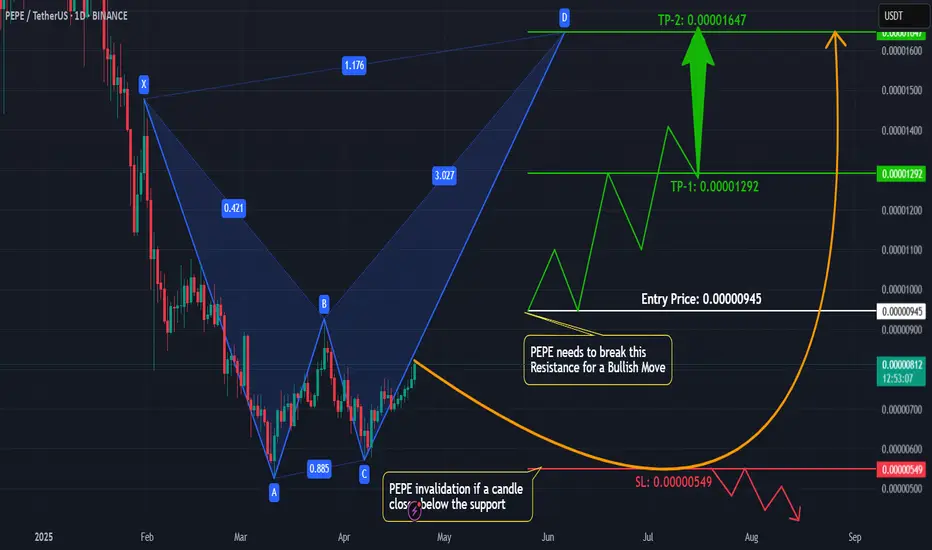
PEPE 1D Harmonic Pattern Setting Up for a Bullish Breakout!Hey traders!
I'm spotting a potential bullish setup on #PEPEUSDT — and it’s one worth watching closely.
🔍 Technical Overview:
On the 1D time frame, #PEPE is forming a textbook harmonic pattern — still confirming.
No bearish divergence or reversal signs spotted so far — momentum remains intact.
Key level to watch: B point of the harmonic pattern, acting as strong horizontal resistance.
🎯 Trade Idea:
Plan: Wait for a clean breakout above the B-level, followed by a successful retest.
If the retest holds as support, I’ll be entering a long position with tight risk management.
TP-1: 0.00001292
TP-2: 0.00001647
SL: 0.00000549
⚠️ Why patience matters: Jumping in too early can expose you to fakeouts. Confirmation = confidence!
💬 What do YOU think? Is #PEPE about to explode or will the resistance hold? Drop your thoughts below! 👇
📈 If you find this helpful, don’t forget to: 👍 Like
💬 Comment
🔁 Share
📌 Follow me for more high-probability setups!
Let’s trade smart, not emotional. 💡
#PEPE #CryptoTrading #HarmonicPattern #BreakoutSetup #TechnicalAnalysis #TradingView #CryptoCommunity #Altcoins
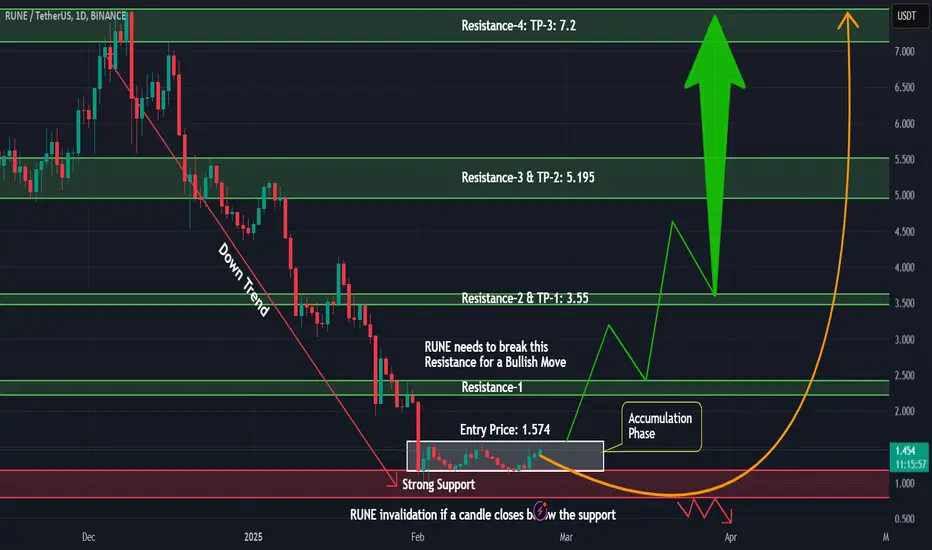
RUNE Ready for a Big Move? Accumulation Breakout Incoming!Current Market Structure:
#RUNE has been in an accumulation phase after a prolonged bearish trend. The price is consolidating, forming a potential Wyckoff Accumulation pattern. No further bearish signs are present except for the previous break of a strong support level.
Key Levels to Watch:
🔹 Support: $0.788 (previous level)
🔹 Resistance: $2.5 (breakout zone)
🔹 Accumulation Range: $1.13 – $1.6
Trading Plan:
🔹 A confirmed breakout above the resistance level will signal the start of a bullish trend.
🔹 Ideal long entry on breakout with a retest confirmation.
🔹 Stop-loss below accumulation range to minimize risk.
🔹 Targeting $7 as the next resistance level.
What do you think?
Will #RUNE break out soon, or are we in for more sideways movement? Share your thoughts in the comments!
Like & Follow for more trade setups and insights!
BNB Ready for a Major Breakout? Head & Shoulders Pattern in PlayMarket Insight:
#BNB is currently trading in a prime buying zone for spot traders, showing strong price action on the 4-hour timeframe. A Head and Shoulders (H&S) pattern is forming, and we are closely monitoring its breakout for a potential bullish move.
🔹 Bearish Signs? None so far! The market structure remains intact, and buyers seem to be in control.
Trade Plan for Bulls:
🔹 Breakout Confirmation: A clean break above the neckline of the H&S pattern will confirm bullish momentum.
🔹 Entry Zone: After confirmation, a long position can be initiated with proper risk management.
🔹 Stop Loss & Risk Management: Place a stop-loss below the right shoulder to manage risk effectively.
🔹 Potential Target: If the breakout holds, we could see a strong upward move toward key resistance levels.
🔹 Chart Analysis: (Attach a well-annotated chart with clear trendlines, breakout zones, and risk-reward levels)
🔹 What’s Your Take?
Do you think #BNB will break out or face rejection? Drop your thoughts in the comments!
Like & Follow for more real-time trade setups!

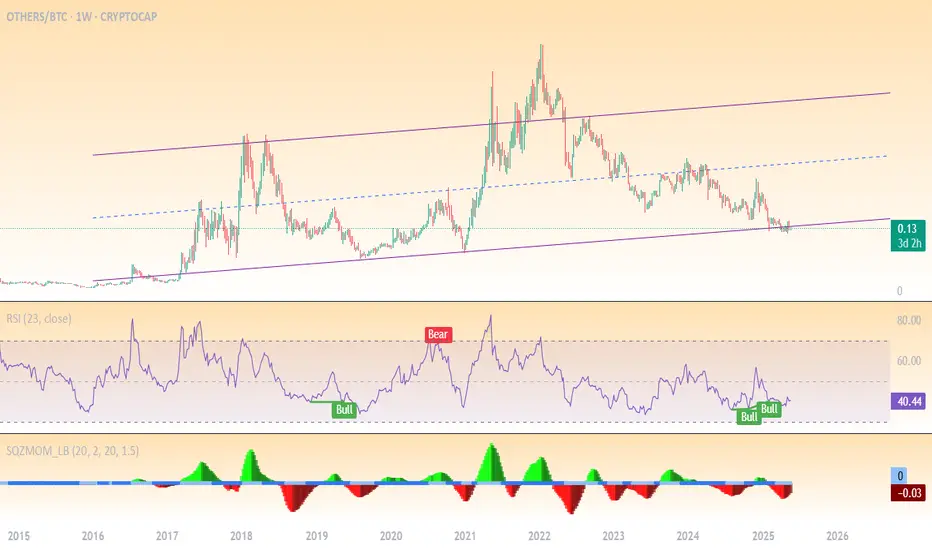
Altcoin Season Brewing?Hi,
The OTHERS/BTC pair represents the collective market capitalization of altcoins relative to Bitcoin. This ratio is a critical indicator of altcoin strength or weakness against Bitcoin. The weekly chart reveals a prolonged bearish phase for altcoins, with Bitcoin dominance persisting. However, recent data suggests potential inflection points worth monitoring.
Key Technical Elements:
- Ascending Channel: The pair is moving within a well-defined macro upward channel. It is currently sitting at the bottom boundary, suggesting a potential reversal point.
- Support Zone: The lower boundary of the channel (purple line) aligns with previous bounce points (2019, 2020, mid-2023), reinforcing its validity.
- RSI Indicator: The RSI has shown bullish divergence with price making lower lows while RSI forms higher lows.
My Opinion:
This chart suggests we are near the bottom for altcoins vs BTC, and the risk/reward is heavily tilted in favor of a bounce, especially going into a potential Q3-Q4 altseason. It’s a classic accumulation zone where smart money tends to position.
And what to do?
- scale into altcoin positions cautiously.
- Use the channel low as a stop-loss zone.
- Look for confirmation over the next 1–2 weeks with bullish candles or increased volume.
Happy Trading,
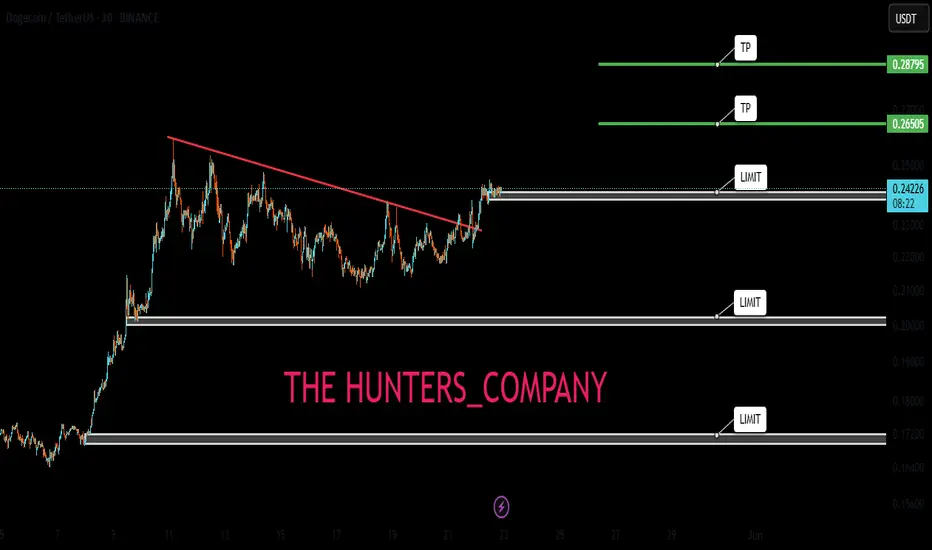
DOGECOIN (FREE SIGNAL)Hello friends
Given the good growth we had, the price has corrected and now is a good time to buy step by step and with capital management...
We have specified the purchase steps for you and the target is also specified...
*Trade safely with us*
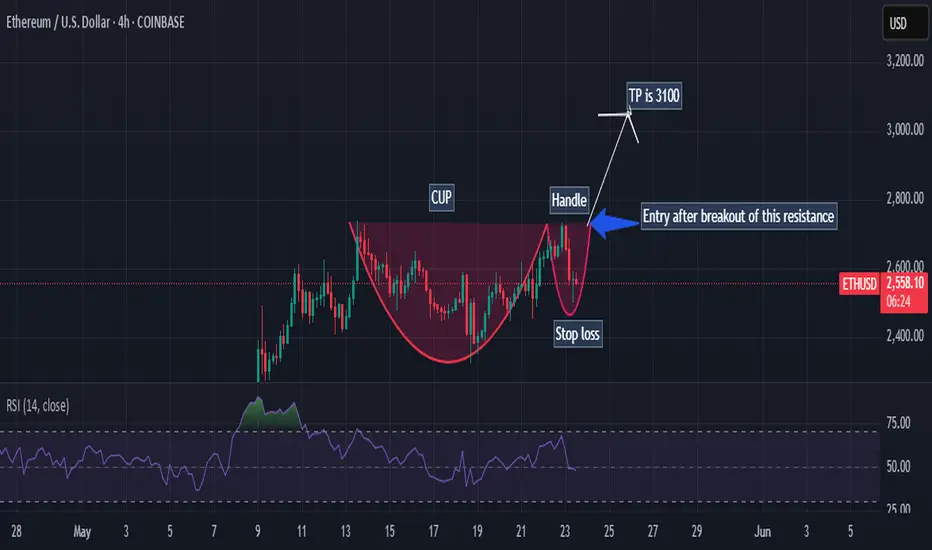
ETHUSDT IDEAThings still looks inside a consolidation phase and some breaks upside or downside is needed for long momentum trades.

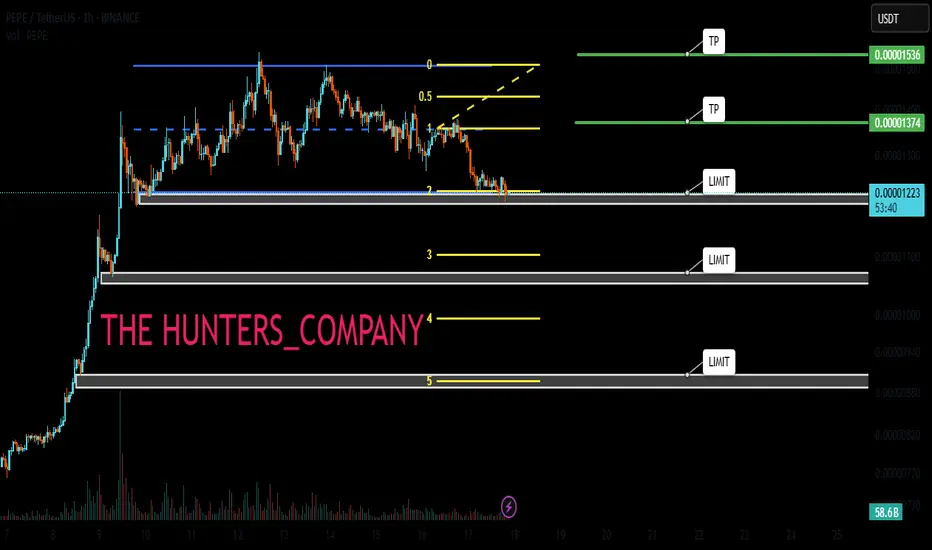
PEPE AGAIN!!!Hello friends
Considering the good growth we had, you can see that the price has made a correction and entered a range after reaching its ceiling.
Now, with the price correction, there is a good opportunity to buy in a pipeline and with capital management and move with it to the specified goals.
*Trade safely with us*
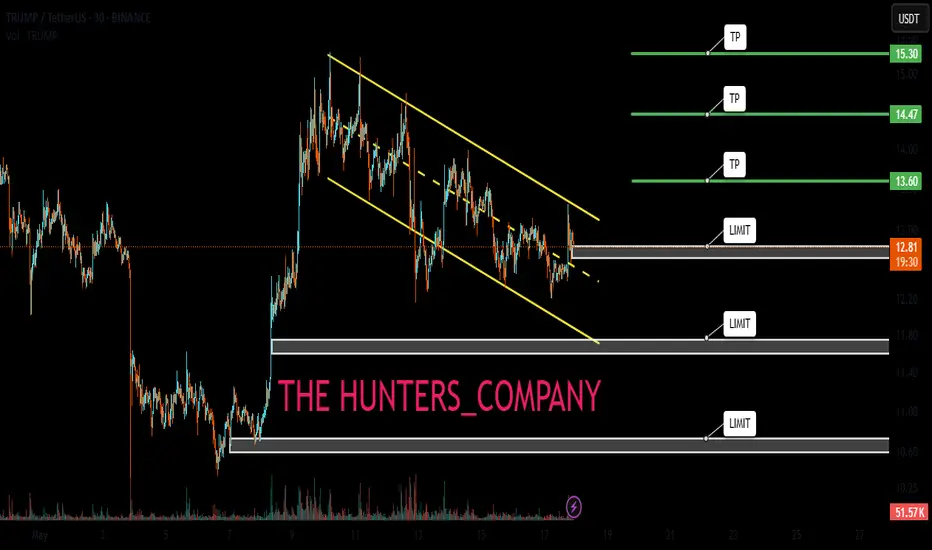
TRUMPPPPPPPPPPPPPPPPPPPHello friends
Considering the good growth we had, you can see that the price formed a flag and corrected after reaching its ceiling.
Now, with the price correction, there is a good opportunity to buy in stages and with capital management and move towards the specified goals.
*Trade safely with us*
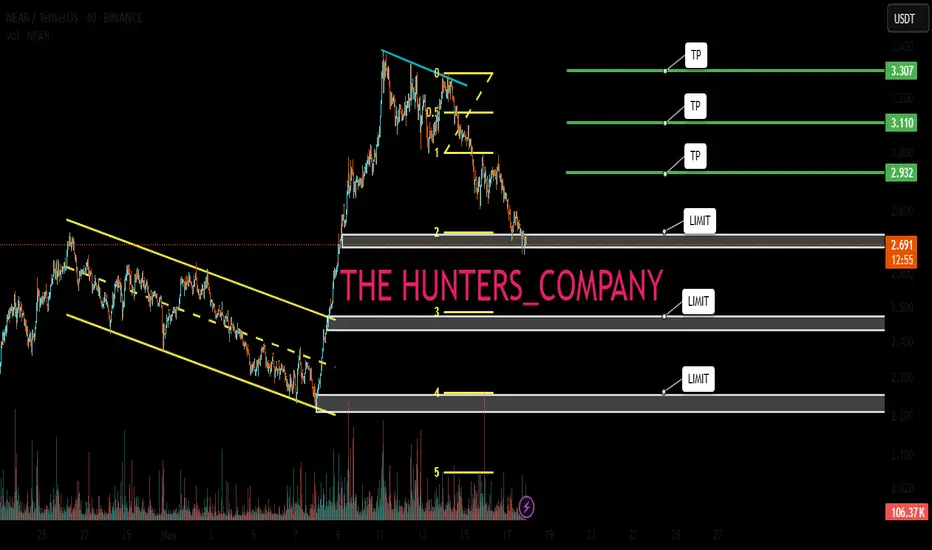
NEAR NEAR NEAR Hello friends
Considering the good growth we had, you can see that the price has corrected after reaching its ceiling.
Now, with the price correction, there is a good opportunity to buy in stages and with capital management and move towards the specified goals.
*Trade safely with us*
BITCOIN : FREE SIGNAL (DON'T MISS)Hello friends
According to the upward trend we had, you can see that the price is stuck in a channel and after the third collision with the channel ceiling, it has managed to break the channel, which indicates the power of buyers and you can buy within the specified support ranges with capital and risk management and move with it to the upcoming goals.
*Trade safely with us*
DOGS : be carefulHello friends
As you can see, after the price growth we had, the price has fallen. Given the severity of the fall, we recommend that you buy in stages, manage your risk and capital, and move with it to the specified goals.
*Trade safely with us*
