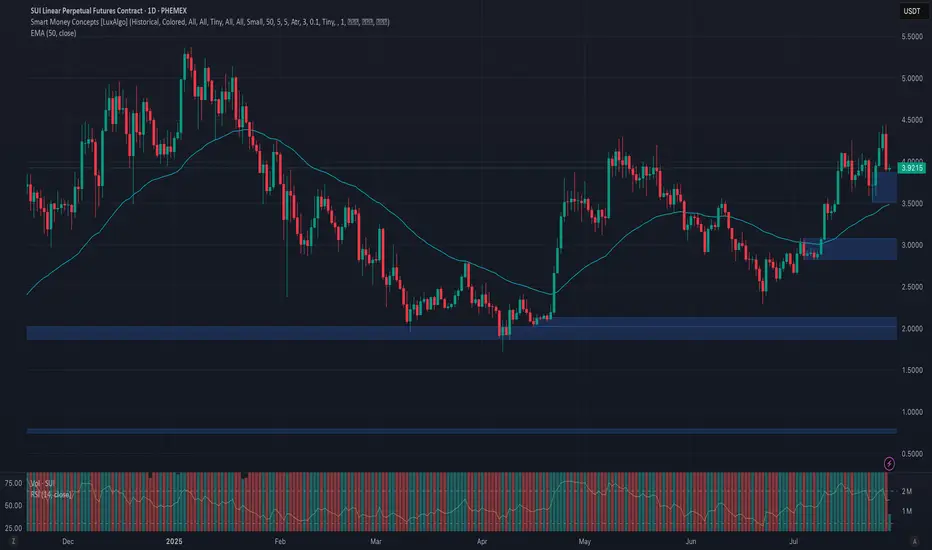
Phemex Analysis #100: Pro Tips for Trading Sui (SUI)Sui ( PHEMEX:SUIUSDT.P ) has swiftly emerged as one of the most promising Layer 1 blockchains, well-known for its focus on scalability, high throughput, and developer-friendly infrastructure. Recently, Sui has attracted significant attention thanks to its growing DeFi ecosystem, strategic partnerships, and community enthusiasm.
Over the past 2 weeks, SUI showed robust bullish activity, rising more than 30% to break key resistance around $4.3, and it’s now trading at around $3.9. The current price action indicates a potential continuation of bullish momentum, yet traders remain cautious about possible retracements and volatility.
Let’s carefully examine a few likely scenarios for SUI and determine how traders can capitalize strategically.
Possible Scenarios
1. Short-term Retracement (Healthy Pullback)
Following the recent rapid price rise, SUI might experience a short-term correction toward previous resistance-turned-support near $3.6. A low-volume retracement to this level could represent a healthy pause before the next bullish leg.
Pro Tips:
Buying the Dip: Closely watch support around $3.6; a successful retest on lower volume could present an ideal buying opportunity.
Volume Monitoring: Pay close attention to volume levels during the pullback—a low-volume dip indicates healthy profit-taking rather than bearish reversal.
2. Bullish Breakout (Pushing Higher!)
If SUI maintains bullish momentum and successfully holds above recent support around $3.8, it may continue to target higher resistance levels. Strong buying volume accompanying further gains could send SUI towards key resistance zones around $5.0 and potentially breaking previous all-time-high $5.37.
Pro Tips:
Entry Signals: Consider buying positions on a high-volume breakout confirmation above $4.45, signaling bullish continuation.
Profit Targets: Plan partial profit-taking around $5.0 and $5.37 resistance zones to lock in gains.
3. Bearish Scenario (Deeper Correction)
If broader market sentiment turns negative or if buying volume significantly weakens, SUI could break below $3.6, signaling bearish pressure. In this scenario, deeper corrections towards support levels at $2.8 or potentially $2.3 may occur.
Pro Tips:
Short Opportunities: Experienced traders could consider shorting or reducing exposure if SUI decisively breaks below the key $3.6 support level on increased selling volume.
Accumulation Strategy: Long-term investors can strategically accumulate positions near stronger support zones around $2.8 and $2.3 after confirming price stabilization.
Conclusion
Sui (SUI) currently offers compelling trading opportunities driven by recent bullish activity and increasing ecosystem growth. Traders should stay alert for critical breakout levels ($4.45) and monitor essential support areas ($3.6) closely. By applying disciplined trading approaches, setting clear profit targets, and managing risk prudently, traders can navigate SUI’s volatility with greater confidence and potentially maximize gains.
🔥 Tips:
Armed Your Trading Arsenal with advanced tools like multiple watchlists, basket orders, and real-time strategy adjustments at Phemex. Our USDT-based scaled orders give you precise control over your risk, while iceberg orders provide stealthy execution.
Disclaimer: This is NOT financial or investment advice. Please conduct your own research (DYOR). Phemex is not responsible, directly or indirectly, for any damage or loss incurred or claimed to be caused by or in association with the use of or reliance on any content, goods, or services mentioned in this article.
Cryptomarket
Bullish bounce off swing low support?The Bitcoin (BTC/USD) is falling towards the pivot and could bounce to the 1st resistance.
Pivot: 115,415.51
1st Support: 113,466.96
1st Resistance: 120,573.43
Risk Warning:
Trading Forex and CFDs carries a high level of risk to your capital and you should only trade with money you can afford to lose. Trading Forex and CFDs may not be suitable for all investors, so please ensure that you fully understand the risks involved and seek independent advice if necessary.
Disclaimer:
The above opinions given constitute general market commentary, and do not constitute the opinion or advice of IC Markets or any form of personal or investment advice.
Any opinions, news, research, analyses, prices, other information, or links to third-party sites contained on this website are provided on an "as-is" basis, are intended only to be informative, is not an advice nor a recommendation, nor research, or a record of our trading prices, or an offer of, or solicitation for a transaction in any financial instrument and thus should not be treated as such. The information provided does not involve any specific investment objectives, financial situation and needs of any specific person who may receive it. Please be aware, that past performance is not a reliable indicator of future performance and/or results. Past Performance or Forward-looking scenarios based upon the reasonable beliefs of the third-party provider are not a guarantee of future performance. Actual results may differ materially from those anticipated in forward-looking or past performance statements. IC Markets makes no representation or warranty and assumes no liability as to the accuracy or completeness of the information provided, nor any loss arising from any investment based on a recommendation, forecast or any information supplied by any third-party.

XRP: PullbackRipple’s XRP has once again seen a significant pullback since last Monday, raising the possibility that the high of turquoise wave B may already be in. For now, however, we continue to allow room for this corrective move to extend up to resistance at $4.09, before turquoise wave C drives the altcoin lower toward the magenta wave (2) low. With XRP still trading well above the $0.38 support level, the next upward impulse—magenta wave (3)—should then begin to take shape. Alternatively, there is a 33% chance that this bullish move has already started; however, this scenario would only be confirmed by a decisive break above the $4.09 level.
📈 Over 190 precise analyses, clear entry points, and defined Target Zones - that's what we do (for more: look to the right).

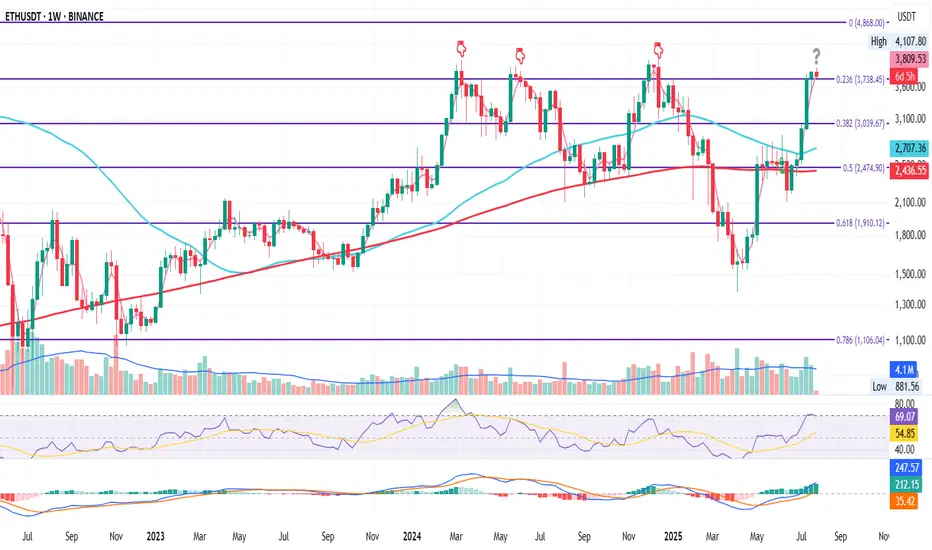
ETH Weekly Flip ZoneETH on the Weekly
ETH just closed the week above the 0.236 Fib level at $3738.45.
It’s the fourth attempt to conquer this zone since the June 2022 bottom.
If price holds above this level, the odds of continuation increase.
If it fails, we could see downside.
It may also just consolidate here for a while.
RSI just touched overbought, and MACD remains green — still some room for upside.
I remain bullish long term, but this looks like a smart area to manage risk if you’re late to the move, or take partial profits.
Always take profits and manage risk.
Interaction is welcome.
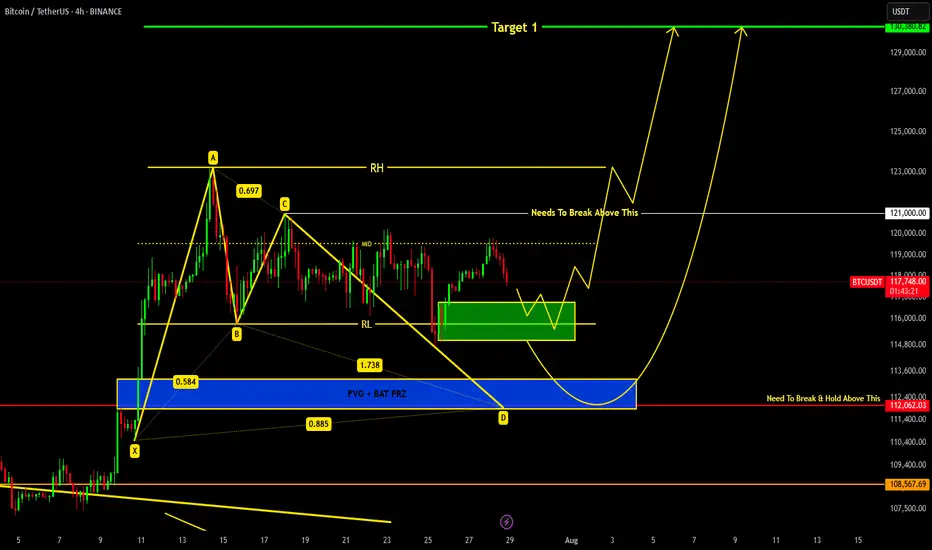
BITCOIN Current Update !!!we are heading towards support region around 116.8k-115k from where we can expect a reversal.
If price breaks down 115k level then a bat harmonic pattern is also forming which indicates it's PRZ at 113-112k region...
Remember 121k is key level which needs to be broken in order to remain bullish !!!
ETH Dominance Eyes 12.60%ETH.D on the Daily
Next resistance is approaching near the 0.236 Fib level, around 12.60%.
In my view, this level will eventually flip to support — but it may take time. Price could need a retest, or wait for the 50MA (maybe even the 200MA) to assist the breakout.
Either way, we’ll be here to watch it unfold.
Always take profits and manage risk.
Interaction is welcome.

BTC.D Stuck in the MiddleThis is BTC.D on the daily
After losing the 50MA in the final days of the first half of the month, BTC dominance found support at the 0.382 Fib level, only to bounce back up and get rejected at 62.25%.
From here, it all depends on which level breaks first: the 0.382 support or the 62.25% resistance.
Whichever way it goes, we’ll be here to watch it unfold.
Always take profits and manage risk.
Interaction is welcome.

From Rejections to Breakout? CAKE Faces Key TrendlineNASDAQ:CAKE has been stuck in a long-term downtrend, constantly getting rejected from that falling red trendline.
But things are starting to shift...
After bouncing off the major support zone, price is once again pushing toward that trendline, and this time, momentum looks stronger.
If CAKE can break and hold above this level, we could finally see a powerful move toward the $5+ resistance zone.
Just a heads-up: it’s been rejected here before, so let the breakout confirm before getting too excited.
DYOR, NFA

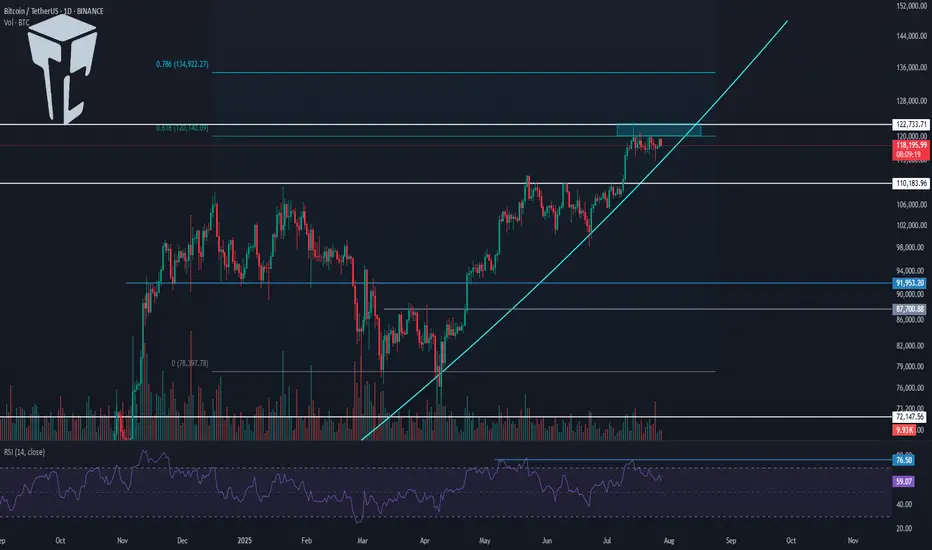
TradeCityPro | Bitcoin Daily Analysis #138👋 Welcome to TradeCity Pro!
Let’s get into the Bitcoin analysis. Today is the start of the week, and it’s very important to begin our trading week with the right analysis and outlook.
📅 Daily Timeframe
On the daily timeframe, as you can see, not much has changed compared to the previous analysis, and the price is still ranging near the supply zone.
✔️ The fact that no price correction has occurred so far shows the strength of the buyers, and even if a correction does happen, as long as the price stays above 110183, the trend will still be considered bullish.
🧩 The main trigger for trend continuation is either the price reaction to the curved trendline or the break of 122733. We can find more optimal triggers in the lower timeframes.
⏳ 4-Hour Timeframe
In this 4-hour timeframe, after a fakeout below 116829, the price corrected down to the 0.5 Fibonacci level and now has returned again to the box between 116829 and 120041.
🔍 The fakeout trigger is 120041, and I’ll try to have at least two positions open in the market when this level breaks — whether on Bitcoin or altcoins.
📈 The main trigger for the next bullish leg is 122733.
If RSI also breaks the 61.67 resistance alongside 120041, the likelihood of the move continuing will increase.
❌ Disclaimer ❌
Trading futures is highly risky and dangerous. If you're not an expert, these triggers may not be suitable for you. You should first learn risk and capital management. You can also use the educational content from this channel.
Finally, these triggers reflect my personal opinions on price action, and the market may move completely against this analysis. So, do your own research before opening any position.
New Week New High for ETH
It’s just the start of the week, and ETH is already printing new highs.
But let’s zoom in on a familiar pattern in price action:
During the week of June 30 – July 7, ETH floated above the 0.5 Fib and the 200MA early in the week. Then it dipped below both levels, only to bounce back and start holding the Fib as sup
port. From there, price slowly climbed alongside the 200MA, bouncing off it a few times, then it took off.
Last week showed a similar setup, this time around the 0.236 Fib and 200MA.
Now both levels are sitting close together again. So, we might see another dip below them before ETH pushes higher.
Of course, if price fails to reclaim the zone, more downside could follow.
But as always: we’ll be here to watch it unfold.
Always take profits and manage risk.
Interaction is welcome.
Bitcoin Versus ETH daily charts- one is VERY BULLISH
No Guesses which one.
Bitcoin printing a Bullish pennant on the daily with the Apex late this Wednesday, After the FED tell us what they are doing with interest rates
PA always reacts before the Apex.
ETh on the other hand, is under a Huge area of long therm resistance and running out of steam
If we zoom out to the weekly, we can see how long this line has rejected PA
My money remains in Bitcoin, whihc has also made gains over the weekend.
And is highly likley to remain there
OP - Chance for +70%After weekly close we can see the volume coming in. On the chart we have resistance which if we break through then we can expect price 1.4 which is +70% from now.
If I have some advice for leverage trading I think its better to wait for daily close and then hunt retest if happens.
Rotations of money started already and I don't think is it a case for long run. We need to act, take profit and watch something else.
Like if you like analysis and idea.
Ivan

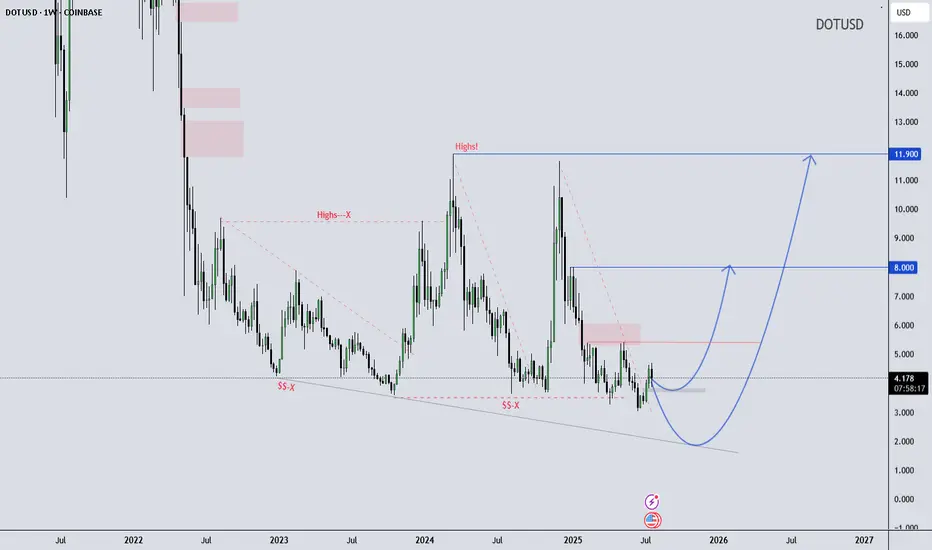
DOT/USD Weekly Structure - - Reversal Possibility Developing DOT/USD Weekly Outlook – Educational Perspective
Polkadot (DOT) is trading near the lower boundary of a long-term falling wedge structure, showing early signs of stabilization around the $4.20 support zone. Price has respected this level multiple times, potentially forming a rounded bottom, which often suggests shifting momentum.
If the structure holds, it may continue developing a macro reversal pattern. This kind of formation is typically monitored by swing traders looking for high risk-reward setups in longer timeframes.
Key Technical Levels to Watch:
$8.00 – Mid-range structural resistance
$11.90 – Historical supply / macro pivot zone
This chart is shared for educational purposes only to support market structure learning. Always follow your own analysis and risk management plan.
Wave Trader Pro
Learn & Earn
BTC on 4H
"Hello, focusing on BTC on the 4-hour chart, the price is currently in a bullish momentum on higher time frames. However, it is showing signals indicating a potential completion of its pullback to the $110,000 zone. In my opinion, the $122,000 zone could be a good area to consider a sell position, with confirmation on the 15-minute chart. I plan to wait for this zone and then decide on initiating a sell position. If you have any updates or alternative perspectives on this analysis, please feel free to share."
If you need further clarification or have more details to discuss, please let me know!

Bullish continuation?The Bitcoin (BTC/USD) has bounced off the pivot and could rise to the 1st resistance.
Pivot: 116,724.27
1st Support: 111,336.90
1st Resistance: 123,341.37
Risk Warning:
Trading Forex and CFDs carries a high level of risk to your capital and you should only trade with money you can afford to lose. Trading Forex and CFDs may not be suitable for all investors, so please ensure that you fully understand the risks involved and seek independent advice if necessary.
Disclaimer:
The above opinions given constitute general market commentary, and do not constitute the opinion or advice of IC Markets or any form of personal or investment advice.
Any opinions, news, research, analyses, prices, other information, or links to third-party sites contained on this website are provided on an "as-is" basis, are intended only to be informative, is not an advice nor a recommendation, nor research, or a record of our trading prices, or an offer of, or solicitation for a transaction in any financial instrument and thus should not be treated as such. The information provided does not involve any specific investment objectives, financial situation and needs of any specific person who may receive it. Please be aware, that past performance is not a reliable indicator of future performance and/or results. Past Performance or Forward-looking scenarios based upon the reasonable beliefs of the third-party provider are not a guarantee of future performance. Actual results may differ materially from those anticipated in forward-looking or past performance statements. IC Markets makes no representation or warranty and assumes no liability as to the accuracy or completeness of the information provided, nor any loss arising from any investment based on a recommendation, forecast or any information supplied by any third-party.

Ethereum Weekly Recap & Gameplan | 27.07.2025📈 Market Context:
ETH followed the broader crypto market momentum led by Bitcoin, supported by institutional demand and positive macro policies in the U.S.
Last week’s plan played out cleanly — we saw strong gains from the 1H demand zone.
🧾 Weekly Recap:
• Price swept 4H swing liquidity and formed a 1H bullish BOS
• Created a solid 1H demand zone, from which price bounced strongly
• Momentum remained bullish as forecasted in last week’s post
📌 Technical Outlook:
→ Expecting a short retracement into 4H liquidity levels around 3761$ or 3702$
→ Then a continuation move towards ATH zone
🎯 Setup Trigger:
What I’m watching:
✅ Sweep of 4H liquidity
✅ Bullish BOS on 15M–30M
→ This will serve as the confirmation for long entries
📋 Trade Management:
• Stoploss: Below the confirmation swing low
• Target: 4100$
💬 If you found this helpful, don’t forget to like, comment, and follow — I share setups like this every week!

ENA Explodes After Breakout – What’s Next?
ENA Exploded 100%+ After Our Post 🚀
Just days ago, we highlighted ENA as one to watch — and it delivered.
Since then, price has nearly doubled, breaking past key resistance with strong volume and momentum.
This is why timing + conviction matters. When the setup is clean, the move speaks for itself.

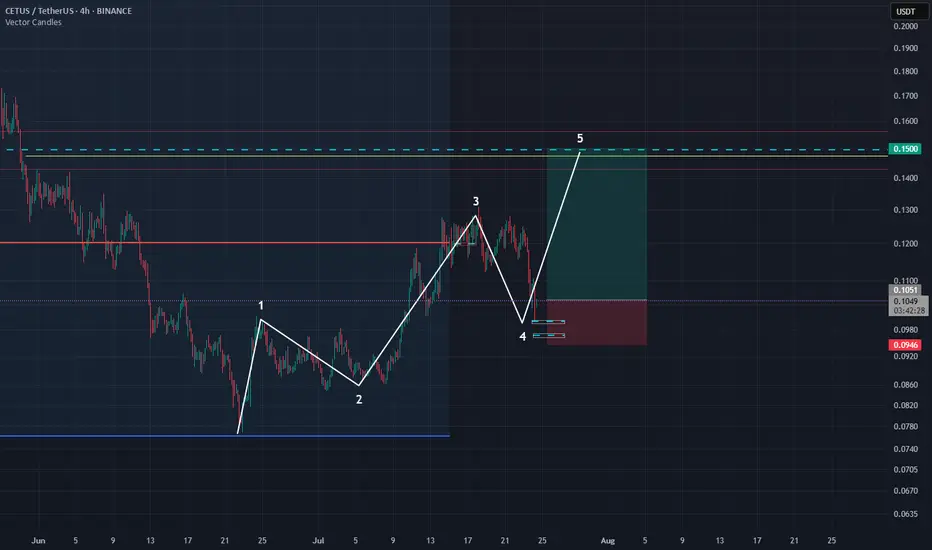
Cetus long setup, RR 4 There is big chance for leverage 3-4 if you want to try this coin. Invalidation is bellow if we looking based on Elliot wave theory.
Be aware if Bitcoin try to corrective more we will have deeper retracement.
We have one more zone bellow so if you want to try second zone, invalidation is the same but you can take much higher leverage
Ivan
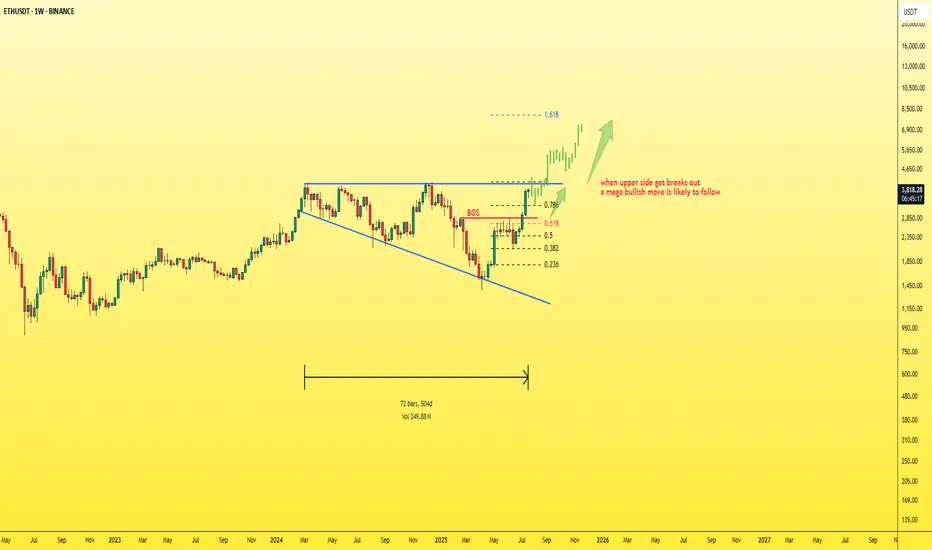
ETH - simple chart and mega moveEthereum is currently the strongest and most stable asset in the market, especially after many had lost hope in it.
Now, Ethereum is back with strength, and it’s just a few steps away from breaking out of the current pattern.
📈A breakout above the upper boundary will likely lead to a new all-time high (ATH) for ETH.
My projection: Ethereum could surpass $7,000 before the end of 2025.
Best regards:
Ceciliones🎯
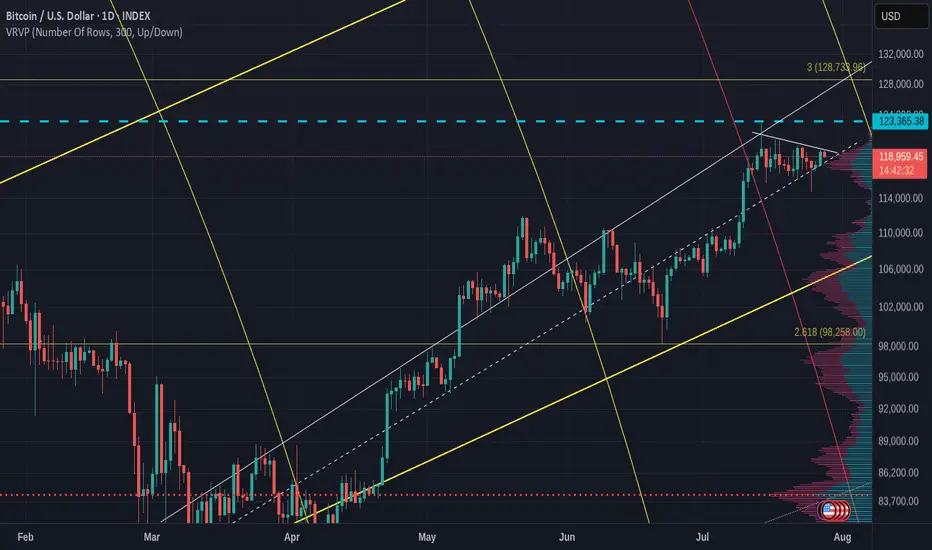
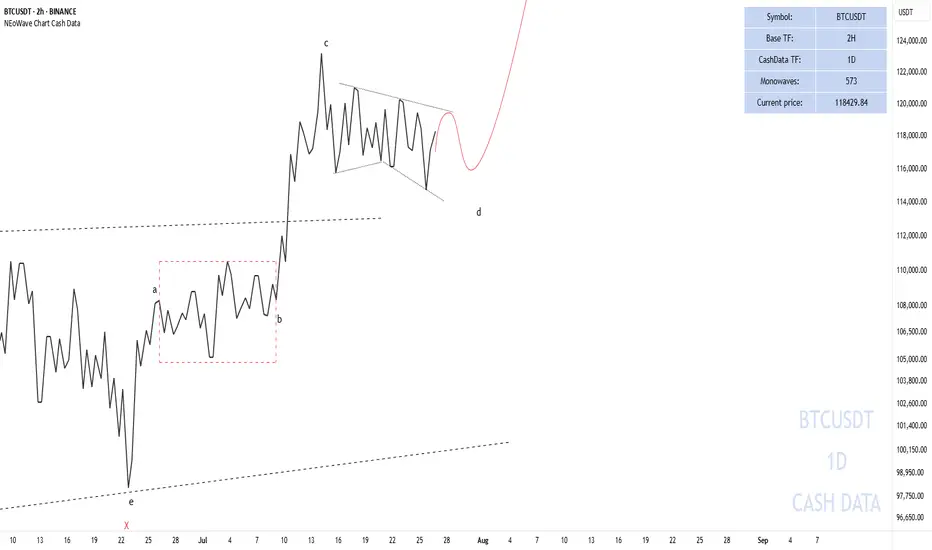
Pessimistic scenario for BITCOINAfter Bitcoin touched the price of 123,218, it entered a corrective phase. According to previous analysis, we expected the price to touch the range of $115,000-113,000. With the formation of more waves, it seems that the recent correction that started on July 14, 2025 is a diametric (bowtie) where waves f and g of this diametric are not yet complete and this pattern is part of a higher degree diametric and after this pattern is completed I expect a move towards the range of 140,000-150,000
Pessimistic scenario:
The pessimistic scenario is that this wave becomes a double pattern and enters the price range of wave-b (marked with a red dashed line) of the higher degree diametric. The probability of this scenario occurring is low and I consider the first scenario more likely, but we must be prepared for all market movements.
Good luck
NEoWave Chart
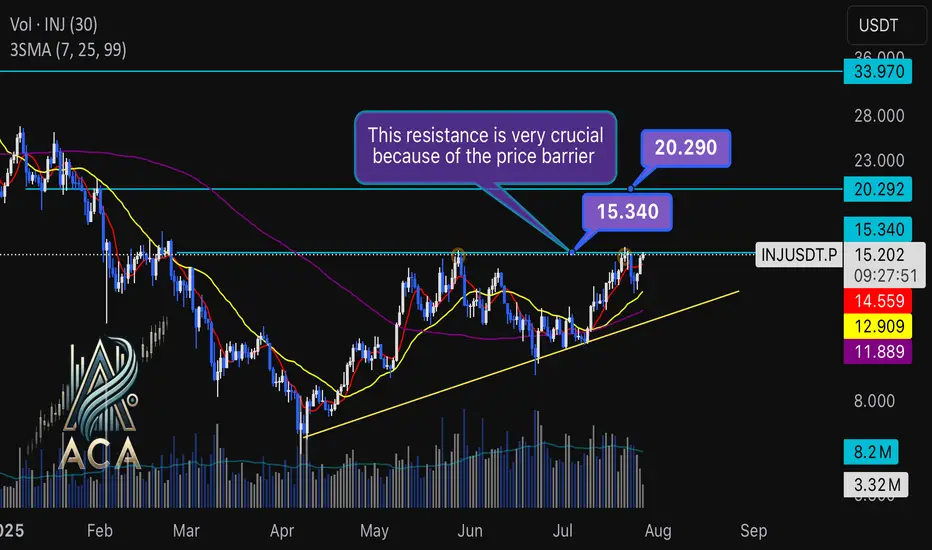
INJUSDT Daily Chart Analysis | Uptrend Brewing at Crucial LevelINJUSDT Daily Chart Analysis | Uptrend Brewing at Crucial Resistance
🔍 Let’s break down the INJ/USDT setup, examining its technical structure and mapping out key opportunities as it gears up for a decisive move.
⏳ Daily Overview
The INJUSDT pair is forming a solid bullish structure, supported by a clear ascending triangle pattern on the daily timeframe. Notably, the 3SMA (7, 25, 99) are crossing to the upside, signaling the early stage of a potential upward trend. This momentum is reinforced by the ascending triangle’s rising trendline, showing steady accumulation and higher lows.
🔺 Bullish Scenario:
Price is consolidating just below the critical resistance at $15.340—a key zone highlighted by multiple rejections in recent months. A confirmed breakout above this level, especially if backed by a surge in volume, would not only trigger a triangle breakout but also complete the weekly candle formation as a bullish hammer, strengthening the bullish case.
If this breakout sustains, short-term targets line up at $20.290, with the long-term roadmap pointing toward $33.970.
📊 Key Highlights:
- 3SMA (7, 25, 99) MA cross signals the beginning of an upward trend.
- Daily ascending triangle points to persistent bullish pressure.
- $15.340 remains a crucial resistance; price has tested and failed here twice before.
- Breakout confirmation (with volume) could ignite a rapid move to $20.290.
- Failure to break may result in another retest of the triangle’s trendline support.
🚨 Conclusion:
All eyes are on the $15.340 resistance. Wait for clear daily close and volume confirmation before entering. A successful breakout aligns with a bullish weekly hammer and could trigger the next phase higher. Beware of fakeouts, as rejection at resistance could send INJUSDT to retest lower trendline zones.
Stay sharp and plan your entries wisely!
Closing the Week on ETH 1H
ETH is about to close the week just above the 0.236 Fib level.
The 50MA is crossing this key level, and the 200MA is close behind — showing alignment across moving averages.
MLR > SMA > BB Center confirms the current uptrend.
Volume is picking up slightly, though it’s Sunday — so expectations remain tempered.
RSI is nearing overbought but still has room to push higher.
MACD supports the bullish momentum.
Taken together, these signs lean bullish for the weekly close.
But this is crypto — and anything can happen in the final hours.
We’ll be here to watch it unfold.
Always take profits and manage risk.
Interaction is welcome.

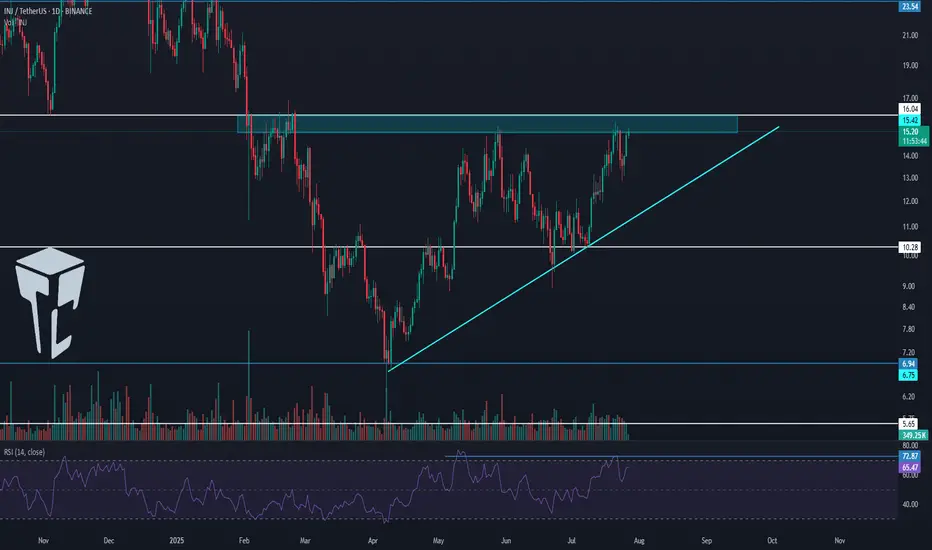
TradeCityPro | INJ Battles Key Resistance Amid Altseason Buzz👋 Welcome to TradeCity Pro!
In this analysis, I want to review the INJ coin for you. It’s one of the RWA and AI projects, currently ranked 63 on CoinMarketCap with a market cap of $1.51 billion.
📅 Daily Timeframe
On the daily timeframe, after a drop to the 6.94 level, this coin has bounced back and is now moving upward along with a rising trendline.
✨ A strong support has formed at 10.28, and after price reacted to this level, a new bullish leg started and pushed the price up to 16.04.
🔔 There is a Maker Seller zone around 16.04 that has repeatedly prevented the continuation of the upward move, and currently price is struggling with it again.
📈 Breaking this zone will initiate a new phase of the trend. I plan to have a long position open if 16.04 is broken.
🛒 This trigger is also suitable for spot buying, and if Bitcoin pair and Bitcoin dominance confirm the move, we can consider buying in spot too. But personally, I prefer opening a futures position.
💥 Breaking the 72.87 zone on the RSI will be a solid confirmation for the entry of bullish momentum, and with this breakout, a new bullish leg can begin.
🔽 If a correction happens, I will wait for the trendline to break and will not open a short position for now.
Currently, the first trigger we have for a short is at 10.28.
📝 Final Thoughts
This analysis reflects our opinions and is not financial advice.
Share your thoughts in the comments, and don’t forget to share this analysis with your friends! ❤️