Senate Advances Stablecoin Bill, JPMorgan Backs Bitcoin AccessFundamental approach
- The US Senate has cleared the GENIUS Act, its long-awaited stablecoin framework, after marathon talks. A final vote is expected after the Memorial Day break (26 May).
- JPMorgan Chase CEO Dimon says the bank will soon allow clients to trade bitcoin through third-party custody, adding fresh tailwinds to institutional demand.
- Spot-bitcoin ETFs are on track for a sixth straight week of net inflows, reinforcing the bid beneath prices.
Technical approach:
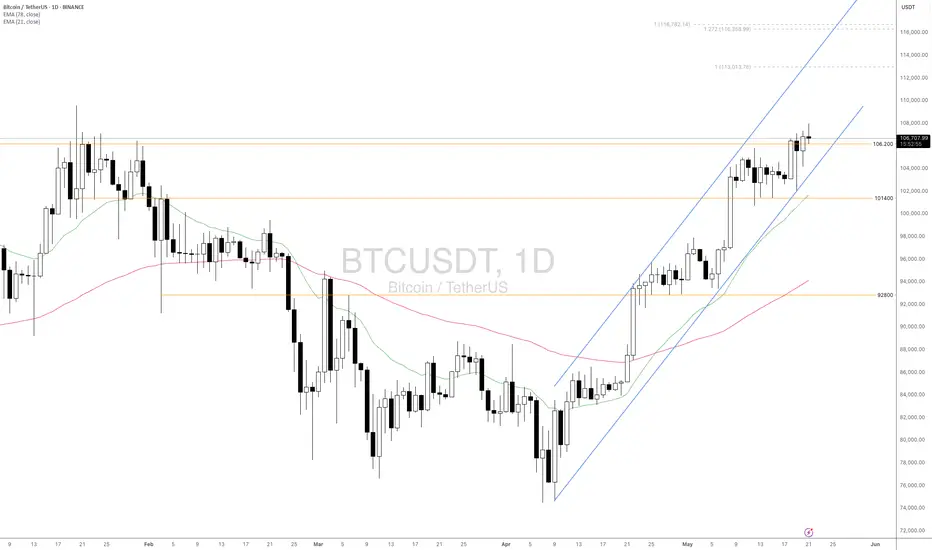
- Price is probing resistance at 106200 within a well-defined rising channel. The widening spread between both EMAs underscores building bullish momentum.
- A decisive close above 107000 opens the door to 113000.
- On the contrary, a drop through the support at 101400 would lead to a deeper correction to around the following support at 93000.
Analysis by: Dat Tong, Senior Financial Markets Strategist at Exness
Cryptomarket
THETAUSDT: Strong Fundamentals, Bullish Technicals: What’s Next?Hello Everyone!
In this idea, I’ll break down BINANCE:THETAUSDT from both a fundamental and technical perspective. The goal is to uncover whether THETA presents a real opportunity or if it’s just another altcoin market noise.
1. Fundamental Analysis
I’m bullish on THETA not only for its technical setup but also for its strong fundamentals:
- AI Integration Advantage: THETA is carving out a niche in the AI and decentralized video infrastructure space which is a sector currently enjoying massive global attention and investment. This AI focus gives THETA a competitive edge in a rapidly evolving industry.
- Tokenomics: THETA has a maximum and circulating supply of 1 billion tokens , which is relatively no inflationary token.
- Upcoming Catalyst : EdgeCloud Beta Launch : A major catalyst is scheduled for June 25 , with the beta launch of THETA’s EdgeCloud platform. This development could generate renewed investor interest and media attention.
- Active Transparent Team : THETA’s team is known for being highly active and continuously forming strategic partnerships, which reinforces long-term credibility and ecosystem growth.
2. Technical Analysis
On Weekly timeframe
- THETA has recently made an upward move from a strong demand zone , showing clear signs of buyer interest. Notably, it didn't break below its 2023 bottom , which reinforces a bullish structure and suggests that the long-term support is holding firm.
- Additionally, the MACD is on the verge of a bullish crossover, signaling a potential shift in momentum. If confirmed.
On 4D timeframe
- THETA also bounced off a PD Array, specifically a Fair Value Gap (FVG) , which often acts as a high-probability reaction zone in ICT . Adding to the bullish confluence, it closed a previous 4-day candle with strength , confirming bullish intent and showing institutional interest may be stepping in at this level.
- THETA is currently targeting the next PD Array — a swing point around $1.08 . If price sweeps this level with strength, the next potential target lies around $1.311 , aligning with the next major liquidity zone .
On 4H timeframe
- For bullish momentum to truly build, THETA must break above the key resistance zone at $0.93 . This level has acted as a supply barrier, and a clean breakout could trigger increased buying pressure.
- On the Cumulative Volume Delta (CVD) , there's a bullish divergence forming — a strong indication that buying interest.
In conclusion, THETA/USDT is showing promising signs both technically and fundamentally. The bounce from a key demand zone, bullish divergence on CVD, and a potential MACD crossover suggest momentum may be shifting in favor of bulls. If price breaks above the $0.93 resistance , we could see a move toward $1.311 .
On the fundamental side, THETA’s involvement in the booming AI sector, capped supply, upcoming EdgeCloud beta launch (June 25), and an active development team provide strong long-term potential.
As always, manage risk wisely and monitor key levels for confirmation.

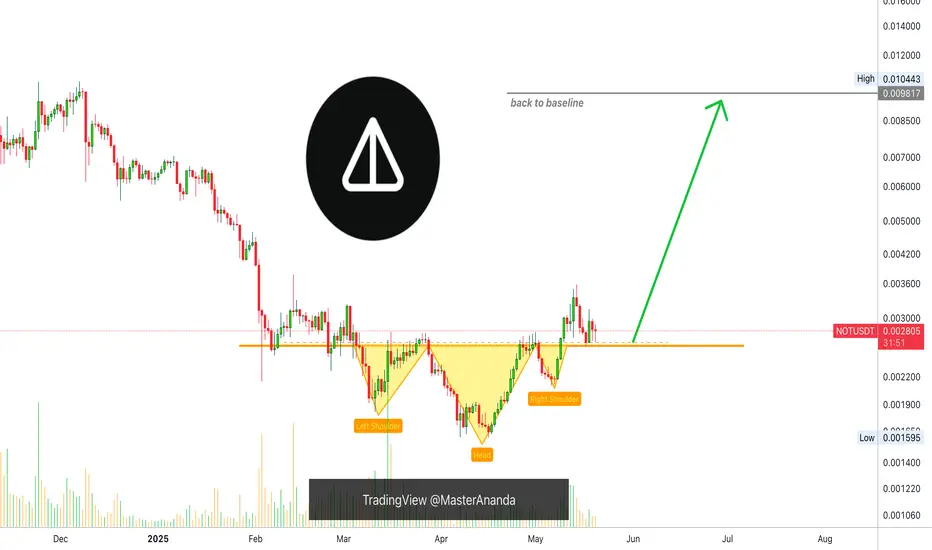
Notcoin Inverted Head & Shoulders (PP: 250% Easy)This is a different view of the chart. The iH&S (inverted head and shoulders) pattern is a reversal pattern. The breakout above the neckline and retest as support fully confirms the bullish bias.
Notcoin is bullish confirmed. The bottom is in based on this pattern and the retrace after the initial bullish breakout with support holding. This means that a major advance is to happen next.
The target I am showing on this one is the main target, "back to baseline," but this is not the end. This would be the minimum on the first impulse up. This target should reach fast and it is very strong because it would yield from current price a nice ~250% profits. More down the road.
This is a pair that you cannot miss, or you can.
This is a pair that looks good and is sure to grow incredibly strong in this 2025 bull market, that is why I continue to share it everyday.
There are many options of course, many great Altcoins, but some are just certain to grow strong. I am showing you some of everything, the ones that are certain I post more often. You can do great in this bullish cycle, I know.
You can do this and thanks a lot for the support and follow.
I will shower you with hundreds of unique charts and great content, great profits if you decide to follow trade/buy and hold. Buy now when prices are low. Sell later when we hit resistance on the way up. It is very easy. Easy if you trust. Trust the Master of the charts.
Namaste.
BTC/USD Eyes Breakout Analysis On Weekly Time Frame.Bitcoin (BTC/USD) Weekly Chart Analysis
After facing a long term resistance at 70,000$ which was significant barrier for Bitcoin in the past, breakout occurred recently, indicating a strong bullish signal and a shift in market structure.
BTC is currently trading around $103,025, facing a new resistance zone.
as the fundamental shows that it may break the resistance again after scalping and we may see the bitcoin at the 120,000$.
But the technical analysis indicates that we may see a retest her to validating the zone now as support.
After the breakout, BTC faced selling pressure around the $105,000–$110,000 range, creating a new resistance zone.
If the resistance is not breached, there is the possibility of a rejection occurring which may result in a retracement down to $79,902, which would be a 28.72% drop.
And i think From there if the resistance isn’t broken out of, then it’s most likely a rejection comes and we can expect a fall back to $79,902 which is a 28.72% retracement.
A breakout above the current resistance could trigger a 46% rally towards the $120,409 target.
This would continue the bullish trend post-breakout, supported by momentum and volume.
we will stay focused here and wait for the breakout of the resistance.
Bitcoin - All time highs will come next!Bitcoin - CRYPTO:BTCUSD - prepares a significant move:
(click chart above to see the in depth analysis👆🏻)
Over the past couple of months, we basically only saw sideways price action on Bitcoin. However, this does not mean, that Bitcoin is now slowing down; actually the opposite is true and Bitcoin is setting up for a major move higher. New all time highs will come very soon.
Levels to watch: $100.000
Keep your long term vision!
Philip (BasicTrading)

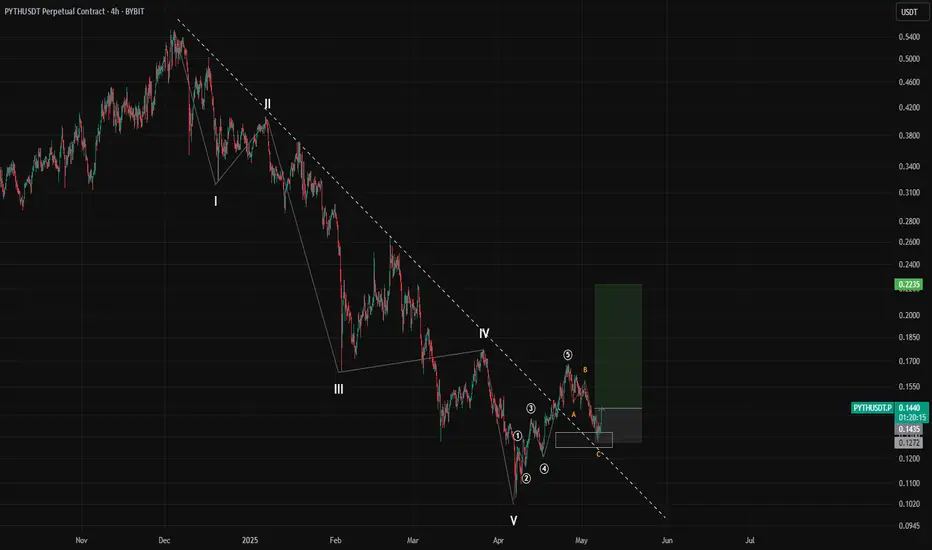
PYTH 4H ANALYSIS – Bullish Setup in PlayAfter completing a 5-wave impulse to the downside, PYTH has shown signs of a trend reversal. The first upward impulse displayed a clear 5-wave Elliott structure, breaking out of the descending channel — a strong bullish signal.
Following this, a classic A-B-C zig-zag correction occurred, which acted as a retest of the broken channel resistance, now turned support. This confluence increases the probability of a bullish continuation.
With market structure aligning and correction likely complete, PYTH is showing potential for a 50%+ move to the upside.
🟢 Entry Zone: 0.1400 – 0.1500
🔴 Stop Loss: 0.1272 (Below wave C & structural support)
🎯 Target Price: 0.2235
💡 Note: Always manage your risk and confirm with your own analysis before entering any trade.
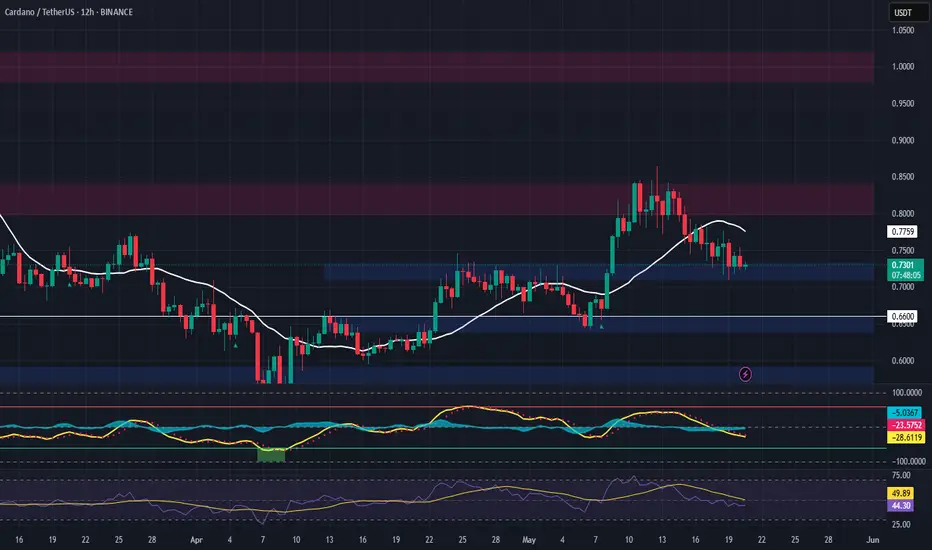
ADA (Cardano) – Long Swing Setup from Major Support ZoneADA is currently trading within a critical support area ($0.71–$0.73), offering a compelling higher low opportunity. With BTC holding strength, ADA may be gearing up for a rebound, particularly if it maintains structure above the support.
🔹 Entry Zone:
$0.71 – $0.73
🎯 Take Profit Targets:
🥇 $0.80 – $0.84
🥈 $0.98 – $1.02
🛑 Stop Loss:
Daily close below $0.66 (loss of higher low and structural invalidation)
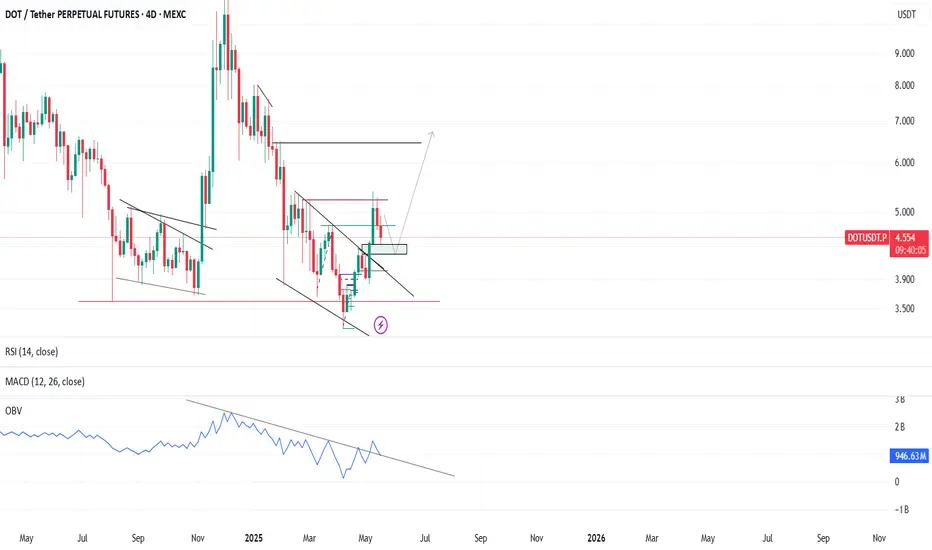
Polkadot (DOT/USDT) Ready to Explode? Full Technical Breakdown Hello everyone!
In today’s idea, I’ll be breaking down the technical analysis of BINANCE:DOTUSDT . I hope you find this analysis valuable and insightful for your trading decisions.
On weekly TF
- There was a huge liquidity sweep on the bottom of 4 AUG 2024 on APRIL 2025
- As shown in the chart above, the MACD has started to cross bullishly on 1W timeframe. The last time this occurred, DOT rallied by approximately 200%.
- Two weekly candles have closed above the previous high that led to the last bottom (around $4.772), signaling a market structure shift from bearish to bullish.
On 4D TF
- On the OBV , a downtrend line was broken, and a retest is currently in progress.
- There is a very important Fair Value Gap (FVG) being retested right now.
- Note: The 4D candle closes today. Monitor closely to see if it closes above the FVG — respect the FVG.
- A good potential entry zone is between $4.44 – $4.241.
In conclusion, DOT/USDT is showing promising bullish signals across higher timeframes, with a potential entry zone between $4.44 – $4.241. As always, manage your risk and wait for confirmation before entering. I’ll be watching the 4D close closely — stay sharp!
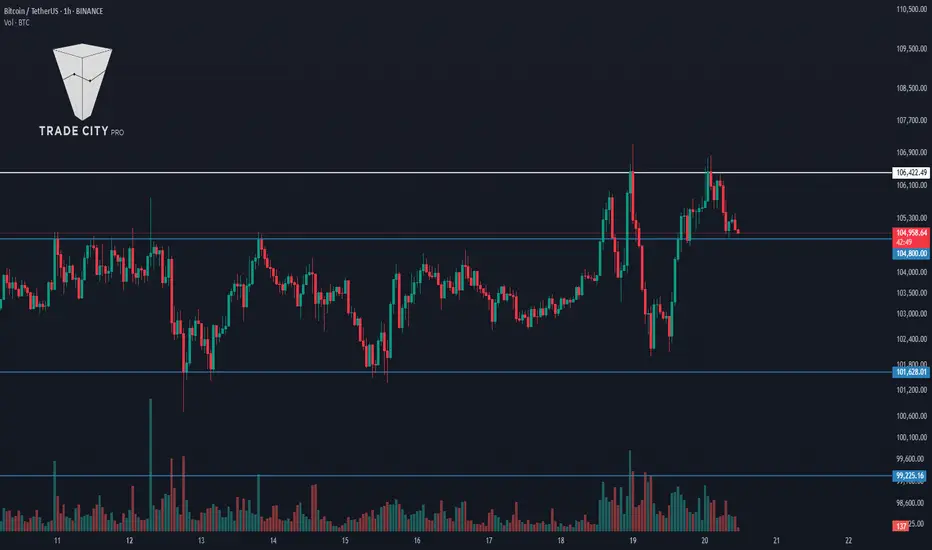
TradeCityPro | Bitcoin Daily Analysis #97👋 Welcome to TradeCity Pro!
Let’s go over the Bitcoin analysis and key crypto indices. As usual, I’ll be reviewing the triggers for the New York futures session.
⏳ 1-Hour Timeframe
As you can see, a Double Bottom pattern activated yesterday, and the price has returned to the 106422 zone.
✔️ We previously had a support at 102882, but since the price wasn’t respecting it consistently, I’ve removed it. If price shows solid support there again, I’ll reintroduce the level.
🔍 Currently, the first trigger for a long position is 106422. This is a highly critical level and represents the main resistance for Bitcoin. If it breaks, there’s a strong chance for a sharp upward move.
✨ The first support in the way is 104800, which isn’t very strong. If a correction occurs, this level is likely to break. The main support remains at 101628.
📈 A break below 101628 would confirm a bearish reversal, and we could even consider opening a short position. The next support below that would be at 99225.
📊 Market volume has significantly increased over the past few days. This spike in volume suggests that a sharp move is likely. Using our trigger levels, we’ll be able to determine whether it’s an upward or downward breakout.
👑 BTC.D Analysis
Bitcoin dominance is still below the 64.04 zone and appears to be consolidating.
💥 The 64.04 level is highly sensitive. A breakout would signal a bullish shift in dominance, while a rejection would suggest the downtrend will resume.
⚡️ We’ll get confirmation of further downside if 63.71 breaks. Below that, the next support levels are at 63.30 and 62.65.
📅 Total2 Analysis
Yesterday, Total2 reacted to the 1.16 support and moved upward to 1.20.
💫 A break above 1.20 today would confirm bullish continuation. A drop below 1.16, however, would confirm the continuation of a broader correction.
📅 USDT.D Analysis
Yesterday, the 4.70 level was faked out, and the chart fell back into the range box.
🎲 I believe the chances of breaking below the range bottom have increased. Key bearish triggers are at 4.57 and 4.51. On the flip side, another break above 4.70 would confirm renewed bullish momentum for USDT dominance.
❌ Disclaimer ❌
Trading futures is highly risky and dangerous. If you're not an expert, these triggers may not be suitable for you. You should first learn risk and capital management. You can also use the educational content from this channel.
Finally, these triggers reflect my personal opinions on price action, and the market may move completely against this analysis. So, do your own research before opening any position.
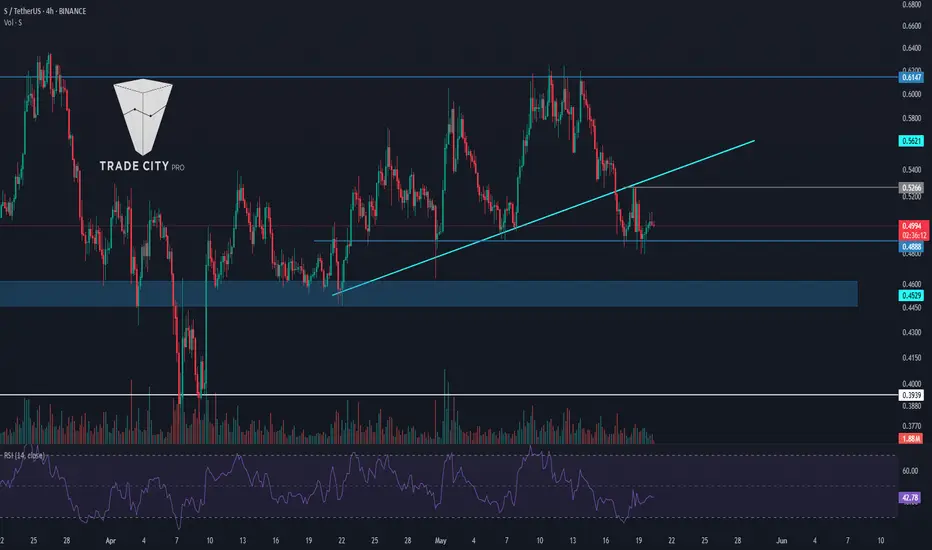
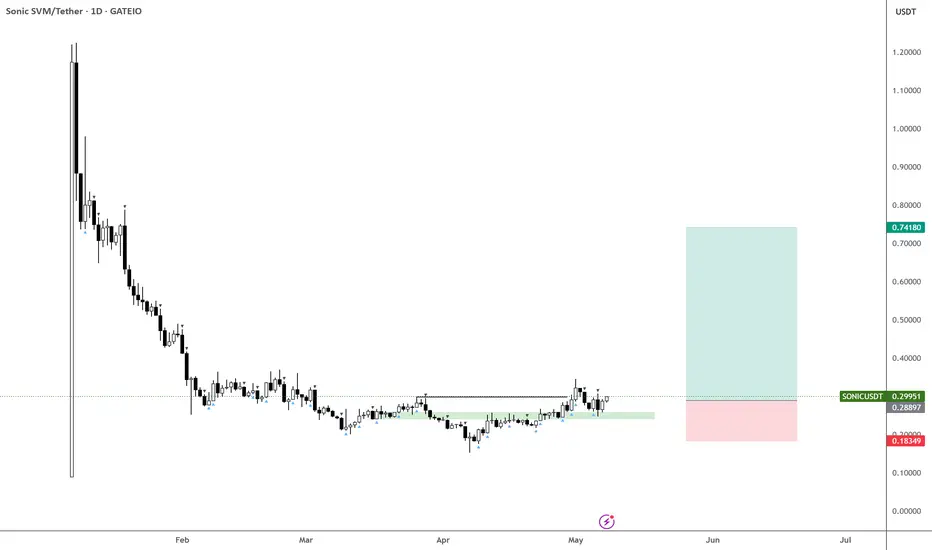
TradeCityPro | S: Trendline Break Signals Key Support Retest👋 Welcome to TradeCity Pro!
In this analysis, I’m going to review the S coin—one of the Layer 1 coins for the Sonic network.
💥 This coin currently holds a market cap of $1.43 billion and ranks 58th on CoinMarketCap.
⏳ 1-Hour Timeframe
On the 4-hour chart, as you can see, there’s a large range box between the 0.3939 and 0.6147 levels where price has been moving sideways.
🔍 A key support zone also exists between 0.45 and 0.46, which has received strong bullish reactions, pushing the price upward toward the 0.6147 top via a trendline.
✔️ Currently, this trendline has been broken, and a new support level has formed at 0.4888, which has been tested several times.
✨ If this 0.4888 level breaks, a short position targeting the 0.45 zone and 0.3939 becomes viable.
📈 For a long position, the first trigger is the 0.5266 level. A breakout here would confirm support at 0.4888 and open the path toward the 0.6147 resistance.
🎲 The RSI oscillator is hovering near the 50 level. A sustained move above this could increase the likelihood of the bullish scenario playing out.
📝 Final Thoughts
This analysis reflects our opinions and is not financial advice.
Share your thoughts in the comments, and don’t forget to share this analysis with your friends! ❤️
BTC UpdateLooking at historical data, we’re at a similar point as in 2021 — diverging RSI, declining volume, and signs of exhaustion. The key difference now is the level of institutional involvement: hedge funds are heavily in, MicroStrategy keeps buying, and even nation-states have exposure.
Despite the bullish narrative, I believe we’re heading down.
Price action isn’t convincing — we're still trading below the January monthly candle close, volume is drying up, and RSI continues to diverge. Each 5–10% pump is followed by a sharp spike in open interest (OI), then a brutal liquidation cascade wiping out $500M–$1B. This is starting to look like a leveraged casino, not a healthy uptrend.
That said, I wouldn’t rule out a final wick toward $120K to trap late longs and suck in liquidity before the real move down.
I called the top after the January rally — they called me a madman. Still, I was right.
Mastery tends to be a funny thing, seems like on a long enough timeframe you cant lose.
Stay safe everyone.
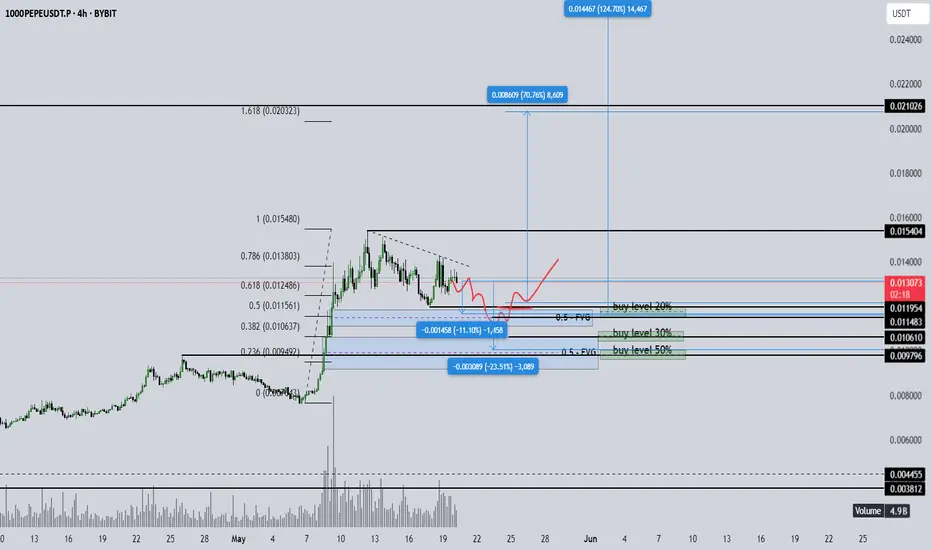
PEPE key levelsBINANCE:PEPEUSDT
The chart shows partial zones for buying this asset.
Further on there will be a good profit to risk ratio.
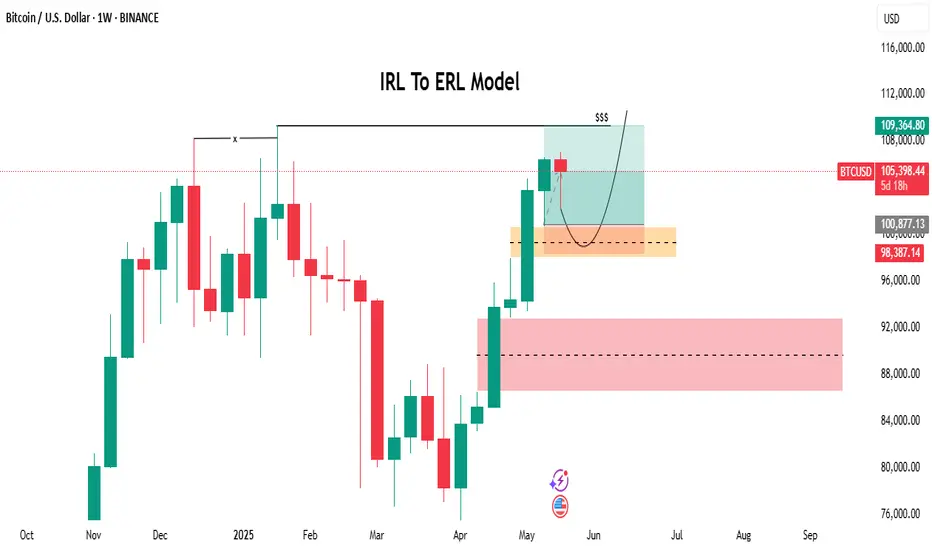
Bitcoin has recently touched its weekly Fair Value GapBitcoin (BTC) Market Update
Bitcoin has recently touched its weekly Fair Value Gap (FVG) and is now showing upward momentum. This price behavior is aligning with a potential transition from an Intermediate Reversion Level (IRL) to an Extended Reversion Level (ERL), suggesting the formation of a structured bullish model.
Given the current positive market sentiment surrounding BTC and the fact that the asset has already absorbed significant sell-side liquidity, the potential for further upward movement remains strong. There is a possibility that the market could aim for the 110K level in the near term if bullish conditions persist.
Investors and traders are advised to monitor the market closely as this structure develops, considering both technical indicators and macroeconomic influences to make informed decisions.
DYOR!
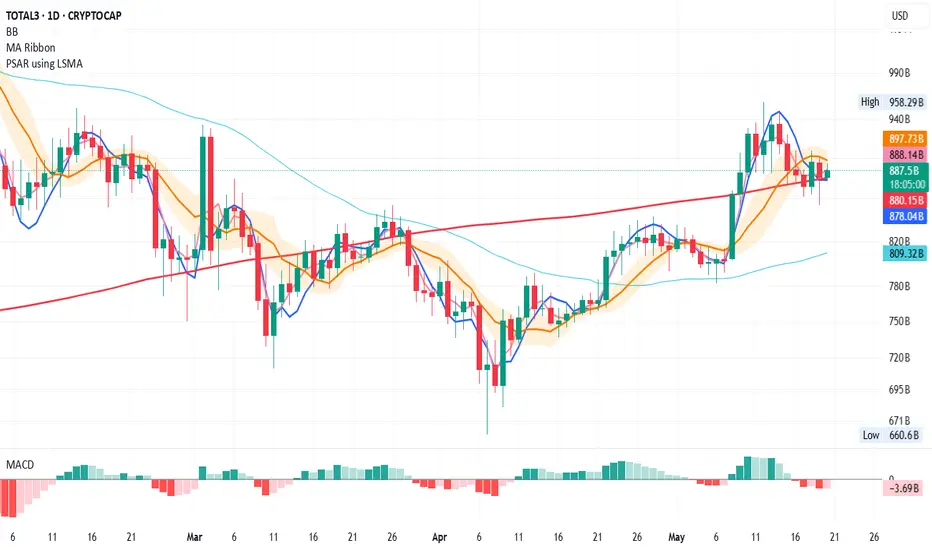
TOTAL3 Update: Potential Recovery on the Daily ChartLooking at TOTAL3 on the daily:
Yesterday, we saw a wick below the 200MA, but the price managed to close above it by the end of the day—a good sign for recovery. 🔄
Although the MLR < SMA < BB Center isn't ideal, we continue to monitor price action in relation to the 200MA. If we close above it again today, things might start to turn positive. 🌱
⚠️ Keep an eye on macro news and hope for no more downgrades from agencies like Moody’s.
Thanks for reading! Stay safe and manage your risk. 📊
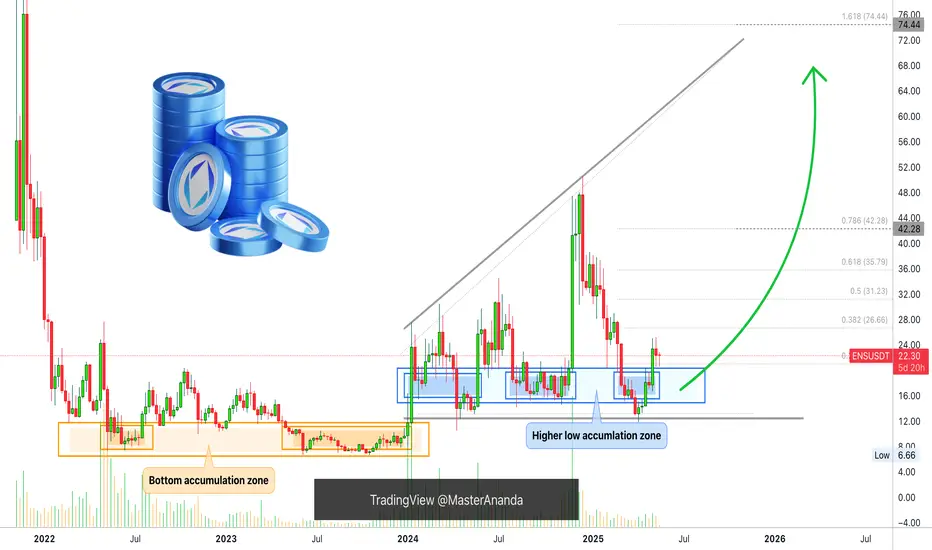
Ethereum Name Service (ENS) Leaves Accumulation ZoneHere we have two accumulation zone. The "bottom" zone coming at the end of the 2022 bear market and in late 2023, between June and December. And the "higher low" zone which started after the early 2024 bullish breakout.
This latter zone was activated April-May 2024 (1), August-November 2024 (2) and March-April 2025 (3). With the last activation of this zone ENSUSDT ended its correction and is now bullish.
Last week was a consolidation week and within the next two weeks we can have a bullish continuation, the resumption of the bullish move that started with the 7-April low.
Good morning my fellow Cryptocurrency trader, how are you feeling in this wonderful week?
What is a good opportunity?
A project that has really good potential for growth and at the same time, high certainty, sure to grow and stable. This pair has those qualities.
We also want a good entry price and timing. Timing is good all across.
Entry prices could be better but that would be being greedy. If ENS can move beyond $100, easily, then anything below $25 can be a good entry. Of course, a price of $15 is many times better, but not everybody can buy at $15 at the same time. And being honest, it is not easy to catch the exact bottom. We can even see it happening but our finances might not be in the right place when this is happening or some other situation prevents us taking action, but it is never too late. The market always offers a second chance and this chance is now.
Ethereum Name Service has great potential for growth. My strategy is very simple, buy and hold. Set a sell order 300%-500% above my entry level, when it fills, look for a pair that is still trading at bottom prices and repeat.
If you are glued to your screen, you can track the market and sell higher. Or you can sell portions at each target, or you can hold long-term. There are many ways to approach the market, right now, it is not about selling but buying. Right now is the time to buy. Late 2025 is the time to sell.
Thank you for reading.
Namaste.
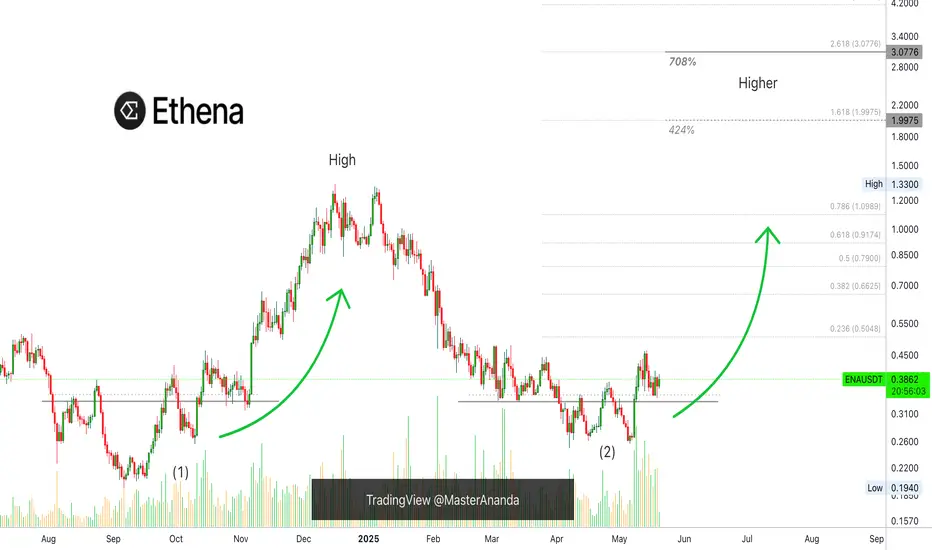
Ethena Short-Term Trade-Setup: Easy Profits 708%Ethena is now ready to produce a new advance, higher prices. The (1) shows a low before the last bullish jump. The (2) is a higher low which tends to lead to a higher high.
Looking at the Altcoins market, looking at Bitcoin and how strong it is; looking at the volume and candles, all is green.
ENAUSDT is ready to grow short-term, which means fast; the next advance is likely to start within days. The start will happen soon but the end is far away.
Look, the bottom has been forming for months. The bearish wave ended in March, then the market flush and now the recovery; prices are still low.
The thing is that once the action starts, there is no going back, it will happen so fast that by the time you look at the market, at the chart, everything will be 100% to 200% up. There will be more growth, but is better to get in early.
Thanks a lot for your continued support.
Buy and hold.
Namaste.
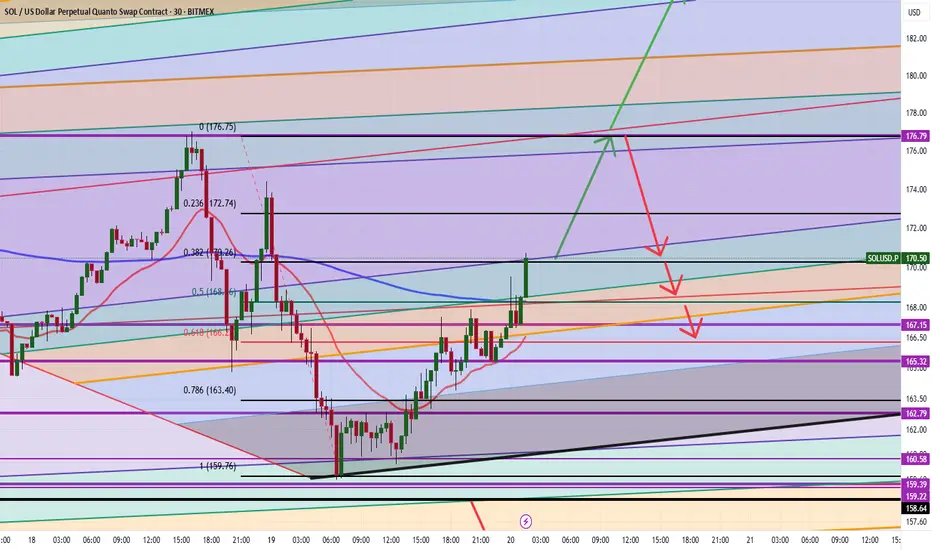
Solana driving to 176 ??? Or can we go Higher? Hi everyone
This is what I am seeing currently, let me know what you think ?
Kris/Mindbloome Exchange
Trader Smarter Live Better
SONIC gearing up for a strong move!No reason not to start picking some up here—just took out the previous swing high before forming new lows.
Now establishing a solid base after reclaiming a key pivot area.
Targeting 70c on this move. SET:SONIC
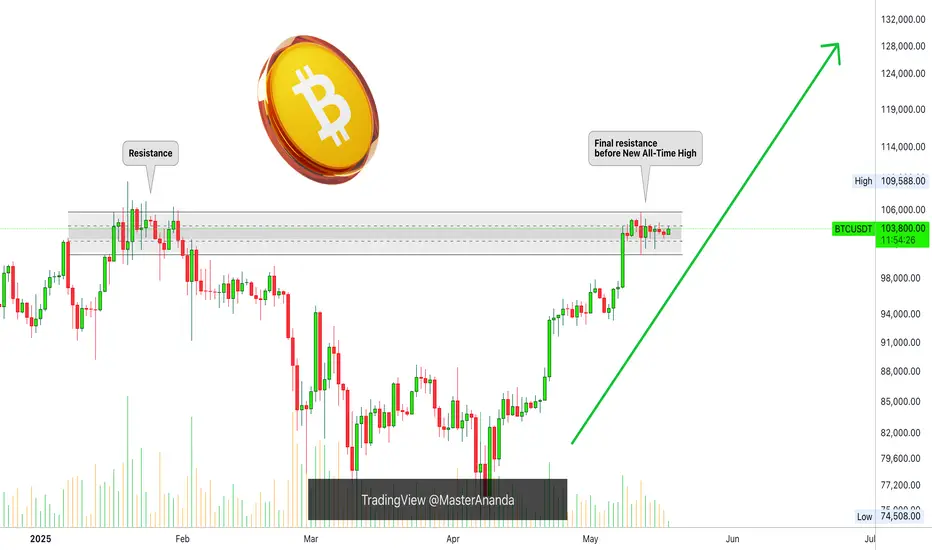
Altcoins: Bitcoin Daily Turns Bullish, New All-Time High But...New All-Time High but how high? How high is Bitcoin set to move in this breakout as a the new All-Time High? How high is Bitcoin set to continue in May that still has 12 days left and what about June and July 2025?
What happens after June-July 2025 and what happens in late 2025?
What's the map? How high comments section below—yes?!
Bitcoin is now challenging the "final resistance." This is truly the final resistance because we are in the 2025 bull market. There are many things happening around this final resistance. For example, the Altcoins market.
The Altcoins market goes bullish when Bitcoin grows above 100K yes? Yes it did/does and has been growing for an entire month many pairs are up 70% to 100% some are up 400% and this is only the start but, think of this... What happens when Bitcoin hits a new All-Time High?
For Bitcoin this isn't much, the ATH is at $109,588 and a new All-Time High is $110,000 but what about the Altcoin? Magic!
When Bitcoin hits a new ATH it goes on all media all screens and nobody can deny it is happening because it is happening and the market is full green. This creates boom, interest and many people trade only when resistance breaks. The Altcoins will boom growing 2-3 levels up within days. The bottom forever gone massive profits, lives changing and this is only the start.
The first level of importance as Bitcoin moves in price discovery eventuality and territory and market conditions—change, grow, win—sits around $120,000 and $130,000. This is the level to watch for.
Some people are saying a massive correction at this point more like a normal correction or maybe nothing for a few reasons that I will explain below.
The next range is $150,000 and $160,000 and here is the thing. If Bitcoin is going to $180,000-$220,000, then the correction cannot happen at 120/130K. It needs to happen on the second level around 150/160K, do you understand?
If the strong mid bull market correction happens at $120,000-$130,000 this is bad news because the final market cycle top gets lowered. If it happens later we have $180,000, $200,000, $220,000 or more. And this is the interesting part and what we want.
We are still in May month #5 and the minimum we can expect growth is until November month #11 which gives us 6 months. 6 months of straight up is a very long time. With a 2-3 months correction now it isn't that long.
These are the things that we need to consider but aim high because Bitcoin will always surprise.
Minimum, you can aim for $180,000 as the cycle top—minimum. Go higher leave a comment and with the excitement, euphoria and the first time since 2021 seeing so much growth, institutional adoption, Trump, Saylor, El Salvador think $220,000 can you see how that works? Comment below.
Things are bright for Cryptocurrency holders know why now think in this way. Your life can change forever if you take the right action following the right steps in the next 6 months. Imagine a lifetime of profits secured in this bull market bull run. The choice is yours.
It can happen of course, it has happened many times and will continue to happen but we have to be smart. It is happening now but we are early this time we have experience and we know exactly what will happen. It is not a question of if but when. When? In late 2025.
Thank you for reading.
Your comments show your continued support and helps activate the bots to do the same. Show them some love!
Namaste.
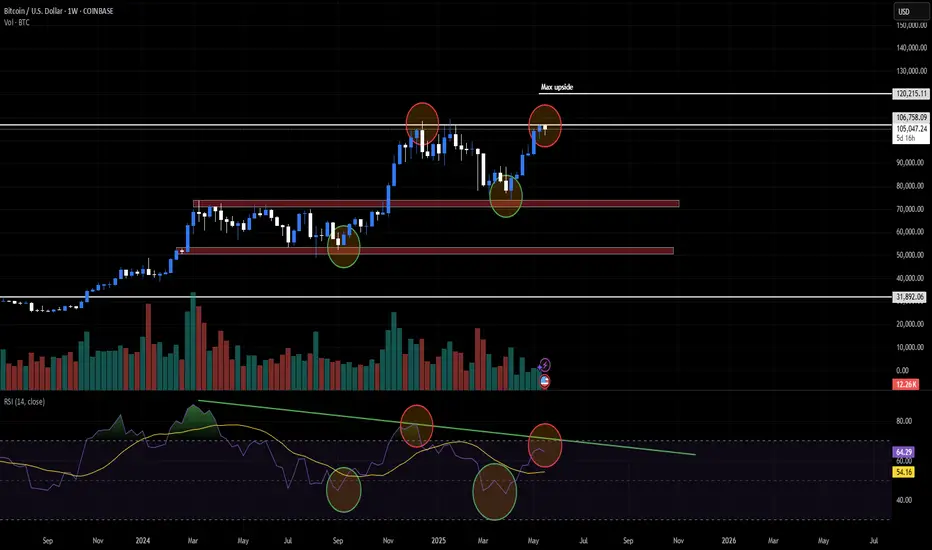
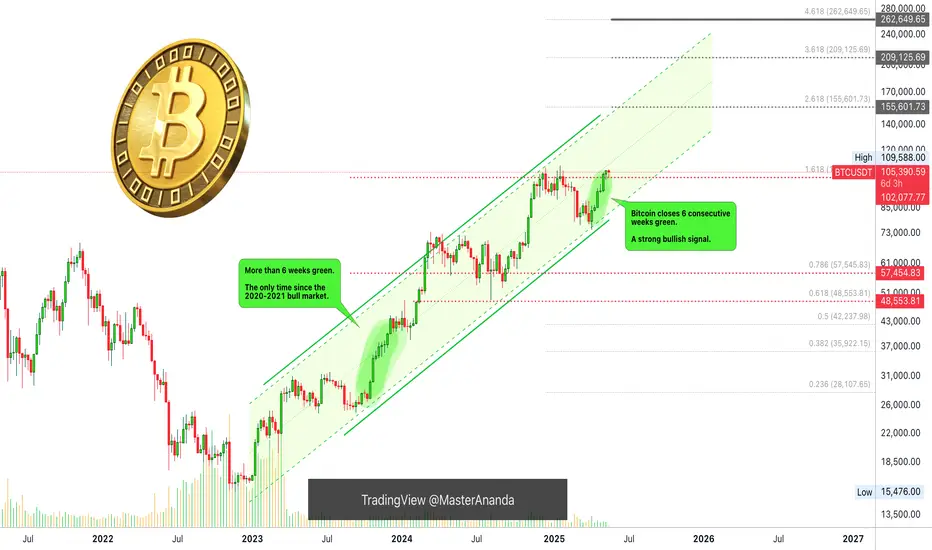
Bitcoin: Top Altcoins Choice —Your Pick (Session 7)We've identified Bitcoin's strongest support in this current cycle thanks to some long-term numbers I extracted when calculating the size of the 2021-2022 bear market.
These numbers have been working great on a long-term basis so we can continue to use them moving forward.
You could extract these numbers right on November 21 2022 and see how good they have been working:
— The August 2024 low matched perfectly the 0.618 Fib. on the chart.
— The new All-Time High, final resistance and now support matches perfectly the 1.618 Fib. level on this chart.
— Bitcoin's next strong resistance zone sits at 2.618 Fib. or $155,601.73. If you really need an intermediary level before 155K, you can consider $137,000. This is another relevant resistance.
— We know now for certain that the strongest support ever for this moment now is $102,000. As long as Bitcoin trades above this level, ultra-bullish confirmed. Wow, if it moves and closes below.
Top Altcoins Choice —Your Pick (S7)
This time, let's do it differently. I only need your choices to find some interesting pairs, to look at something different.
Go to the comments section and share ALL your favorite Altcoins. Can be the ones you like most, the ones you trade, the ones you hate, the ones you love, the ones you see with huge potential or the ones you want me to look at for any purpose.
I will pick and choose and publish in my profile those that look good. I will also reply in the comments with an analysis if I reach my publishing limit for the day.
I need your support. Which one is your TOP ALTCOIN CHOICE? (TAC!)...
Comment below!
Namaste.
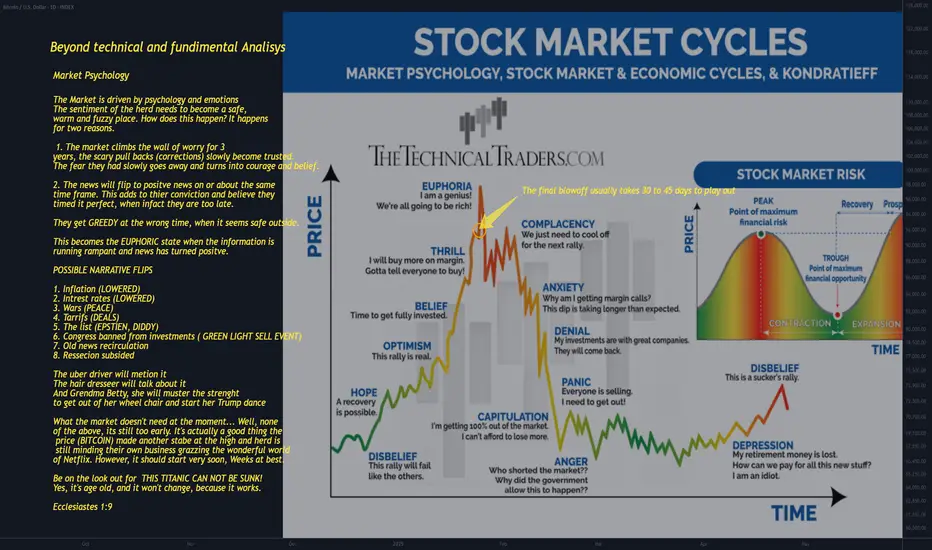
Market Psychology 101Good day traders and investors,
There are benefits to being (AWAKE) or at least there should be.
This is where I stand at the moment with the Bitcoin & crypto market. I do believe Is in the final stages of the bull market marked with a circle. The final stage has biggest gains and it happens in 30 to 45 days.
Most of what I wan to say is in the chart. Please, feel free to add something you feel I have missed or why you may disagree.
Kind regards,
Demetrios
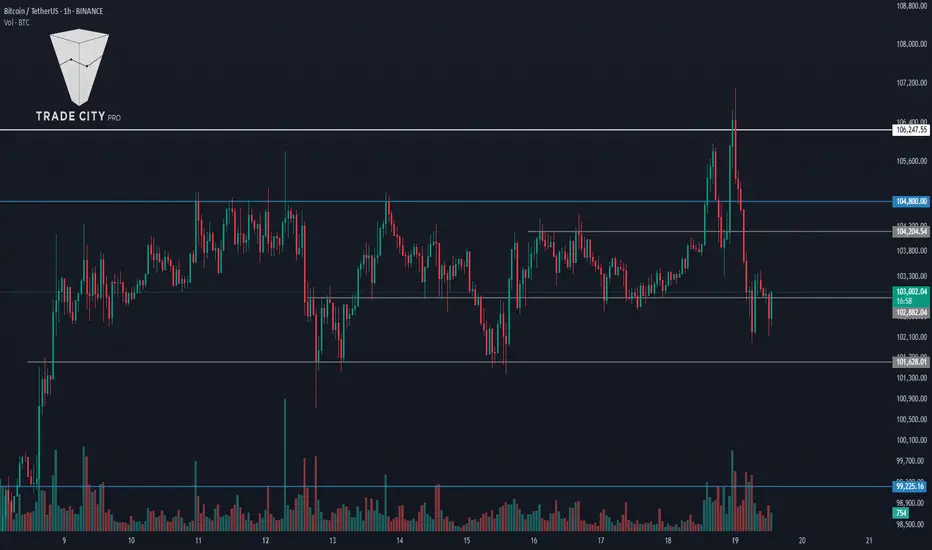
TradeCityPro | Bitcoin Daily Analysis #96👋 Welcome to TradeCity Pro!
Let’s move on to the Bitcoin and major crypto index analysis. As usual, I’m going to review the triggers for the New York futures session.
⏳ 1-Hour Timeframe
As you can see on the 1-hour chart, yesterday we had a bullish move that extended up to the 106247 level.
🔍 However, as I previously mentioned, this is a very sensitive zone for price action, and we might see sharp reactions from it. That’s exactly what happened—price faced a strong rejection after reaching this level and dropped down to 102882.
📊 Market volatility is currently very high, and the risk of getting stopped out in either direction is significant. So we need to be cautious and avoid getting caught in fake moves.
💥 Personally, I recommend avoiding trades right after such volatility and waiting for a new structure to form. But if you’re planning to take a position, keep the risk very low.
⚡️ For a short position, our first trigger is a break below 101628. Alternatively, we could also enter based on how the price reacts to 102882.
📈 For a long position, we currently have no clear setup until price structure forms. The only long triggers I can give for now are the breakouts of 104800 and 106247.
👑 BTC.D Analysis
Bitcoin dominance has started a new uptrend and has even closed above 63.71. Given the healthy structure of this trend, if 64.04 breaks, we can confirm a full bullish breakout for BTC.D.
💫 If BTC dominance continues rising while the market moves up, Bitcoin will likely outperform most altcoins.
📅 Total2 Analysis
Looking at Total2, the 1.17 support broke yesterday, and now this index is set up for further downside correction. For now, it seems the market is in a decision-making phase.
🧲 If we get a lower low and lower high below 1.17, the chance of a move toward 1.1 increases significantly.
📅 USDT.D Analysis
Now for USDT dominance—yesterday it faked out the 4.60 level twice and is currently holding above 4.70, heading toward 4.82.
🧩 If this move turns out to be a fake and price stabilizes below 4.70 again, it would give us a strong signal for a bullish market and a bearish turn for USDT dominance.
❌ Disclaimer ❌
Trading futures is highly risky and dangerous. If you're not an expert, these triggers may not be suitable for you. You should first learn risk and capital management. You can also use the educational content from this channel.
Finally, these triggers reflect my personal opinions on price action, and the market may move completely against this analysis. So, do your own research before opening any position.
BITCOIN Daily Bullish / Bearish days ahaed with Big push after
Even though I have mentioned that we maybe in for some RED days this week, this chart shows how, ultimately, we are in a Bullish momentum still.
The CUP pattern that we have printed ( adjusted since I last posted this) , Goes from ATH line back to the ATH line.
We also see how there is this APEX that PA has fallen into that has its peak at the end of this month.
PA always reacts before the APEX
But before this, we may range across or drop down onto the CUP. This has Strong support and could possibly propel PA above thaT ATH line.
We do need to also understand, there is a 618 Fib circle at this intersection and that may not be easy to break through.
But PA has often searched out intersections of resistance to break through and so I am looking to this as the way forward.
The 2.618 Fib Ext on this chart may also offer support at around 98K if we loose support higher.
The RSI is already dropping from OverBought and so will probably continue to do so till we reach Neutral / Over Sold again.
And the Daily MACD, is also turning Bearish, But as mentioned before, this is possibly repeating what happened in Nv 2024
See the Arrow on the left...The Histogram is the one to take note of. Two Green peaks and then a red Dip
We have just begun the Red bit after the two Green peaks.
The scale is larger here and so we may have to wait longer till we return out of the green.
In 10 dayts, we will be near end of month
So, for me, this week will be possibly Red but towards the end of the month, things will begin to move higher.
All depends on PA following expected patterns and that does not always happen
We can only look, plan and react.
