Bitcoin Weekly Closed GREEN -opens RED. Whats next ? After 6 consecutive Green Weeks, Bitcoin maybe about to Turn around and Cool for a bit.
BUT DO NOT PANIC
We have opened the week with a sharp drop back below the 2.618 Fib Extension. This in itself is a major move if unsurprising
Last week, we talked about this possibility by looking at the Daily MACD.
MACD Rising above the Signal line is a Bullish indication and Visa Versa
See the Arrow on the left, how MACD had 2 slight pullbacks and then went higher. This was in Nov 2024, just as the Ranging was finishing and PA was getting ready to push up to its Current ATH line
What I was looking at mostly though, was the Histogram. The Histogram shows us the distance between the MACD line ( yellow ) and its Signal line ( Red ) . The Bigger the bar, the bigger the difference between them.
See how it rose twice and then, went red for 2 days, recovered for a day and then , OFF WE WENT
And I am suggesting this is what may happen again.
So far, that pattern is repeating and the Histogram just went Red.
We may need to understand the difference in scale of this histogram though.
This could point towards a Week of unsettled PA, maybe Longer.
Notice how the MACD ( yellow) has now dropped below the Signal line ( red) as it did in Nov 2024.
During this period of MACD dropping and going red in 2024, we had 6 days of Red PA candles before the Bigger push higher. This may take longer this time but we have to wait and see.
We need to watch this close as the lines of support are in different place now.
If We zoom in on the Weekly PA chart, we see things a little more clearly
PA has fallen back below a line that was required as support. If you Look back to Nov 2024 area, we can also see a very Big difference in how PA is on the lines of support.
In 2024, we bounced off support.
We are currently being Rejected.
This Daily chart offers some more detail
The Circled area is the Nov 2024 area I been talking about.
Todays pull back is sharper but as we saw with the Histograms, we are in a bigger scale anyway
We could also see a similarity if we look back before the Circled area, see the W shape? A Double Bottom that appeared just before the push up.
Well, we just did that too.......If you back from where we are now, to the Low..There were 2 Dips down and then we pushed higher.
And, again, It is the scale that is Bigger.....
So, for me, this week maybe a bit bloody, but over all, Still Highly BULLISH
We need to regain that 2.618 Fib ext on this chart as support but that may not happen just yet.
There are "Local" lines of support near by and the LOG Daily chart I will post later gives some hope that Big Drops may not happen
The line of resistance just over head is strong and untill we break 112K and Hold it, we are likely to remain being bounced around.
But I do believe we Will do this and that we do seem to be repeating a pattern that led to a Goodpush higher.
We just have to wait and see
Cryptomarket
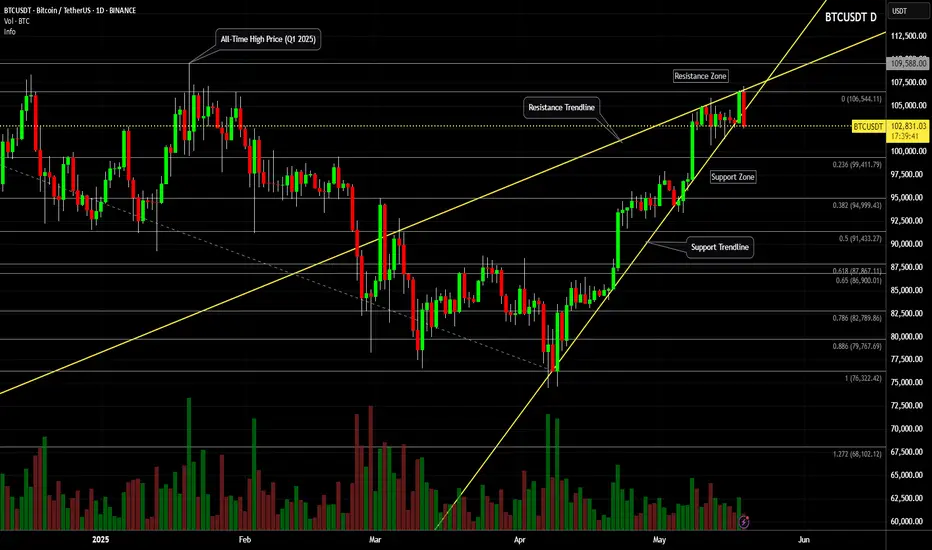
Bitcoin (BTC/USDT) - Support Trendline & Zone Price Test - DailyBitcoin (BTC/USDT) price recently rejected down from $107000 on May 19th, 2025.
The yellow Support Trendline below is currently being tested ($103000 price level).
Several candle body closes below the Support Trendline could signal weakness in the daily price trend (potential rising wedge pattern).
The April inverse head-and-shoulders price pattern and targets have been completed (+12% and +24%).
note: Breaking news, government law changes, corporate announcements, and crypto crime could affect the Bitcoin price and charts.
TradeCityPro | IOTA: Testing Key Resistance in RWA-DePIN Rally👋 Welcome to TradeCity Pro!
In this analysis, I’m going to review the IOTA coin for you. This project is one of the RWA and DePIN-based initiatives and is among the older projects in this category.
✔️ The coin has a market cap of $822 million and ranks 85th on CoinMarketCap.
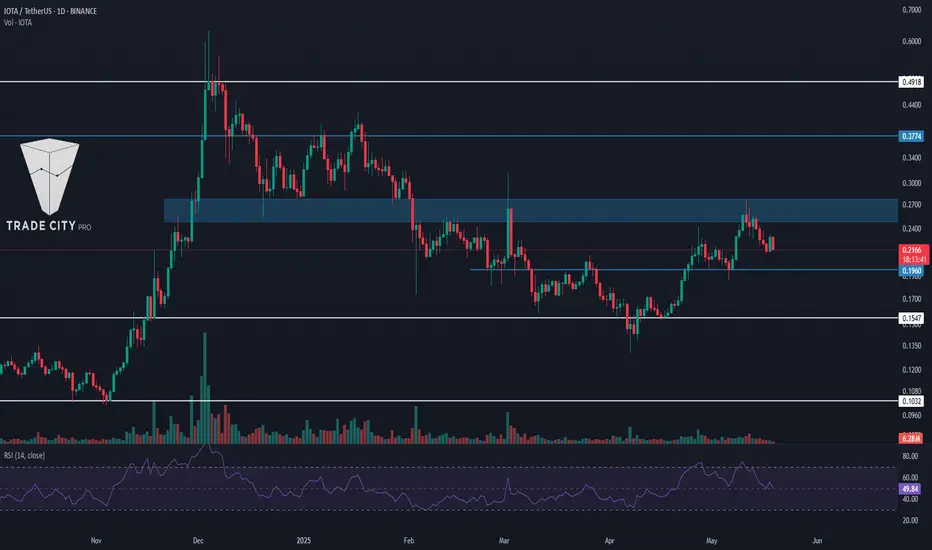
📅 Daily Timeframe
As you can see on the daily timeframe, after finding support at 0.1547, the price initiated a bullish leg and moved up to the resistance zone I’ve marked.
💥 This area is a very significant resistance zone, and in this bullish leg, the price has reached it for the first time and got rejected.
🔍 In my view, as long as the price hasn’t confirmed a breakout above 0.1960, the chance of starting a downtrend is higher than continuing the current uptrend. If this resistance zone is broken, we can consider it strong confirmation of buyer strength.
📈 For a long position, we can enter on the breakout of this same zone. For spot buying, this trigger can also be used, but the main long-term triggers are 0.3774 and 0.4918.
⚡️ On the RSI oscillator, there's an important zone at the 50 level. If this level is broken, the probability of breaking 0.1960 increases. If that happens, the next support zone will be 0.1547.
📊 Make sure to pay close attention to volume. If any of our triggers are activated without volume confirmation, the likelihood of a fake breakout increases.
❌ Disclaimer ❌
Trading futures is highly risky and dangerous. If you're not an expert, these triggers may not be suitable for you. You should first learn risk and capital management. You can also use the educational content from this channel.
Finally, these triggers reflect my personal opinions on price action, and the market may move completely against this analysis. So, do your own research before opening any position.
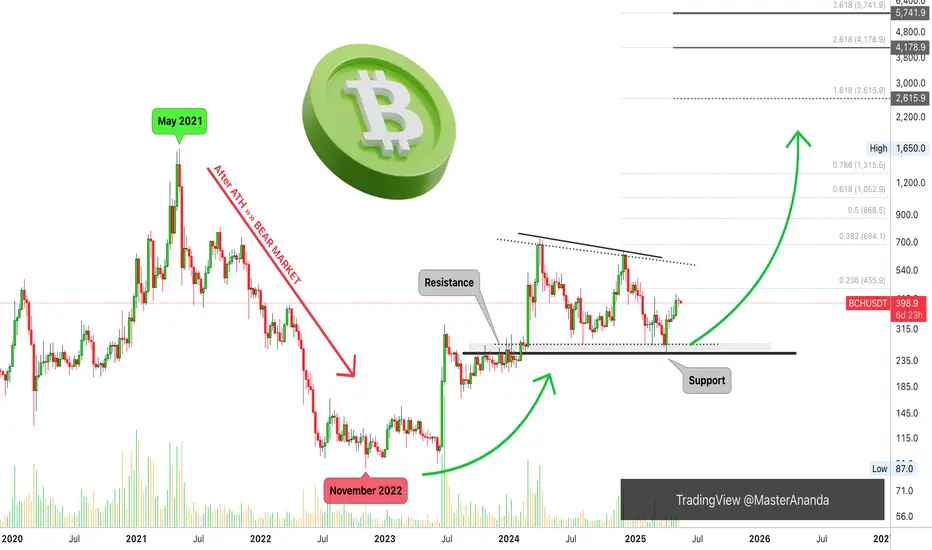
Bitcoin Cash, The Map! Technical Analysis GeniusEvery time I look at the chart I consider the possibilities of a bear market. You've seen me bullish, you know I am bullish and I share the signals, but I always stay open to being wrong so I keep on looking to see if I can find something that I might be missing.
To be honest, if the signals were there I wouldn't be able to see them, I am too hypnotized by hundreds of charts hitting bottom and recovering from this bottom to think that a bear market is just starting now. Bear markets tend to start from a major wave high or new All-Time High.
Here we have Bitcoin Cash, see May 2021.
The ATH, the top, leads to a strong bear market. Notice that a bear market does not happen from bottom prices but from peak prices; obviously duh!
Ok, ok... My job is to clear all doubts for you but since you are reading this and you are my follower, you already know what is happening and we agree.
The zone that worked as resistance in late 2023, worked as support in April 2025, last month.
There was a bottom in November 2022. From the bottom we grow.
This bottom signaled the start of the new bull market.
The low in April is a long-term higher low. From this low we will experience the latter part of this long-term growth period, but it continues.
The incoming bullish wave will produce a new All-Time High. This ATH will be followed by a bear market. The bear market will end in a long-term higher low. This higher low we will call a bottom, the bottom of that bearish cycle and from this bottom a new wave of growth and so on. It keeps on happening long-term.
This is good for today.
Enjoy the chart for the All-Time High targets.
Thank you for reading.
Namaste.
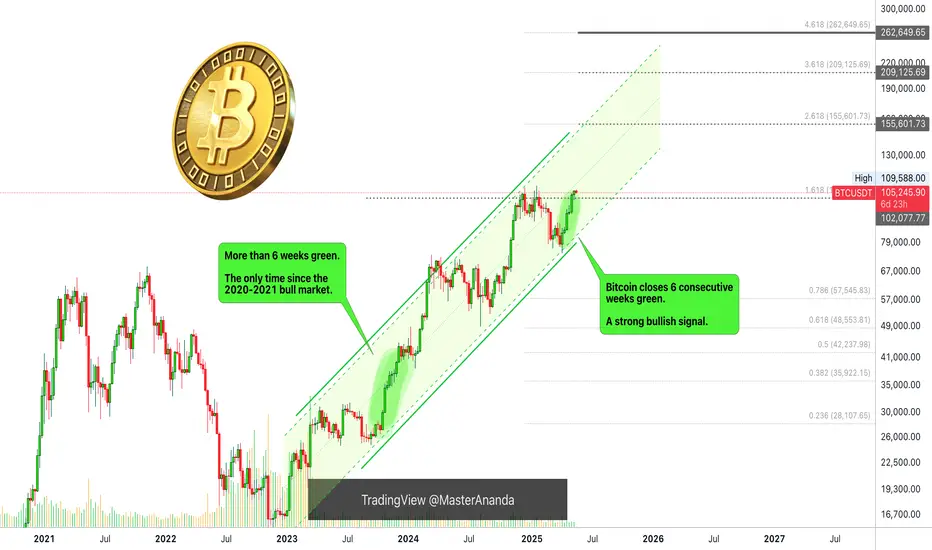
Bitcoin Hits New ATH on Candle Close & New 2025 ATH ProjectionsThis week Bitcoin produced its highest weekly candle close ever at $106,454. 12-May 2025 weekly session.
The previous ATH based on candle close happened on the 9-December 2024 weekly session at $104,464.
The current high is 1.91% higher than the previous one. Volume is still basically zero on this chart...
Good evening my fellow Cryptocurrency trader—likely to be morning by the time you read this—how are you feeling in this beautiful day?
Bitcoin actually did better than expected but this is not surprising, because Bitcoin is always a surprise on the positive side. This already tells us that the new bullish cycle top can turn out being something completely unexpected, the institutional wave.
The volume...
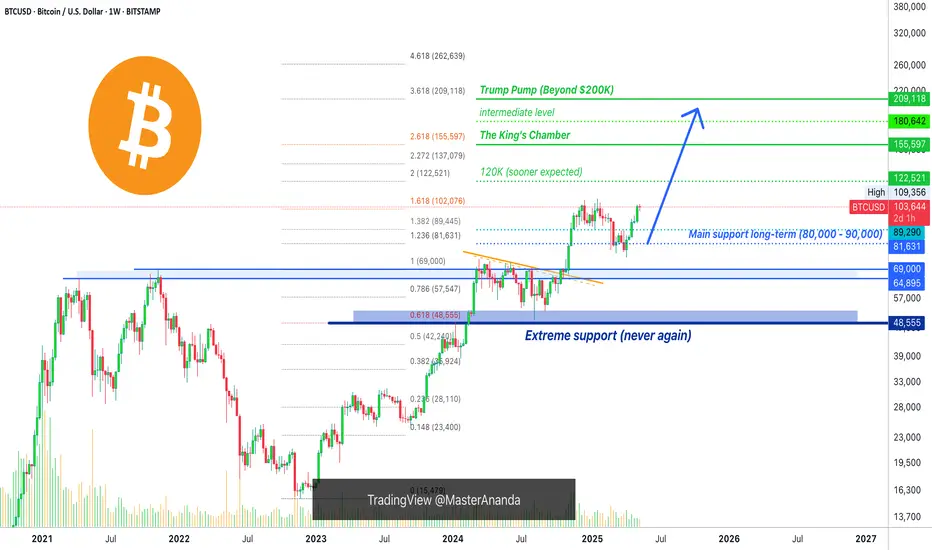
There are many ways to extract targets so don't mind me using different methods and showing the different possibilities. It is good to have a broad market perspective. Instead of just one option, we can look at all the possible scenarios.
The standard All-Time High based on the previous cycle sits at $155,601. Four years later, hyper hidden inflation, etc., we know this is not it. This same level based on dollars value, $155,000, would be something like $189,000 or $206,000 today, so we are not going to consider this level to be the end of the 2025 bull market.
There is no 180K in this setup. The next target is the 3.618 Fib extension and goes to $209,125. This is more like it. This is a very strong level and there is possibility that Bitcoin can peak right below it.
The next one and last one is the 4.618 Fib extension at $262,649... Let's consider this number for a few minutes. Close your eyes, breathe... Think of Bitcoin, late 2025 or early 2026 and consider this number. Do nothing and just let any impressions come to you. Can be visual, auditory, kinaesthetic or just mental chatter, logical. Yes, it is possible! We keep beyond $250,000 on the cards. Share your impressions in the comments section by the way.
Low volume is natural. If you look at this chart from March 2020 through November 2021 there is no significant spike in volume. It is neutral. So this signal has no use for us at this point. The data-based conclusion is the fact that Bitcoin has been going up for six weeks and volume continues to be low. It was only high when the market hit bottom in 2022 and when it broke up above the 2017 peak in early 2023, that's the highest volume.
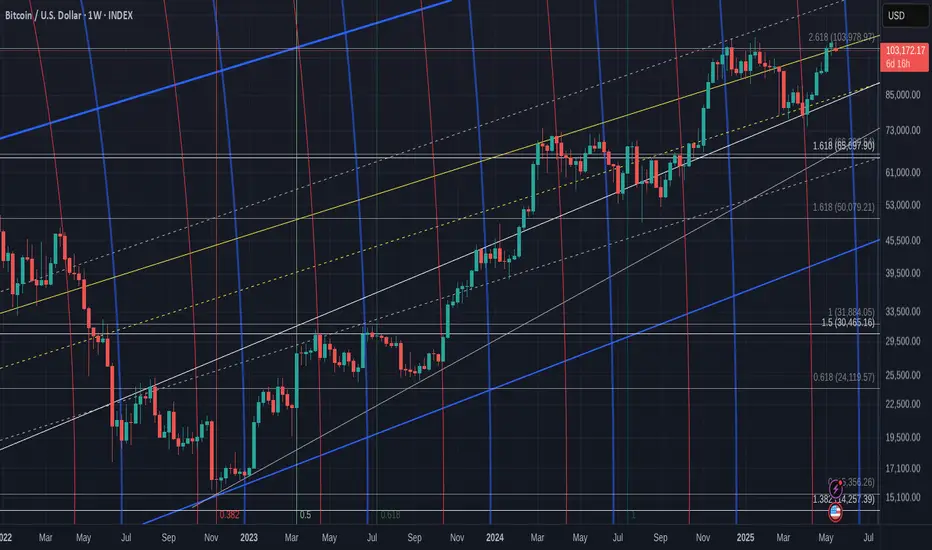
Look at this black line:
This is the golden ratio, 1.618 Fib extension in relation to the previous market cycle. It is very interesting. This same level from years ago worked as resistance in late 2024/early 2025.
Last week Bitcoin closed above this level and this week it wicked below and finally closed above. Definitely the action happening here around $102,000. So these numbers are good.
We have a certain price of $155,601 in the coming months, this will be a very strong resistance, the midterm bull market correction can happen here. After the correction bottoms, we will have wave 5 and this one must go beyond this level in order to be real, so this opens up $209,000. Unless $155,000 is the cycle top and ATH, we are set to experience Bitcoin trading above 200K.
My friend, it is my pleasure to write for you again today. Its been so long, I cannot believe we are still seeing each other, exchanging, talking, chatting, trading, reading, writing, fighting and making up just to keep on growing together. Where were you 7 years ago? Where are you now?
Thanks a lot for your continued support.
Namaste.
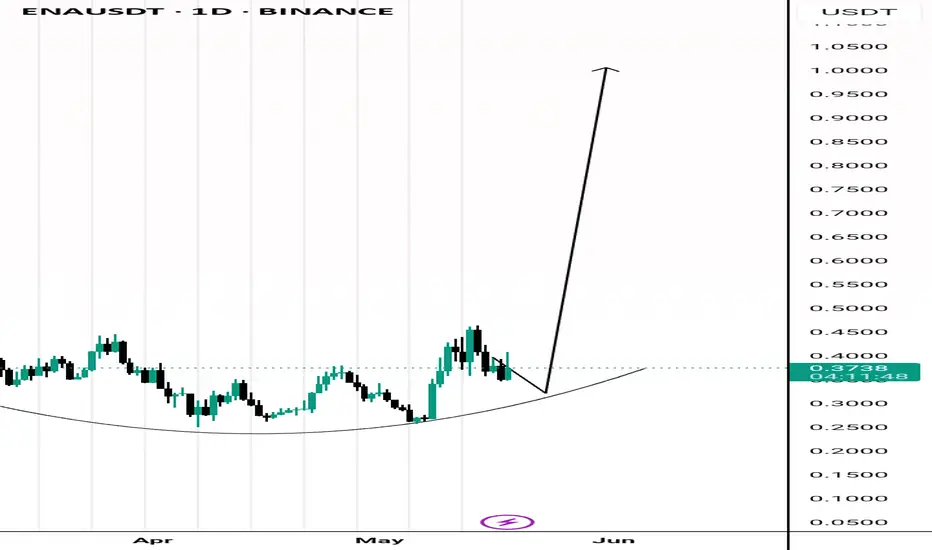
Buy Idea Rounding tops and bottoms can be reversal patterns.
Looking at this daily chart, there's rounding bottom.
Third touch of the boundaries with a bullish candlestick will mean buy for me.
XRP : LONG FOR THIS WEEK !Hello friends
Considering the good growth we had, you can see that the price has formed a double top pattern and corrected after reaching its ceiling.
Now, with the price correction, there is a good opportunity to buy in stages and with capital management and move with it to the specified goals.
*Trade safely with us*

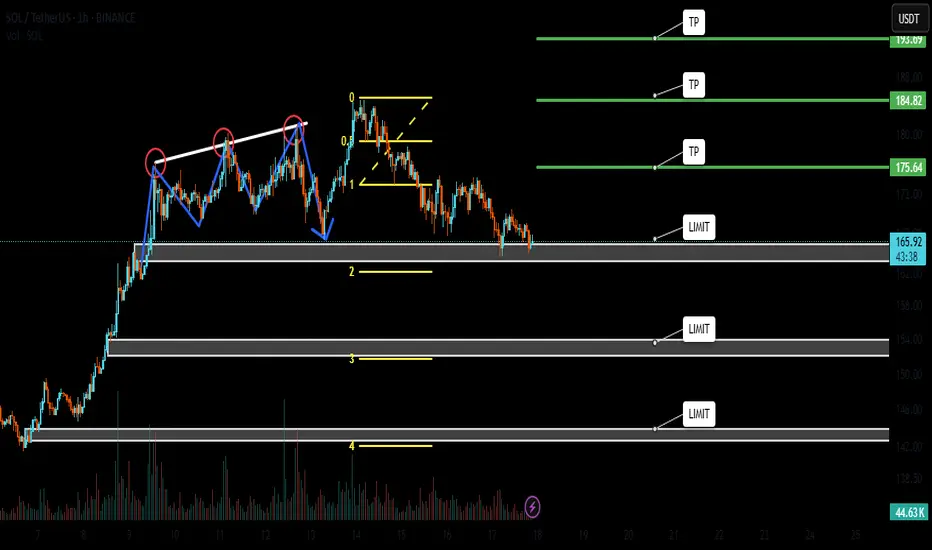
SOLANA BUYLIMITHello friends
Considering the good growth we had, you can see that the price has made a small correction after reaching its ceiling and has entered a range.
Now, with the price correction, there is a good opportunity to buy in stages and with capital management and move towards the specified goals.
*Trade safely with us*
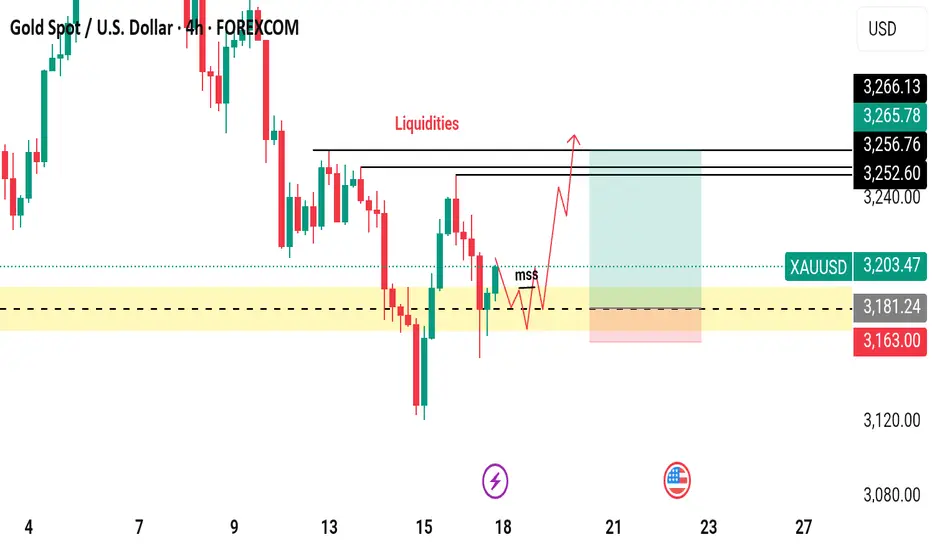
GOLD Has Shown A Significant Bullish Move!!Gold Market Analysis
Over the past week, gold has shown a significant bullish move by touching its weekly bullish Fair Value Gap (FVG) and closing a candle above it. This price action serves as a strong indication that the market is currently exhibiting bullish momentum. However, it is important to note that the sustainability of this bullish trend will be confirmed only through future market developments and price behavior.
As of now, our analysis suggests that gold, after revisiting and respecting the weekly bullish FVG, is trending upward. Looking ahead, we anticipate a minor retracement in the short term. This pullback could provide a healthy opportunity for the market to gather momentum before making another move upward. Ideally, we expect the price to retrace slightly and re-enter the highlighted yellow zone. Within this zone, we will be watching for a Market Structure Shift (MSS), which would act as our confirmation signal to consider entering a long position.
Once confirmation is received through MSS or similar price action cues, our strategy would be to target the liquidity zones situated above the current price level. It is also worth mentioning that the market has already cleared liquidity on the sell-side, which further strengthens the bullish case. Based on current technical indications and liquidity structure, there is a high probability that gold could reach as high as $3,250 in the upcoming sessions.
That said, market conditions can evolve rapidly, and it is essential to monitor price action closely. Traders and investors are strongly advised to conduct their own research (DYOR) and await clear confirmations before making any trading decisions. Staying vigilant and informed will be key to capitalizing on potential bullish movements in the gold market.
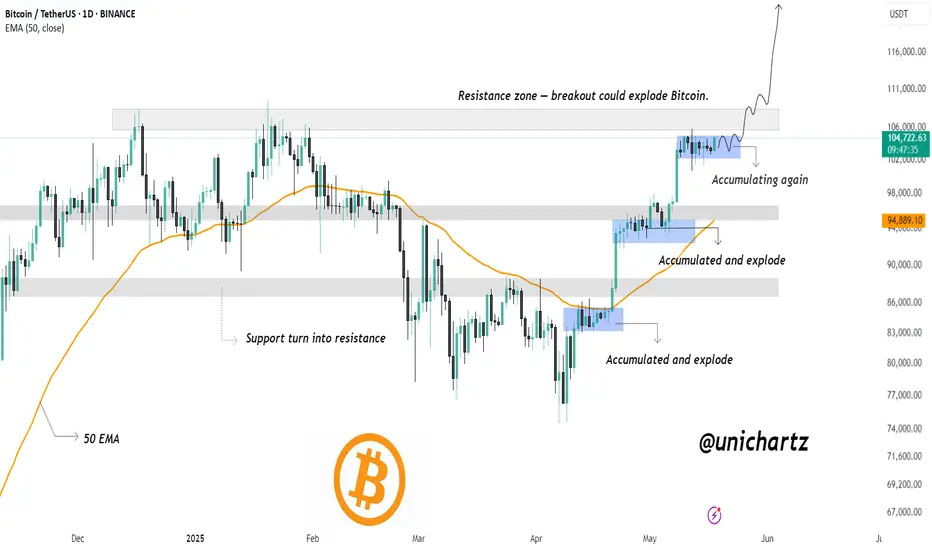
Bitcoin Ready to Explode – Just Like Last TimeCRYPTOCAP:BTC is currently showing a powerful accumulation and breakout pattern, repeating the same bullish structure that led to explosive rallies in the recent past.
The chart highlights three key zones where Bitcoin consolidated before breaking out:
🔹 First breakout from the $81K–$86K zone
🔹 Second breakout above $93K after holding above the 50 EMA
🔹Now, Bitcoin is accumulating again just below a key resistance zone (~$105K–$106K)
This resistance zone has acted as a ceiling before, but the current price action suggests strength. The tight consolidation just below resistance often precedes a breakout — and if it happens here, Bitcoin could explode toward $115K+ in the coming weeks.
Key Technical Points:
🔹50 EMA is acting as dynamic support
🔹Higher low structure remains intact
🔹Each consolidation is followed by a strong upward breakout
Repeating accumulation breakout pattern is visible
Next targets: $111K → $115K → $120K
Invalidation: Breakdown below GETTEX:98K with strong volume
If you found this helpful, don’t forget to like, comment, and repost.
Thank you!
#BTC #BTCUSDT #Unichartz
TradeCityPro | Deep Search: In-Depth Of ATOM👋 Welcome to TradeCity Pro!
Today we have a deep research analysis of the ATOM project, and in this report, I’m going to review the project completely. Let’s first go over the project’s fundamentals and then analyze the ATOM chart technically.
🌌 What Is Cosmos?
Cosmos is a blockchain ecosystem designed to solve major challenges in the blockchain industry, such as low speed, high cost, lack of scalability, and the environmental impact of proof-of-work algorithms like Bitcoin. Cosmos enables cross-chain interaction (interoperability) by connecting independent blockchains through a protocol called Inter-Blockchain Communication (IBC).
Cosmos aims to simplify the development of blockchains and decentralized applications (dApps) using a modular framework known as Cosmos SDK, which makes it easier for developers to build blockchain networks.
🛠 How Does Cosmos Work?
The Cosmos network is composed of three main layers:
Application Layer: Handles transaction processing and updates the network state
Networking Layer: Manages communication between blockchains and their transactions
Consensus Layer: Establishes the final state of the blockchain using a consensus algorithm
At the core of this structure is the Tendermint BFT engine, which enables developers to build custom proof-of-stake (PoS) blockchains without coding from scratch.
🔗 Cosmos Hub and Zones
Cosmos Hub was the first blockchain created within the Cosmos network and serves as a central hub for other blockchains—called zones.
These zones are independent blockchains that can interact through Cosmos Hub.
Validators on Cosmos Hub are responsible for maintaining consensus across all zones and are compensated with transaction fees.
The native token of the network, ATOM, is used for transaction fees, governance participation, and staking.
🎯 Key Features of Cosmos
Interoperability: IBC allows blockchains to interact directly
High Scalability: Blockchains run in parallel without overloading a single chain
Ease of Blockchain Development: Cosmos SDK lets developers build customized networks
Decentralized Governance: Users participate in governance by staking ATOM
💡 Interchain Accounts Upgrade
In February 2022, the Interchain Foundation introduced the Interchain Accounts upgrade, allowing blockchains to control accounts on other chains. This enables remote actions like staking, voting, token swapping, and more—without needing full network upgrades.
This significantly enhances interoperability and composability within the IBC ecosystem.
👥 Founders of Cosmos
Jae Kwon
Zarko Milosevic
Ethan Buchman
Cosmos was initially developed by Tendermint Inc. In 2020, Jae Kwon stepped down as CEO and was replaced by Peng Zhong.
🔐 Network Security
Cosmos uses a proof-of-stake consensus algorithm with Byzantine Fault Tolerance (Tendermint BFT):
Validators are selected based on staked ATOM
Malicious behavior results in slashing (loss of tokens)
Rewards are distributed proportionally among validators and their delegators
📍 Where Can You Buy ATOM?
ATOM is available on most major exchanges, including:
Binance
Coinbase
OKX
Kraken
📈 ATOM Token Information
📊 Initial Token Distribution
In 2017, Cosmos raised approximately $16 million through public and private sales. The initial token distribution was as follows:
Public Fundraise:
Share: 44.1%
Unlocked: 35.6%
Block Rewards:
Share: 39.5%
Unlocked: 31.7%
Strategic Investors:
Share: 7.03%
Unlocked: Unknown (likely still locked)
All in Bits, Inc. (Tendermint):
Share: 6.53%
Unlocked: 5.26%
Interchain Foundation:
Share: 6.51%
Unlocked: 5.26%
Seed Investors:
Share: 3.31%
Unlocked: 2.67%
💰 Supply and Inflation
Initial supply: 236,198,958 ATOM
Current supply: ~292 million ATOM
Maximum supply: Unlimited
Inflation rate: Between 7% and 20%, targeting ~2/3 of total supply to be staked
The inflation rate is dynamically adjusted to incentivize staking. If the staking ratio drops below the target, inflation increases, and vice versa.
🔐 Staking and Rewards
Unbonding period: 21 days
Annual reward rate (APR): Between 14% and 20%, depending on network conditions and staking service provider
By staking ATOM, users help secure the network and earn rewards funded through inflation and transaction fees.
🧾 Economic Mechanisms
Burning: If a governance proposal is vetoed, the deposited tokens are burned
Slashing: Validators engaging in malicious or negligent behavior lose part of their staked tokens
🧠 ATOM Tokenomics Models: 1.0 vs 2.0
Recent analysis reveals different impacts of tokenomics models on network sustainability:
ATOM 1.0 with a 10% inflation cap has shown a 10% improvement in token price and treasury health
ATOM 2.0 suffers from stability issues and is often replaced by ATOM 1.0 to maintain network security
Community Treasury in ATOM 1.0: May face depletion within ~24 months due to limited token supply
🔚 Conclusion
Cosmos represents a significant advancement in blockchain infrastructure by addressing some of the core limitations of earlier networks—most notably, interoperability, scalability, and developer accessibility. Through its modular architecture, innovative Tendermint consensus engine, and the IBC protocol, Cosmos has laid the foundation for a truly interconnected web of blockchains.
The network’s native token, ATOM, not only fuels this ecosystem through staking and governance but also underpins its dynamic economic model. While challenges remain—especially around inflation control and treasury sustainability—Cosmos continues to evolve as a leading force in the multichain future of decentralized technologies.
Now that we’ve reviewed the project, let’s move on to the chart for a technical analysis.
📅 Weekly Timeframe
In the weekly timeframe, as you can see, the price has formed a support bottom at the 3.812 level and has tested it multiple times.
✨ This support is very important because if it’s lost, the price could move down toward the 1.863 bottom.
💥 On the other hand, if the price is supported at this level, a bullish cycle could begin. The resistance levels ahead are 6.602 and 10.135.
🔍 The 6.602 zone isn’t very strong, and if the price gets rejected there, it signals that sellers are much stronger than buyers.
✔️ But if the price breaks through this level and moves upward, the 10.135 zone becomes very significant, because if that level is broken, a Double Bottom pattern will be activated and we can get confirmation of a trend reversal.
💫 If this pattern is confirmed, the first target will be 15.704.
📊 Right now, it’s better to pay attention to oscillators like volume and RSI. Volume is currently decreasing, and we need to wait for volume confirmation alongside price movement. If the price starts to move with volume convergence, the likelihood of continuation increases.
🔔 The RSI oscillator also has a small bullish divergence with price. The reason it’s considered small is that the price made an equal low while the RSI made a higher low. If RSI makes a new higher low again, we may start to see the effect of the divergence in the chart.
🎲 A breakout above the 50 level on RSI could also be a confirmation of bullish momentum.
📅 Daily Timeframe
In the daily timeframe, we can see more details of the price action.
🧩 As observed, the price has formed a range box between 3.989 and 5.380, and within this range, RSI has shown a strong divergence.
📈 I think if RSI doesn’t stabilize below the 50 level, and if the price sets a new higher low above 4.588, the chance of breaking the 5.380 resistance on the next test will be much higher.
🔑 If 5.380 is broken, the price could rally to 7.514. The next target after that would be 10.135, a level I also emphasized in the weekly timeframe.
🔽 For a bearish scenario and short positions, the first trigger is a break below 4.588, which can act as a lead-in to a possible break of 3.989. The main short trigger will be the confirmed break of 3.989.
❌ Disclaimer ❌
Trading futures is highly risky and dangerous. If you're not an expert, these triggers may not be suitable for you. You should first learn risk and capital management. You can also use the educational content from this channel.
Finally, these triggers reflect my personal opinions on price action, and the market may move completely against this analysis. So, do your own research before opening any position.
TradeCityPro | Bitcoin Daily Analysis #95👋 Welcome to TradeCity Pro!
Let’s dive into the Bitcoin analysis and key crypto market indicators. As usual, I’ll break down the triggers for the New York futures session.
⏳ 1-Hour Timeframe
As you can see on the 1-hour chart, yesterday the price bounced from the 102882 level and is now moving toward 104204.
🔍 I mentioned yesterday that if the price prints a higher low above 101628, we could open a position on a breakout of 104204. That scenario played out, and now that the price has risen from 102882, we’re approaching 104204. So, a breakout above 104204 is a long trigger.
📈 The next long trigger is at 104800, and breaking that level could push the price toward the main resistance at 106247.
💥 For a short position and bearish confirmation, ideally, we’d want to see a lower high below 104204. If that happens, a break below 102882 becomes a valid short trigger.
🔽 The main short trigger and confirmation of a bearish reversal would come with a break of 101628.
📊 Keep an eye on volume—if volume increases as the price approaches any of these levels, the chances of a breakout increase significantly.
👑 BTC.D Analysis
Bitcoin Dominance moved slightly higher yesterday but got rejected from 63.71 and failed to reach 63.95.
✨ Currently, BTC.D is heading toward 63.30. If this level breaks, it could trigger a new bearish leg down toward 62.65 and 62.07.
📅 Total2 Analysis
Looking at Total2, this index couldn’t hold below 1.17 yesterday and bounced, currently reaching 1.19.
✔️ If the price holds above 1.19, that would be the first confirmation of bullish momentum. However, this move might also just be a pullback to 1.19—so if price gets rejected here, a break of 1.17 becomes the next short entry.
📅 USDT.D Analysis
Tether Dominance was rejected from 4.70 and may be heading back toward the 4.51 support.
🧩 A break below 4.60 could give us an early bearish signal. The main short trigger remains the 4.51 level.
❌ Disclaimer ❌
Trading futures is highly risky and dangerous. If you're not an expert, these triggers may not be suitable for you. You should first learn risk and capital management. You can also use the educational content from this channel.
Finally, these triggers reflect my personal opinions on price action, and the market may move completely against this analysis. So, do your own research before opening any position.

Bitcoin: The CME Futures PREMIUM, New All-Time High ConfirmedOk, you got me, I will reveal my secrets to you. I only do this because I love you and I want to give you true value. Great content that you can truly trust because it is based on real market data. Just watch!
» Bitcoin CME Futures price: $104,425 (BOOM!)
» Bitcoin BTCUSDT Spot price: $103,600 (Checkmate)
There is a premium on Bitcoin futures price. This means the market is bullish, plain and simple. You can bet your house, a hotel and your wife on the fact that Bitcoin will soon hit a new All-Time High.
The signals are in.
You can fight me in the comments section or you can simply agree and follow me.
Namaste.
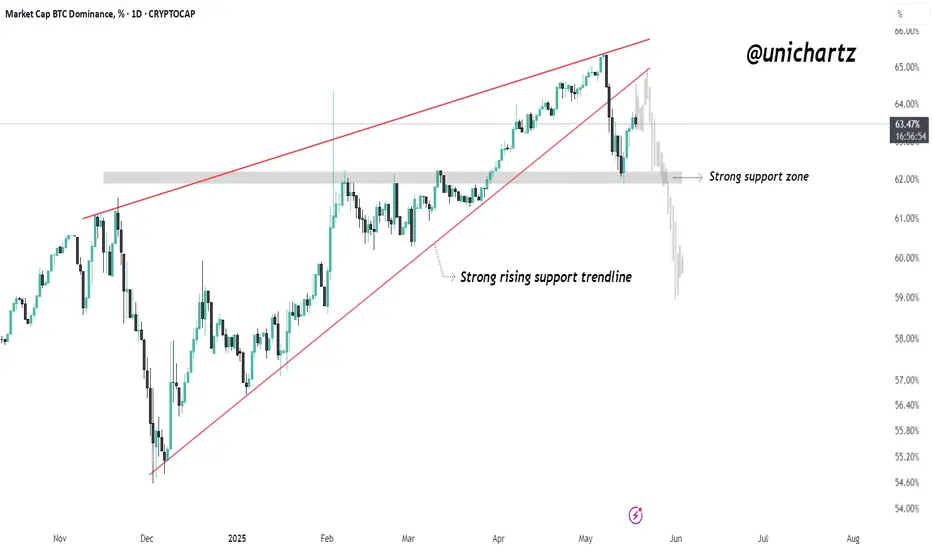
BTC Dominance – Critical Breakdown ConfirmedBitcoin Dominance has officially broken below the long-standing rising wedge structure, signaling a significant shift in market momentum. This pattern, which had held strong since December 2024, has now failed — and that’s a big deal.
After the breakdown, BTC.D temporarily bounced but was rejected on the retest of the wedge’s lower boundary, confirming the breakdown as valid. This retest-then-drop scenario is a textbook bearish continuation signal.
Not only did BTC.D lose the rising trendline, but it also failed to hold the horizontal support zone near 63%–62%, which acted as a key floor for months. Now, with price heading lower, Bitcoin's dominance is clearly weakening, and that’s bullish for altcoins.
What this means:
Bitcoin is losing control of market share.
Altcoins may start gaining serious traction, especially mid and low caps.
If BTC.D drops below 60%, we could see an acceleration of capital rotation into altcoins — a classic start to an altseason.
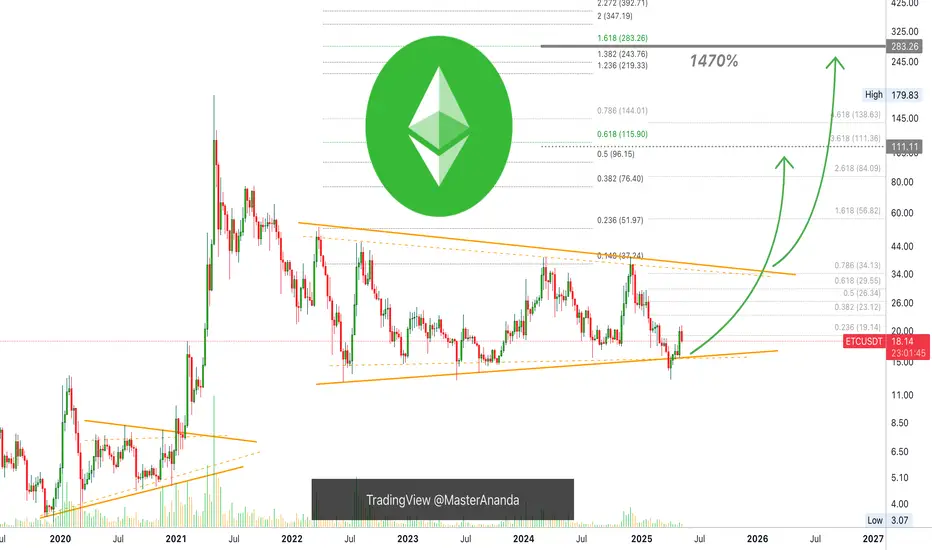
Ethereum Classic 5X Lev. Trade Reminder (PP: 1470% Spot)I have a set of trade-numbers for ETCUSDT with 5X Leverage. I will not post them again but instead will link them below, this is a friendly reminder.
The small retrace now is sending prices back into our entry zone or entry levels. "The market always gives a second chance."
You see, there is no need to rush to try and catch a bullish wave. Notice how the market always offers countless chances after the bottom is in. Right?
Ethereum Classic started to move up but retraced back into the entry zone. Rushing can produce a buy at $21 and then a liquidation. Being patient allows for a lower entry and then massive profits. Notice how long it takes for the market to move.
Many people message me saying, "OMG! I don't want to fomo buy." "I don't want to miss-out, fast, I have to buy." But nothing is happening fast. We are here day after day, always, and we can see the swings and the waves.
If one pair starts moving, that's ok, there will always be another pair trading at bottom prices. Instead of buying LONG the one at resistance, go LONG with the one at support. This is a great example.
ETCUSDT is looking good now because prices are lower and an entire week red. This is good, simply more consolidation before the start of the 2025 bull market phase-wave.
We are going up, and it will be awesome.
Namaste.
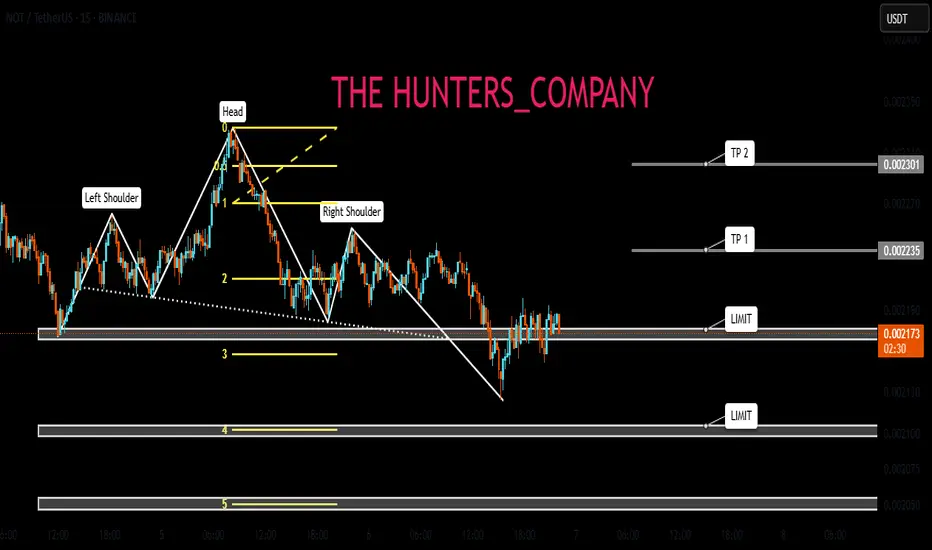
NOTCOIN : IT'S TIME TO BUY GUYSHello dears
If you are risk-averse, this analysis is for you...
According to the bullish pattern that has formed, you can see that we had a decline and now it is time to take a logical risk, that is, we buy at the specified levels with capital management to move towards the specified goals...
*Trade safely with us*