BAKE / USDT : Breakout PotentialBAKE/USDT - Breakout Potential
BAKE/USDT has recently broken above a key resistance zone and is attempting a trend reversal. With the trendline resistance already broken, we are expecting a bullish move towards the $0.124 target, which represents a potential gain of 116.5% from the current price.
Bullish Scenario:
Breakout above the resistance zone confirms the trend reversal, targeting $0.124 with a +116.5% upside.
Pro Tip:
Look for strong volume confirmation during the breakout. Set stop losses just below the breakout level for risk management.
Cryptomarket

TradeCityPro | Bitcoin Daily Analysis #135👋 Welcome to TradeCity Pro!
Let’s move on to the analysis of Bitcoin and major crypto indices. In this analysis, as usual, I’m going to review the futures triggers for the New York session.
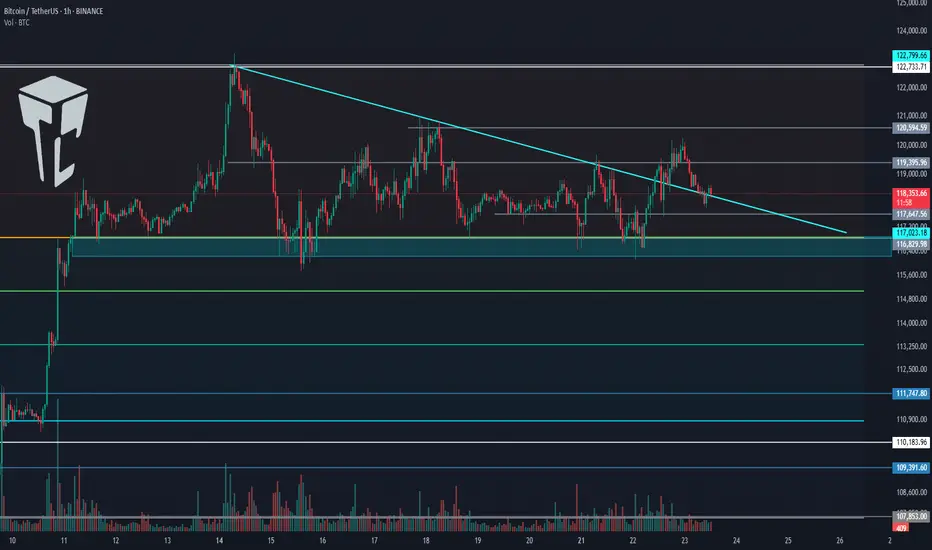
⏳ 1-Hour Timeframe
Yesterday, Bitcoin broke the 119,395 level but couldn’t hold above it and has now returned below this level, currently sitting on its previous trendline.
✔️ Today, the market will probably try to form more structure, and I think Bitcoin will range.
⭐ However, if it wants to move, we can enter a long position with the trigger at 120,594.
🔽 For a short position, we can enter if the 116,000 support area breaks.
👑 BTC.D Analysis
Let’s move on to Bitcoin Dominance. Yesterday, dominance had a bullish move, and finally, a support floor managed to prevent further drop in dominance.
🧩 A retracement to 61.20 has occurred. If this retracement continues, the upper levels are 61.53 and 62.
A break of 60.46 will start the next bearish leg.
📅 Total2 Analysis
Let’s go to Total2. This index has formed a range box between 1.48 and 1.55 and is still oscillating within it.
🎲 If 1.55 breaks, we can open a long position, and on the other hand, if 1.48 breaks, the price could correct to lower support levels.
📅 USDT.D Analysis
Let’s move on to Tether Dominance. This index also has a range box and is still moving inside it.
🔑 Breaking 4.13 is very important for the future market trend and could lead to a drop in dominance.
BERT Approaching Green Support Zone 🚨 BERT Approaching Green Support Zone 🟢📉
BERT is now approaching a key support level in green.
This area has shown buyer interest in the past, and the price could potentially bounce from this zone.
📌 Wait for confirmation before entering long.
If confirmed, it could offer a strong risk/reward opportunity.

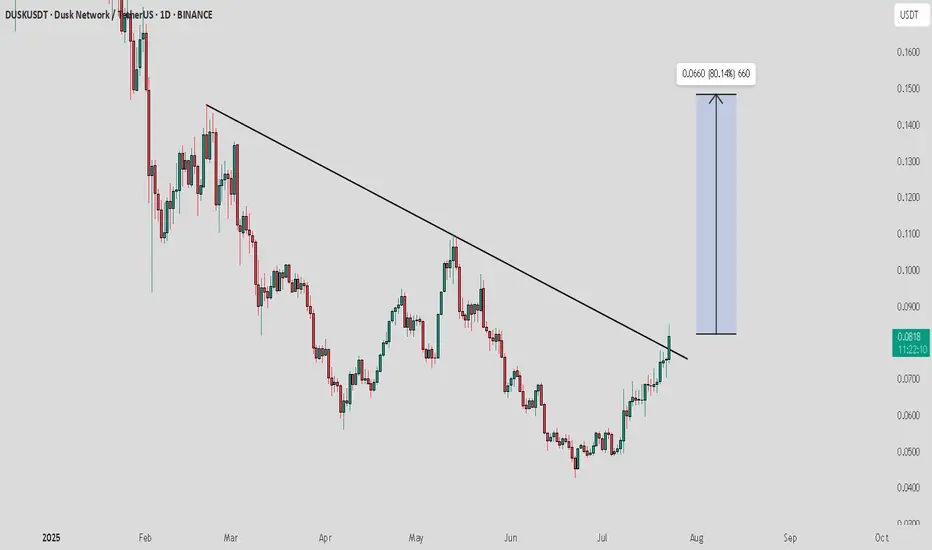
DUSK / USDT : Trend reversal in progressDUSK/USDT - Trend Reversal in Progress
DUSK/USDT has recently broken above a significant downtrend resistance line, signaling a potential trend reversal. With a successful breakout, we’re expecting a strong move towards the $0.0660 target, representing an 80% potential upside from the current price.
Bullish Scenario:
Break above the downtrend resistance confirmed, setting the stage for a significant move toward $0.0660.
A sustained uptrend could lead to further gains in the medium term.
Pro Tip:
Watch for confirmation with increased volume during the breakout. Manage risk by setting stop losses below the breakout level.
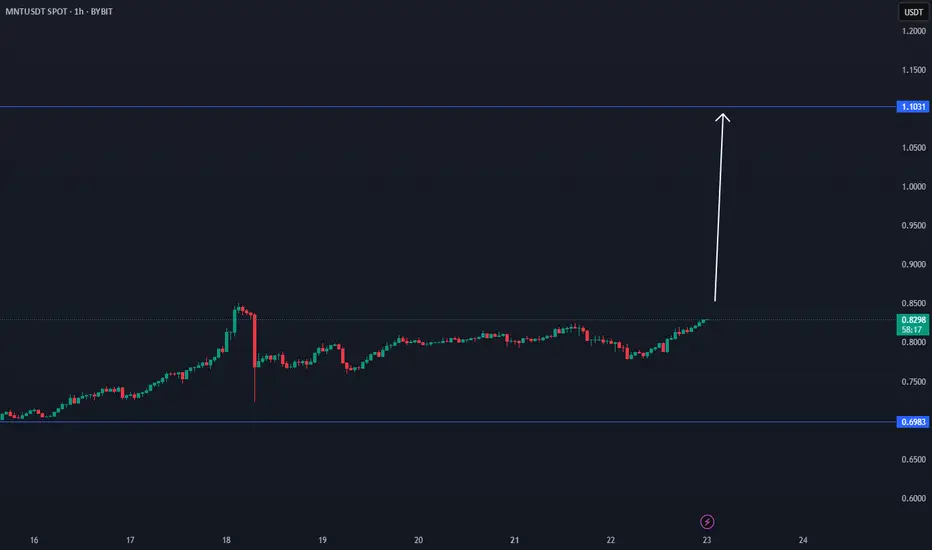
MNT TIME FRAME BREAKMNT has a good chance to break in the coming hours, depending last data.
$1.10 is an important target. 32% increase possibility.
Coin has acctive volume.
BTC correction august/septemberBTC has reached overbought territory, there is also bearisch divergence. It also didnt go above 123k anymore. i expect a correction in august/september.
dont chase FOMO, be prepared. Nothing goes in a straight line. there are always corrections.
CRYPTO:BTCUSD BINANCE:BTCUSD CME:BTC1! BINANCE:BTCUSDU2025

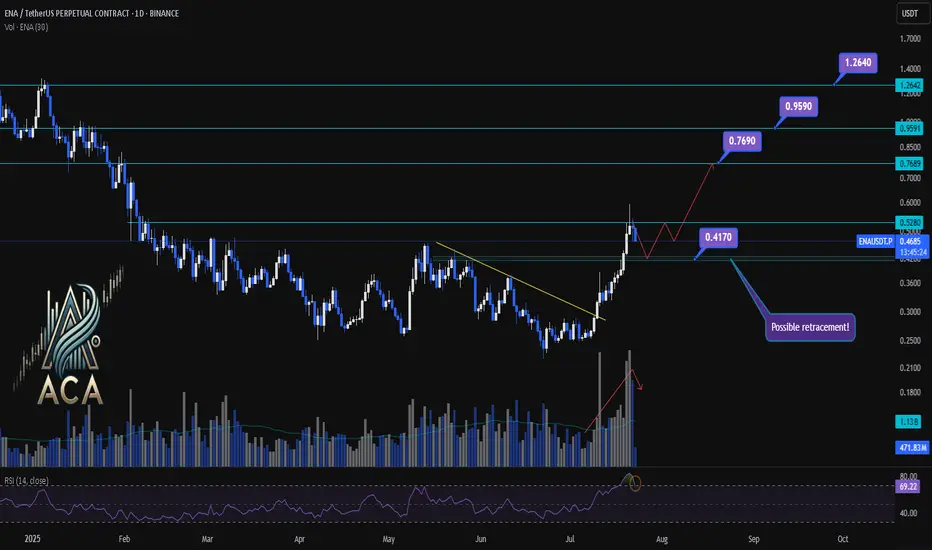
ENA/USDT Chart Analysis | Volatility Signals & Bullish TriggersENA/USDT Chart Analysis | Volatility Signals & Bullish Triggers
🔍 Let’s dive into the ENA/USDT perpetual contract and analyze recent price action, focusing on momentum shifts and key breakout scenarios.
⏳ Daily Overview
The daily chart shows that ENA recently reentered the overbought zone on the RSI, which can serve as a potential trigger for traders watching momentum shifts. Earlier, price action broke decisively above a long-standing descending trendline, resulting in a rapid, nearly 100% surge, a classic RR2 move off the trendline. This breakout coincided with a visible uptick in trading volume, confirming strong demand behind the move.
Now, during the ensuing rest or correction phase, trading volume is decreasing—often a constructive sign suggesting either profit-taking or a healthy pullback rather than panic selling.
🔺 Bullish Trigger & Setup:
- RSI Signal: Reentry into the RSI overbought zone is a potential long trigger, especially if confirmed by price action.
- Confirmation Level: A daily close with strong volume above $0.528 would add conviction to a bullish setup.
- Trendline Reference: The break above the recent trendline fueled the rapid advance, showing the importance of watching such key resistance levels.
📊 Key Targets (on further bullish confirmation):
- $0.769 — First upside resistance.
- $0.959 — Next bullish target.
- $1.264 — Extension target if momentum continues and broader market sentiment remains supportive.
🚨 Conclusion:
Eyes are on the $0.528 level—closing above it with volume, especially while RSI holds in the overbought zone, could provide the next strong entry signal. Current declining volume during pullbacks suggests this is likely a profit-taking phase or standard correction, not bearish capitulation. Keep monitoring RSI, volume profile, and price closes for the next actionable opportunity.
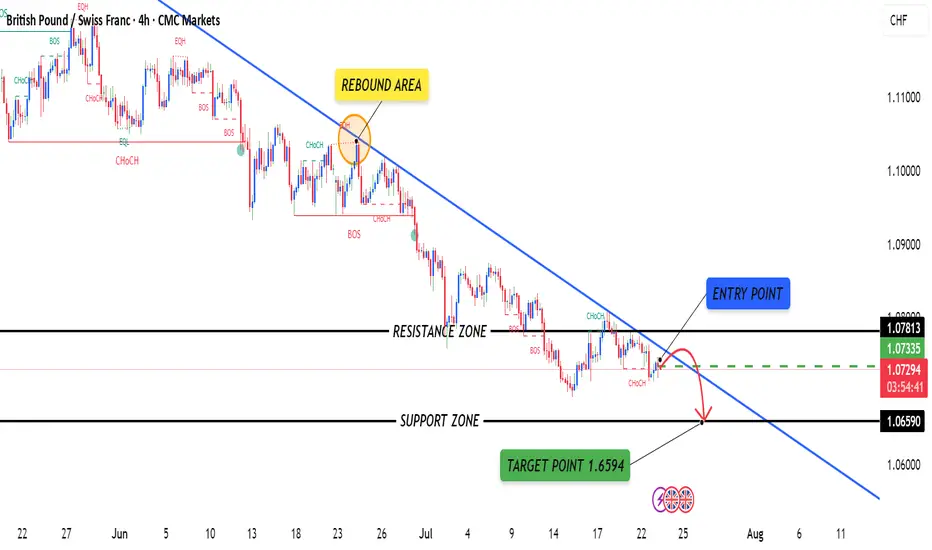
GBPCHFGBPCHF is currently in a downtrend, confirmed by a series of lower highs and lower lows.
The pair has recently formed a bearish engulfing candle below the minor resistance zone near 1.07400, signaling renewed bearish pressure.
Price rejection from the 50 EMA suggests sellers are still in control.
RSI is trending downward, staying below 50, indicating bearish momentum without being oversold.
SPK Testing Red Resistance Zone 🚨 INDEX:SPK Testing Red Resistance Zone 🔴📈
INDEX:SPK is now testing the red resistance zone.
📊 Watch for breakout confirmation — if successful:
🎯 First Target → Green line level
This could signal the beginning of a new move up if buyers push through the resistance.
Let’s track it closely for a potential entry! 💼📈

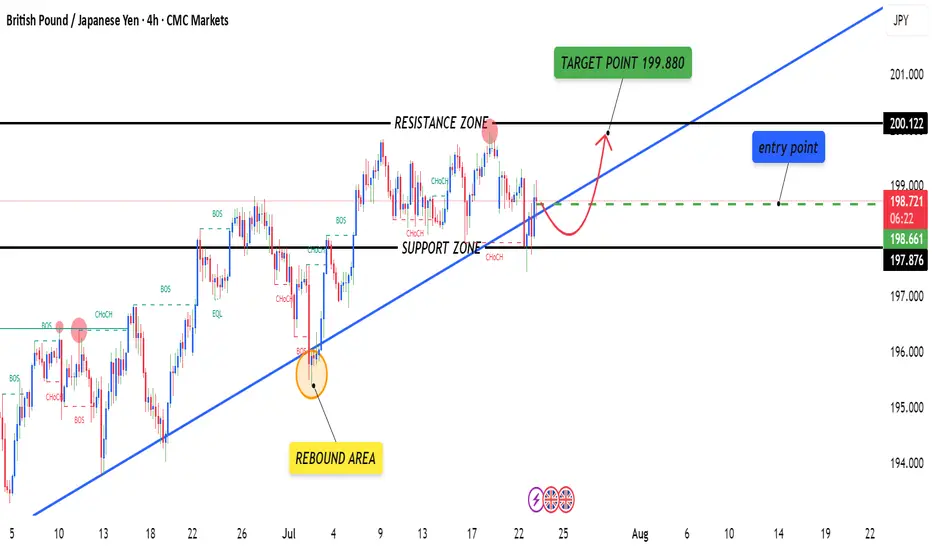
GBPJPY 4HOUR TIME FRAME ANALYISOn the 4-hour chart, GBP/JPY has been tracing out a clear up-trend over the past several weeks, marked by a sequence of higher highs and higher lows. Your proposed long entry at 198.632 neatly coincides with two layers of support:
Trendline support: A rising trendline drawn off the last two significant swing lows intercepts right around 198.6, suggesting the pair is catching a bid as it back-tests that line.
HOOK Testing Red Resistance & Forming Double Bottom🚨 HOOK Testing Red Resistance & Forming Double Bottom 🔴📈
HOOK is currently testing the red resistance trendline and has formed a bullish double bottom pattern, which could indicate a potential reversal.
🎯 If breakout is confirmed:
✅ First Target – Green line level
📊 A confirmed breakout of both the resistance trendline and the double bottom structure could signal strong bullish momentum.
Watch for confirmation before entering! 💼💸

TradeCityPro | AAVE Holds Gains as Altseason Optimism Builds👋 Welcome to TradeCity Pro!
In this analysis, I’m going to review the AAVE coin for you. It’s one of the major DeFi coins active in the lending sector and currently ranks number 1 in terms of TVL.
✔️ The token itself has a market cap of $4.58 billion and is ranked 29 on CoinMarketCap.
📅 Daily Timeframe
On the daily timeframe, since our last analysis, the price has increased by over 100%, and the trigger for long or buy positions was activated.
🔄 There was a descending trendline on this coin, and the trigger for its breakout was 148.17. After breaking that level, we could open a long position.
🚀 However, the main trigger was 194.97, and the primary uptrend started with the break of that level, continuing up to a high of 328.9.
📊 The issue with this current uptrend is that, as you can see in the second leg, there is clear weakness, which is not a good sign for the continuation of this trend.
📈 The current top at 328.9 is not far from the previous high, forming a double top-like structure, leading to a strong bearish divergence in the RSI.
💥 If RSI confirms a breakdown below 50, this divergence will become active and a correction toward 222.10 may occur. A break of that level would be the first signal of a potential trend reversal for AAVE.
⭐ On the other hand, if price wants to continue upward, we have a very important resistance at 383.59.
🔍 Breaking this resistance would initiate an uptrend in higher cycles and could even lead to a new ATH for this coin.
💼 I plan to open a long position if the 328.9 resistance is broken, and for spot purchases, I will wait for a breakout of 383.59.As long as the price remains above 279.45, I am not considering any short positions.
📝 Final Thoughts
This analysis reflects our opinions and is not financial advice.
Share your thoughts in the comments, and don’t forget to share this analysis with your friends! ❤️

Bullish Cup & Handle Pattern Formed 🚨 SEED_WANDERIN_JIMZIP900:WIF Testing Red Resistance – Bullish Cup & Handle Pattern Formed 📈
SEED_WANDERIN_JIMZIP900:WIF is currently testing the red resistance zone and has formed a bullish cup and handle pattern on the chart.
If a breakout occurs, potential upside toward:
✅ First Target: Green line level
✅ Second Target: Green line level
Wait for breakout confirmation before entering long. 📊
Patience is key—watch this closely! 💼💸

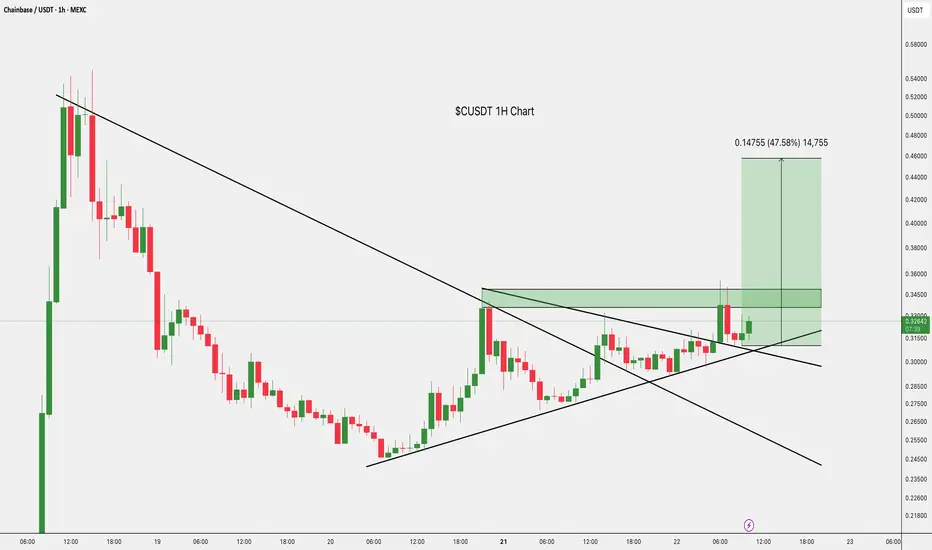
$CUSDT Breakout Targeting $0.47BITGET:CUSDT just broke out of and is now retesting the $0.34–$0.35 resistance zone.
If this level holds, we could see a strong move toward $0.47, nearly a 47% upside.
Momentum looks solid, but confirmation will come with a clean bounce.
DYOR, NFA
When Altseason? Clues in other chart Ex) #1Hi guys.
So Its no secret bitcoin has been ripping.
We are at new all time highs, and in full on price discovery mode.
I recently posted an ongoing macro analysis on ADA (Cardano) supporting my theory that it is one of the better alts to be investing in for alt explosion.
I want to look elsewhere to see if i can find supporting evidence that its time to invest or trade altcoins.
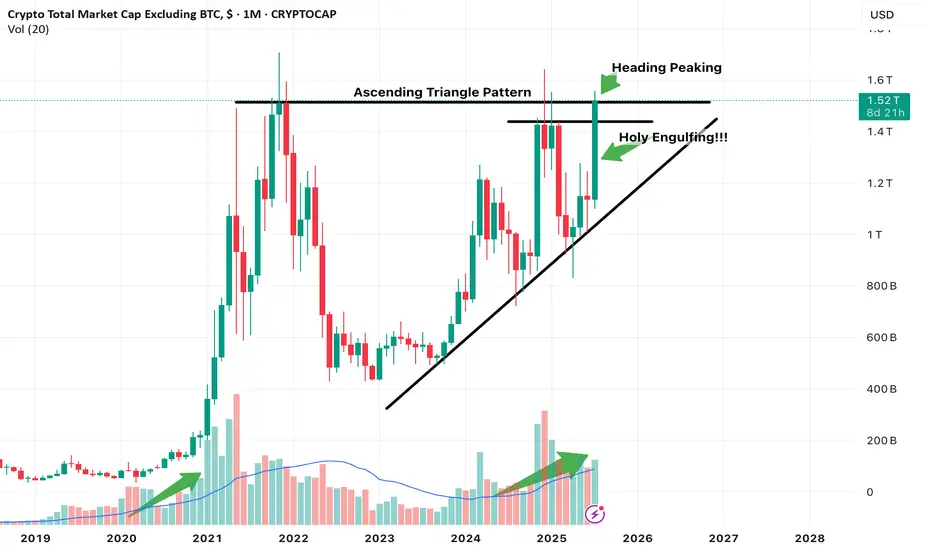
One chart that can be used is the Total Market Cap of Crypto excluding Bitcoin.
This chart showcases total altcoin market capitalization and its movements.
I believe certain Technical developments can really help us gauge at whats to come.
NOte this is on the 1 Month timeframe aka looking into Macro developments.
Just focusing on Candlestick action.
Notice we have been in this ascending channel trend, along with a potential Ascending triangle pattern development which if breakout occurs with confirmation can push Altcoin market cap higher indicating that liquidity is entering altcoins which indicates potential Uptrend.
The month of July so far is in position to print a massive engulfing Bullish candle, which is a great sign.
The upper part is also peaking its head above the Horizontal resistance line. Need to observe confirmation of this breakout. Look for it in smaller timeframes, ill look for it in the 3 day or 5 day.
We are also in position to print a higher high first time in a while.
Notice also Volume. We are seeing currently similar increasing volume as previous alt coin market cap expansion.
Keep an eye out on more posts to add to evidence that supports we are in the verge of potential altcoin season.
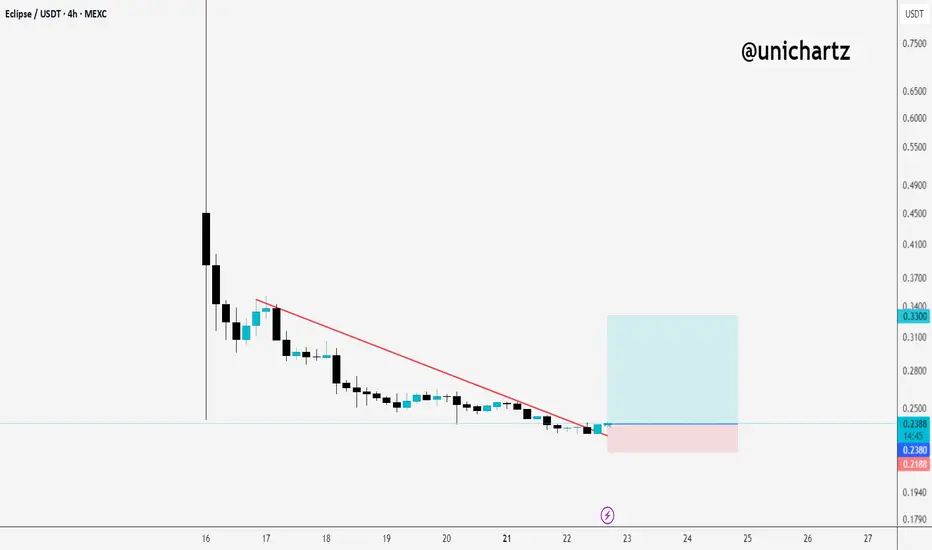
Eclipse Wakes Up After Bleed – Bounce Incoming?ES/USDT just broke above the short-term downtrend line after a long bleed.
Volume is still low, but this could be the first sign of a shift.
As long as it holds above $0.2188, there’s a good chance of a relief bounce toward $0.33.
Early, risky, but worth watching closely.
DYOR
Cardano (ADA) a solid play in crypto, a Macro lookHi guys, so with Bitcoin in price discovery mode. It hints at the final phase of Crypto bull in action. With that comes altseason and in my opinion explosive growth in altcoins.
1 particular coin i've been looking at is Cardano (ADA).
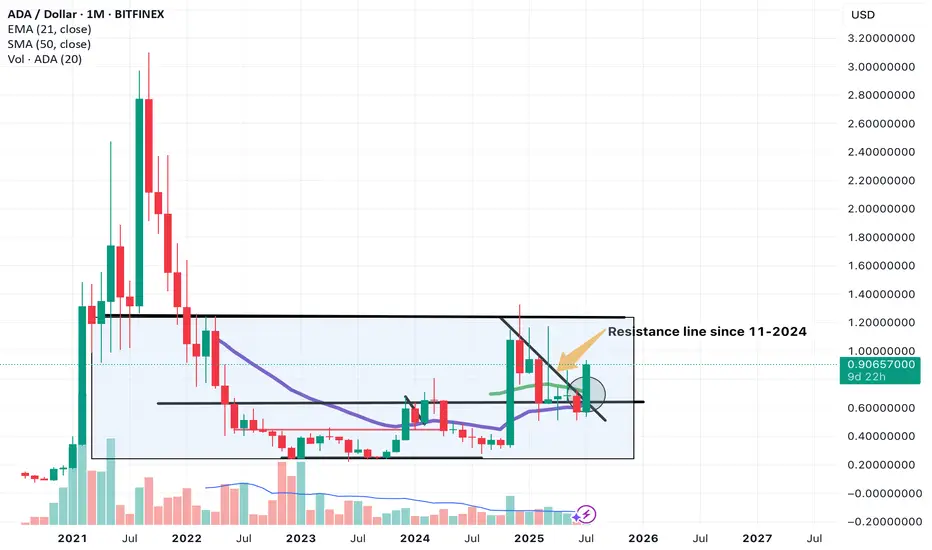
This is a macro technical analysis of ADA on the 1 month timeframe. So each candle is 1 month of price action. This is very powerful on its own. And can give signs into where an asset will trend.
If you compare this to majority of other alts, its looking alot more bullish and is ahead of the game.
SO jumping right in.
Lets look at price action. Notice we are in a macro rectangle or sideways pattern.
Upper limit at $1.24
Lower limit at around $0.25.
This indicates a consolidation phase.
Real action is seen above that upper limit. Where we see explosive price action to the upside. Previously in Sept 2021 seeing highs of up to $3.07.
I believe we are making our way up to this $1.24 level.
Which in the short term will be a solid area to take profit due to it being a major supply zone in my opinion or sell zone. With a potential pull back. This is because if you look previously in price history, cardano price movement heavily involves this level with most of price history being either above or below $1.24.
A key sign but not yet confirmation is a breakout above this slanted resistance line we were being pushed down from that was created in 11-2024.
We have an engulfing candle break out currently. But still awaiting confirmation which will require august monthly candle to stay above this line and present a bullish candle print.
We will be on the look out for this.
There are other signs and signals appearing in Cardano (ADA) that support my theory and Price action developments. To take trades i always look for multiple signs that overlap.
Stay tune for more of that where ill go over many different indicators and other aspects that point to ADA being above other alts as a solid trade or investment for the next altseason.
$AIXBT Breaks Trendline – Sharp Move Ahead?$AIXBT just broke out of its downtrend and flipped resistance into support, classic breakout behavior.
It’s now pushing toward a key resistance zone, and if it clears that level, we could see a sharp move up.
Momentum is shifting, this chart deserves your attention.
DYOR, NFA

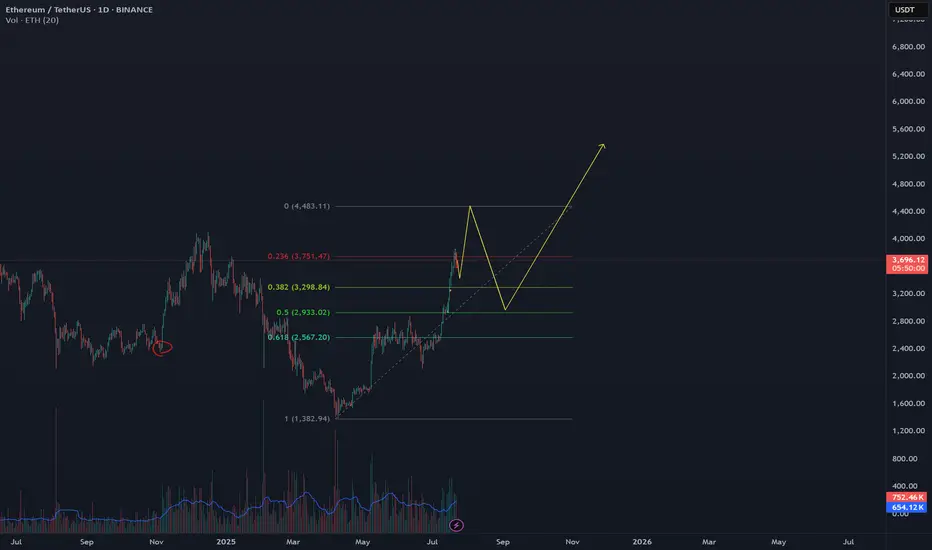
gold vs ethIf we follow this fractal, we should top around $4k and then a pullback to $3k followed by news highs in Q4
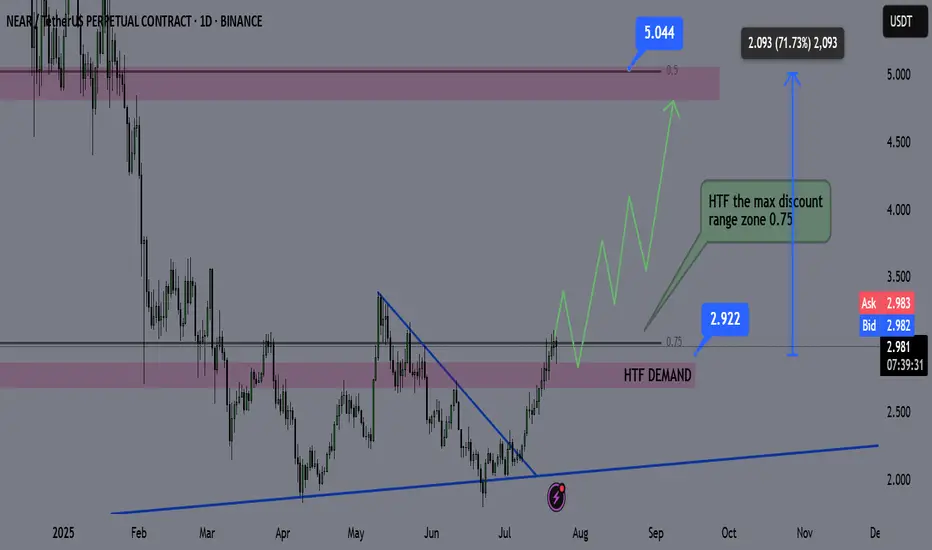
NEAR Swing Long Idea - Altseason 2025📌 Fundamental Sentiment:
The entire crypto market is rallying, alongside other risk assets. This is mainly driven by U.S. policy expectations — Trump is pressuring Powell to resign and aggressively pushing for rate cuts from the Federal Reserve.
📌 Technical Analysis:
NEAR has recently broken and closed above a significant HTF support/resistance level.
Additionally, we’re now trading inside the 0.75 Fibonacci retracement level of the HTF bullish trend — which I define as the maximum discounted zone.
For this setup, I’ll apply my Deep Range Theory (DRT):
If price dips below the 0.75 zone and accumulates there,
Then breaks above 0.75 after a period of consolidation,
→ It signals that price aims for the 0.5 level of the range and will likely run HTF liquidity for either reversal or re-accumulation before continuation.
📌 Gameplan:
✅ Break and close above HTF S/R
⏳ Waiting for break and daily close above 0.75
🔄 Retest to LTF demand (4H–1H)
📈 A bounce on LTF demand will trigger the long setup
📌 Trade Management:
This is a mid-term swing trade, as I’m following the HTF bullish trend.
🎯 Target: $5 — which is approximately a +70% move from current price.
❗Risk Management:
If price makes a daily close back below 0.75 after breaking and closing above, I will exit the trade to preserve capital.
I’ll also monitor macro sentiment closely. If there's a sharp bearish shift, I may consider an early exit before reaching the HTF target.
—
🔔 Follow the channel for daily trade ideas & weekly macro recaps.
💬 Drop a comment below if you have any questions or insights!
THETA Long Swing Setup – Accumulation Phase Near BreakoutTHETA is still consolidating in a range, but momentum is quietly building. A break above $1.07 followed by a higher low would confirm structural reversal. We’re eyeing the $0.95–$1.00 zone for a clean entry on retest, offering solid risk-reward if support holds.
📌 Trade Setup:
• Entry Zone: $0.95 – $1.00
• Take Profit Targets:
o 🥇 $1.60 – $1.70
o 🥈 $2.10 – $2.20
• Stop Loss: Daily close below $0.90

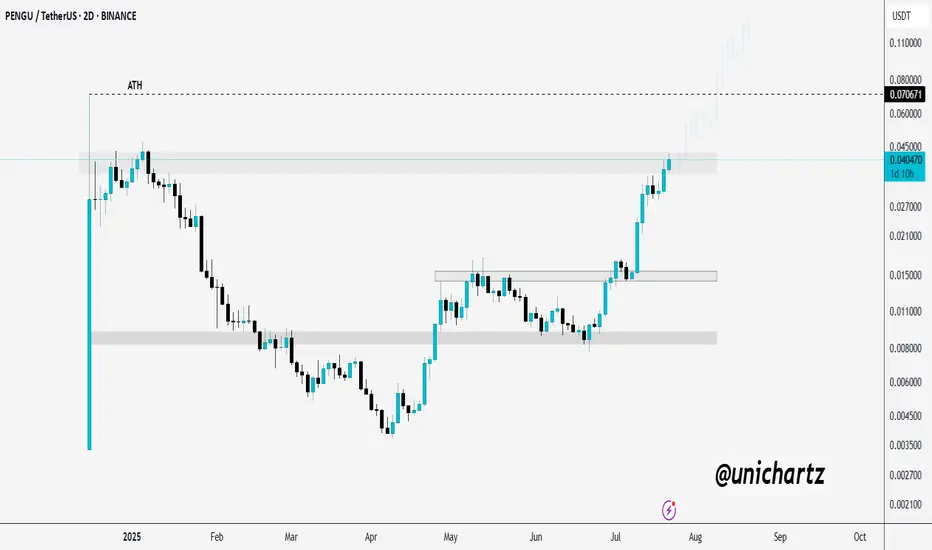
PENGU Approaching Key Breakout Zone – Eyes on ATHCSECY:PENGU is testing a major resistance zone — and it’s heating up! 🔥
If it manages to break and close above this level, we could see a strong rally toward the ATH and beyond.
Keep it on your radar, this move could get explosive.
DYOR, NFA
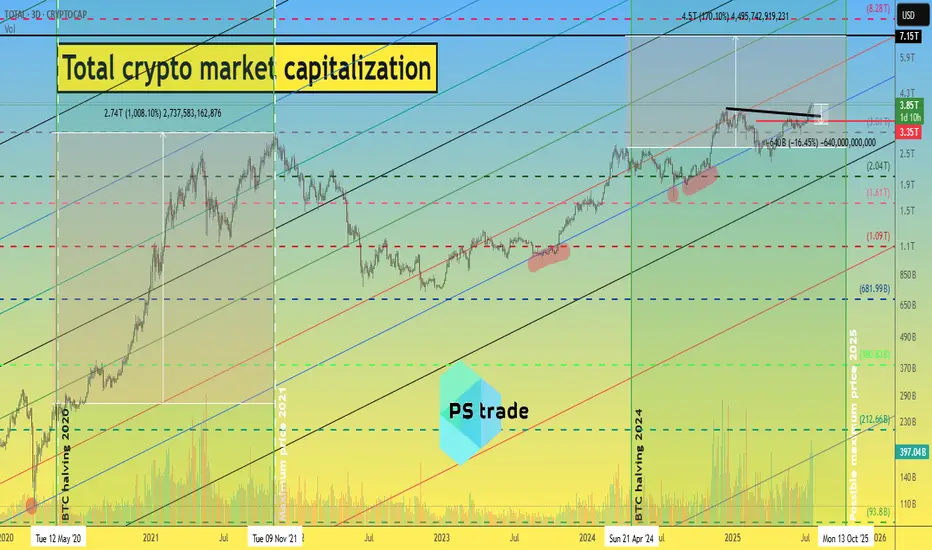
What to expect in the crypto market until 2026 ?!📈 Today, we will look at the graph of the total capitalization of the cryptocurrency market, as well as the implementation of our ideas from 2022 to 2025.
At that time, the cryptocurrency market was in a total depression, there was no talk of BlackRock or MicroStrategy buying cryptocurrencies, and we stubbornly wrote that this was the bottom... and then a miracle happened)
During this time, the total capitalization of the crypto market grew 5 times from $800 million to $4 billion.
ℹ️ You can find all posts in the channel by searching by date:
1️⃣ 18.11.22 - “How much can the crypto market capitalization grow by the end of 2025?”
The growth momentum is slowing down, but the following ideas give hope.
2️⃣ December 30, 2022 - “Plans for 2023-25”
If we are to believe this fractal, which has been working for over 2.5 years, then all the most interesting things are still ahead.
3️⃣ 29.02.2024 - “What to expect from the crypto market in 2024-26”
At the beginning of 2024, the previously published fractal was slightly adjusted to the market situation.
4️⃣ 04.03.2025 - “The total capitalization of the crypto market is on the verge of a foul.”
Then, despite the market depression and a lot of negative news, the total capitalization still managed to stay above the blue trend line.
📊 Cryptocurrency market capitalization as of 22.07.25:
◆ Bitcoin - $2.36 trillion
◆ Ethereum - $442 million
◆ Ripple - $206 billion
◆ SOL and BNB - $110 billion each
◆ USDT and USDC - $162 billion and $65 billion, respectively.
In total, this is $3.45 trillion out of $3.89 trillion of the total crypto market capitalization.
♎️ Too much capital is concentrated in the top 7 projects; we need a process of capital flow and the launch of exponential growth. Especially since all of the above fractals “suggest” that the time has come and anything is possible.
🔃 The total capitalization of the crypto market must continue to remain above the blue trend line, i.e., it cannot be adjusted by more than -13-16% to $3.25-3.35 trillion.
Roughly speaking, the price of CRYPTOCAP:BTC cannot be adjusted by more than -10% due to its high dominance at the moment. (Such an adjustment of the #BTCUSDT price fits into the scenario we published a few days ago.)
_____________________
Did you like our analysis? Leave a comment, like, and follow to get more