Bull and Bear Cases for Crypto Total Market Cap as of July 2025This chart outlines my views of where Total might go in the next few months - considering both Bull and Bear possibilities.
We are in a similar spot to 2021 peak at the moment, but still not as euphoric so it's a toss up as to which direction Total may move.
Current Total Market Cap - ~4T
Bull Case - Crypto Total Market Cap:
Consolidate here for a few weeks (~4T)
Bounce off 7MA flag
Break current diagonal resistance from 2021 peak
Parabola up to 5T by Nov / Dec
Top there
Bear Case - Crypto Total Market Cap:
Top here, push down
Bounce off 25MA
Reject off 7MA to below 50MA
Bounce to 25MA and reject lower
Slice down through 99ma
Take support at 200MA, small bounce
Double bottom below 200MA
Fresh cycle
These are just ideas. The future doesn't mimic the past but it does move in a mathematically sound manner. TA accuracy in forecasting can be affected by several real-world events, specially considering how volatile the world is at the moment.
Cryptomarket

BITCOIN current and past FAIR VALUE GAPS -Watch for the future ?An explanation of what a FAIR VALUE GAP ( FVG) is at the end of this post.
The stand out for me here is simply how almost EVERY Fair Value Gap ( FVG) gets filled in every cycle. There are very few FVG from the 2017 to 2021 ctcle and only one from 2013 to 2017.
The question I now pose to myself is what will happen this time ? Because things are very different.
The potential for a return to the 50K area is Very real should we go back into a BEAR.
But to enter a Bear, we need the corporations to sell up..
Will they ?
We have to wait and see
Fair Value Gap
A fair value gap (FVG) is a price range on a chart where an imbalance exists between buyers and sellers, often resulting from sudden and strong price movements that leave a void where little or no trading took place.
These gaps occur when there is a significant difference between buy and sell orders, indicating an imbalance that can influence market prices.
Traders use FVGs to identify market imbalances and inefficiencies, which can present potential trading opportunities.
Definition: A fair value gap is a price range on a chart where an imbalance exists between buyers and sellers, often resulting from sudden and strong price movements that leave a void where little or no trading took place.
Formation: FVGs occur when buying or selling pressure leads to significant price movements, leaving behind gaps on price charts. These gaps can be identified through technical analysis involving the analysis of candlestick patterns and price chart patterns.
Types: Traders can categorize FVGs into two types: Undervalued FVGs, where prices are lower than fair value, and Overrated FVGs, where prices are higher.
Identification: FVGs are typically identified through a three-candle pattern on a price chart. The first and third candles serve as barriers, while the middle candle is the largest, creating a gap between the wicks of the first and third candles.
Trading Strategy: The fair value gap trading strategy involves identifying price gaps, waiting for the price to return to the gap, and executing trades based on the expectation that the price will resume its original trend. This approach requires a disciplined risk management plan.

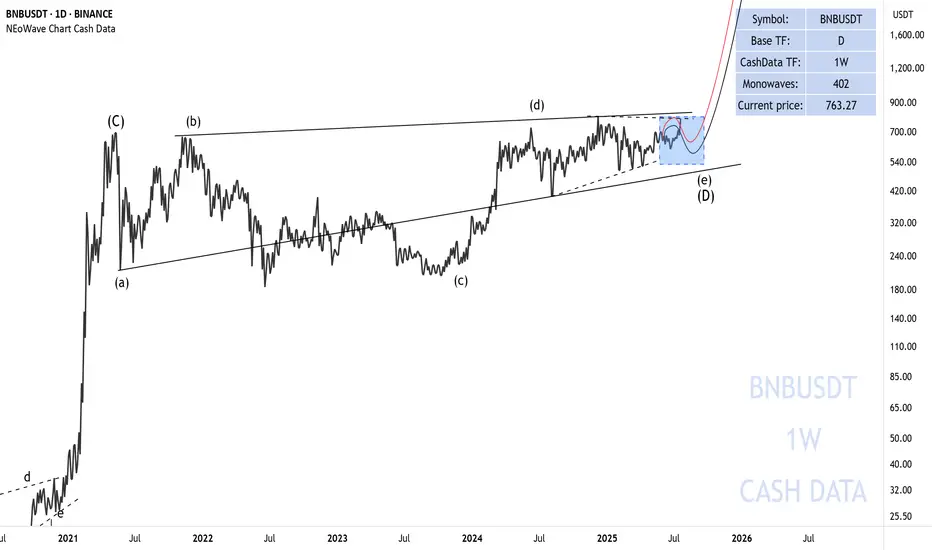
BNB is getting ready to riseThe first bullish move I was expecting for BNB has taken place and it looks like we should be waiting for the formation of wave-e of (e).
After the completion of wave-(e), we expect a big rise for BNB.
Good luck
NEoWave Chart
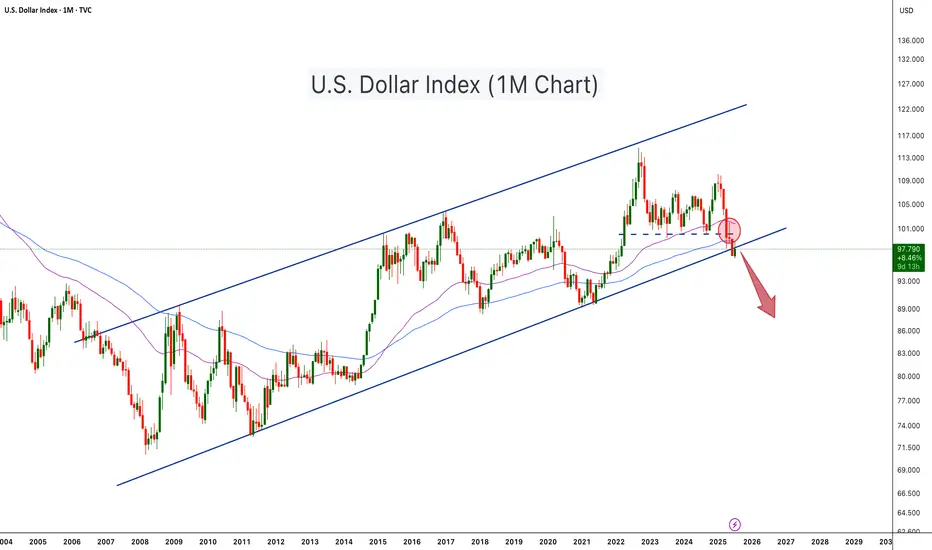
U.S. Dollar Index Loses Key Support – Crypto Bull Run Loading?The U.S. Dollar Index (DXY) has just broken below a long-term ascending channel, which has held since 2008. After losing the key horizontal support (~100 level), DXY retested and rejected from it (red circle), confirming a potential trend reversal. The move is technically significant and hints at further downside, possibly toward the 88–90 zone or lower.
This breakdown aligns with classic macro cycles, where a weaker dollar often fuels bullish momentum in risk assets, especially crypto. Historically:
-DXY downtrends in 2017 and 2020–2021 coincided with major Bitcoin and altcoin bull runs.
-DXY strength during 2018 and 2022 contributed to crypto bear markets.
With DXY now below both horizontal and diagonal support, Bitcoin and the broader crypto market may be entering the next expansion phase, especially if the dollar continues its downward trajectory
-DXY has broken below a 17 year rising channel – a macro bearish signal.
-Rejection from former support turned resistance confirms breakdown.
-A falling DXY historically corresponds with Bitcoin rallies and altseason expansions.
-Declining dollar strength could be the fuel that propels Bitcoin past $140K and Ethereum above $6K.
-A dollar bear trend may fuel total crypto market cap breakout beyond $4T+.
As DXY weakens, liquidity tends to rotate into risk-on assets like crypto. This setup mirrors pre-bull run environments seen in 2017 and 2020. A structural breakdown in the dollar could act as a catalyst for Bitcoin’s next major leg up.
Cheers
Hexa
$WLD Breakout: 200% Move Ahead?MIL:WLD just broke out of a long-term triangle pattern, which could be the start of a big move.
If it stays above the $1.085 zone, we might see it climb toward $3.30, which is over 200% upside.
A clean retest would make this breakout even stronger.
DYOR, NFA

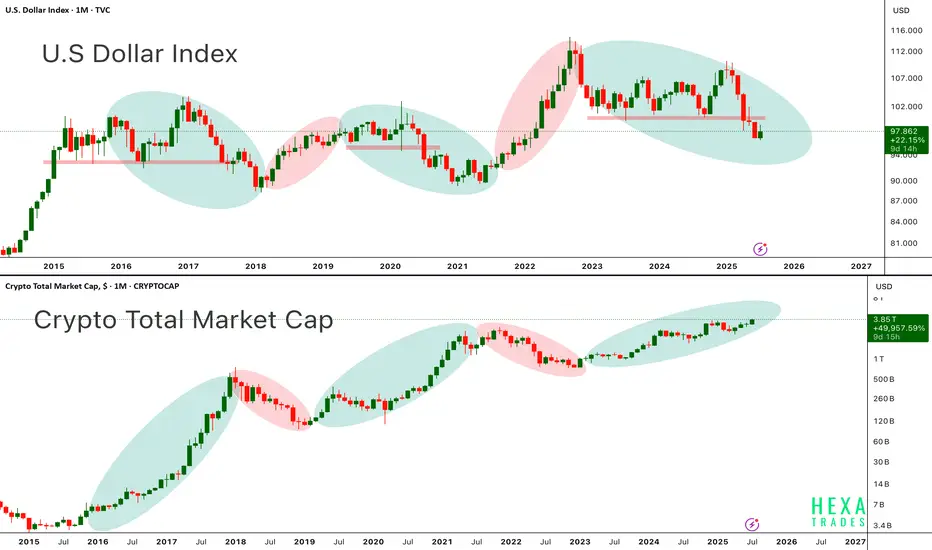
DXY vs. CryptoAbove chart highlights the long standing inverse correlation between the U.S. Dollar Index and the Crypto Total Market Cap a relationship that has guided the macro trend for Bitcoin and altcoins since 2015.
in the first chart, When the dollar weakens (green ovals), crypto tends to rally. When the dollar strengthens (red ovals), crypto markets usually experience corrections or prolonged bear markets.
In the second chart, each period of dollar weakness aligns almost perfectly with explosive crypto upside seen in 2017, 2020–2021, and now potentially again in late 2024 through 2025. Conversely, periods of DXY strength (2018, 2022) coincide with crypto market downturns.
Currently, DXY is entering a downward phase, while the crypto total market cap is pushing higher, now above $3.8 trillion suggesting that a new leg in the crypto bull cycle may be underway. Bitcoin and Ethereum have historically performed best when DXY trends lower, as liquidity shifts into risk-on assets.
Key Points:
-DXY and crypto market cap show a strong inverse macro relationship.
-DXY in a clear downtrend from 2024 highs supportive of further crypto upside.
-Crypto Total Market Cap approaching all-time highs suggesting broad market strength.
-Potential for BTC > $150K and ETH > $6K+ if this macro divergence continues.
-This setup resembles early 2020, right before the massive crypto bull run.
If the dollar continues to weaken structurally, crypto markets led by Bitcoin and Ethereum could see accelerated momentum, pushing into parabolic territory by late 2025.
Cheers
Hexa🧘♀️
Investing in Cryptocurrencies in the current environmentDear Investors,
The cryptocurrency market has experienced significant activity over the past week, with major cryptocurrencies such as Bitcoin and Ethereum reaching all-time highs. However, many alternative coins (altcoins) have yet to follow suit, presenting potential opportunities for strategic investors. This divergence is partly attributed to recent developments in U.S. regulatory efforts, particularly discussions around stablecoin legislation. The signed regulatory framework (Genius act) for stablecoins is viewed as a positive step for the broader crypto industry, as it could foster greater institutional adoption and market stability. Notably, President Trump’s administration has signaled a crypto-friendly stance, which has bolstered market sentiment and contributed to the bullish momentum.
While the surge in top-tier cryptocurrencies is exciting, we caution investors against succumbing to FOMO (Fear of Missing Out) by chasing assets that have already seen significant price increases. Instead, consider reallocating capital toward undervalued altcoins with strong fundamentals, such as Dashcoin, which may offer attractive risk-reward profiles in the current market cycle.
Disclosure: I am part of Trade Nation's Influencer program and receive a monthly fee for using their TradingView charts in my analysis.

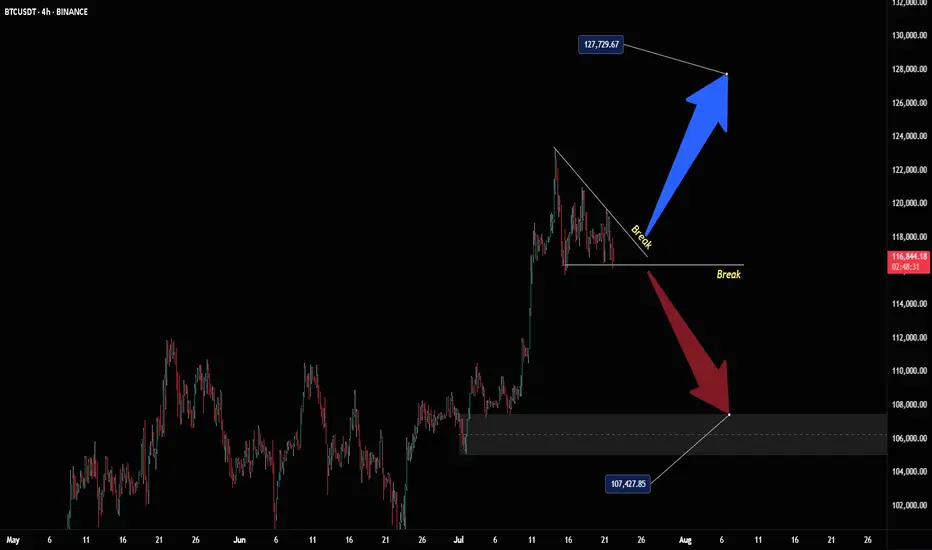
Bitcoin Breakout Bonanza - Ride the Wave, BroYo, check this Bitcoin chart, fam! We’re sittin’ at 107,725, and it’s lookin’ like a wild ride. That break above 127,725 is screamin’ bullish—time to ride the blue arrow up! But watch out, a drop below could send us crashin’ to 107,475 with that red arrow vibe. Stay sharp, dude!
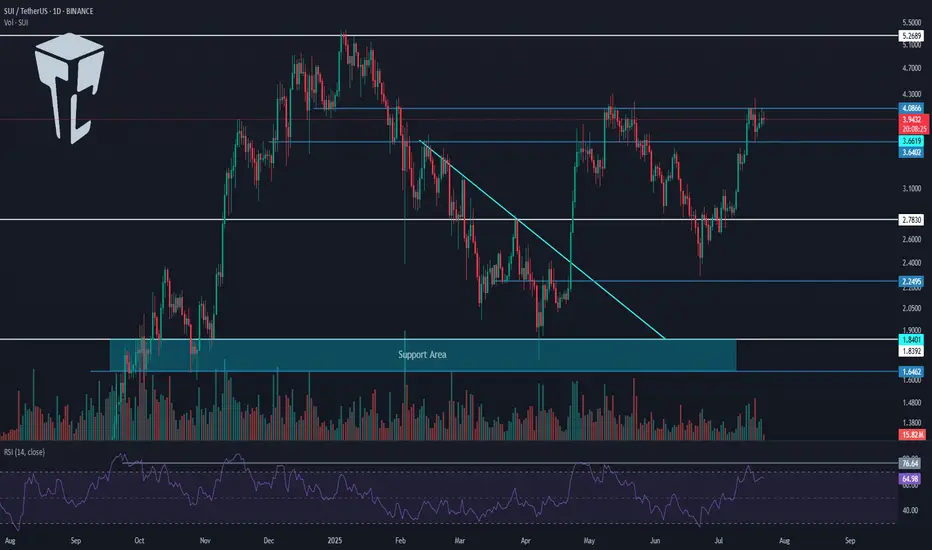
TradeCityPro | SUI Eyes Breakout with Bullish Momentum Rising👋 Welcome to TradeCity Pro!
In this analysis, I want to review the SUI coin for you. It’s one of the Layer1 projects in the crypto space, currently ranked 13 on CoinMarketCap with a market cap of $13.66 billion.
📅 Daily Timeframe
On the daily timeframe, a lot has changed for SUI since the previous analysis. After breaking the descending trendline, it has started a new bullish trend.
✔️ In the first bullish leg after breaking the trendline, the price reached the 4.0866 zone, and now after a correction, it’s moving upward again.
📈 The 4.0866 level is a very important resistance. In fact, we can draw a resistance range between 3.6402 and 4.0866, as the price tends to behave erratically within this zone.
⭐ Currently, the price has re-entered this range and if 4.0866 is broken, the bullish wave could continue. The first target for this wave could be 5.2689.
🔼 So, if 4.0866 is broken, I highly recommend opening a long position, because if the price truly breaks this level (and it’s not a fake breakout), then the minimum target would be 5.2689.
📊 If the buying volume continues to increase as it is now, and the RSI breaks above 76.64, the chances of breaking 5.2689 will also rise, and the price may even set a new ATH.
👀 I already have an open position on this coin based on lower timeframe triggers, and I’m currently waiting to see the reaction to 4.0866. Based on my entry, if the price moves toward 5.2689, the risk-to-reward ratio will be very high. That’s why I’ve kept part of my position open to potentially capture that move.
🛒 For spot buying, we can also use a futures strategy — meaning if 4.0866 breaks, we open a futures position targeting 5.2689, and then use the profit from that position to buy SUI in spot, gradually building our spot portfolio.
✨ If you are looking at this coin only for spot, the main trigger is the breakout of 5.2689. But be careful — if the price moves aggressively, it might not give you a proper entry trigger, and entering from that area might be difficult.
📝 Final Thoughts
This analysis reflects our opinions and is not financial advice.
Share your thoughts in the comments, and don’t forget to share this analysis with your friends! ❤️
SOLANA DRIVING UP TO 294 Good evening everyone
It looks like SOL made a nice W pattern and now breaking its weekly high is driving up to 294
Enjoy happy trading this bull run
Kris/ Mindbloome Exchange
Trader Smarter Live Better

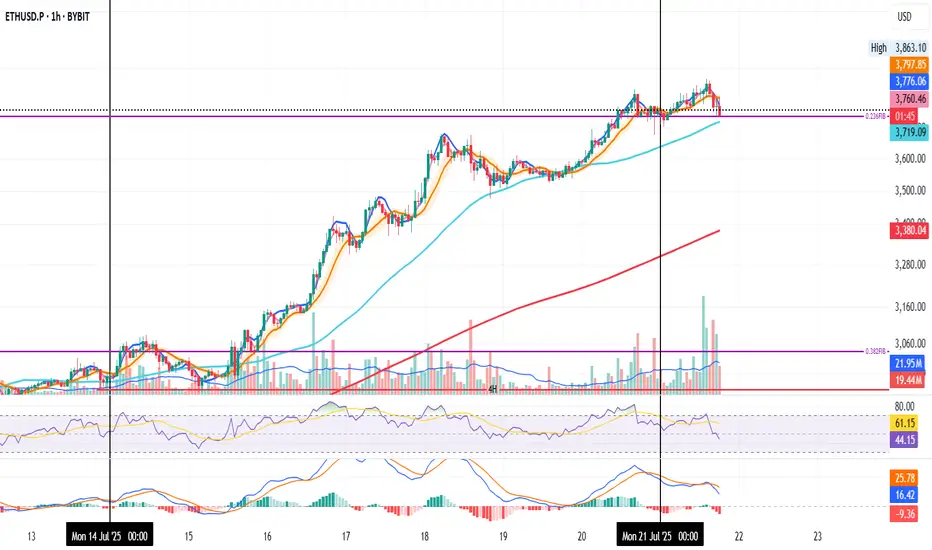
ETH on the 1H and the 0.236 Fib level
Could be a retest. Could be a fakeout. Could be the start of a move down.
RSI and MACD are both dropping.
SMA < MLR < BB Center confirms a downtrend.
50MA is sitting below the Fib level.
200MA is far below at $3,400, but rising quickly.
If tonight’s candles start closing under the Fib level, the warning gets louder.
If not, more upside remains likely.
Always take profits and manage risk.
Interaction is welcome.
BTC Update – Short-Term Pressure Building
Bitcoin is still being pushed down below the BB center.
RSI is trending lower, and MACD is nearing a bearish crossover.
PSAR is hovering close to price, a warning sign.
This could still be a pause before the next leg up — but don’t ignore the signs.
And just a thought: Trump Media buying $2B in BTC might’ve marked a local top.
Prepare in advance.
Always take profits and manage risk.
Interaction is welcome.

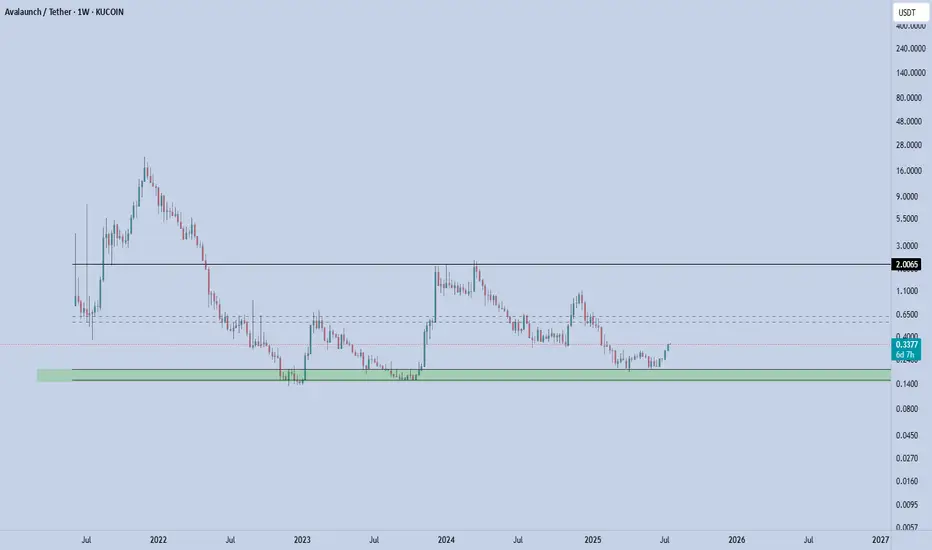
XAVA - Rebound in Play XAVA coin is currently stabilizing in a key support zone — the bottom of the defined channel, which has proven to be a strong and reliable support area. Price recently bounced from this level, confirming buyer interest.
From here, the next immediate target is the mid-range of the channel. If price manages to break above and hold the mid-channel, the next upside objective becomes the top of the channel.
Key Levels
Support (Channel Low): 0.15(invalidation below this level)
First Target (Mid-Channel): 0.56-0.62
Second Target (Channel High): 2
📌 Risk Management: A clean break below 0.15 invalidates this setup. As long as this level holds, the structure remains constructive and favors rotation toward higher levels within the channel.
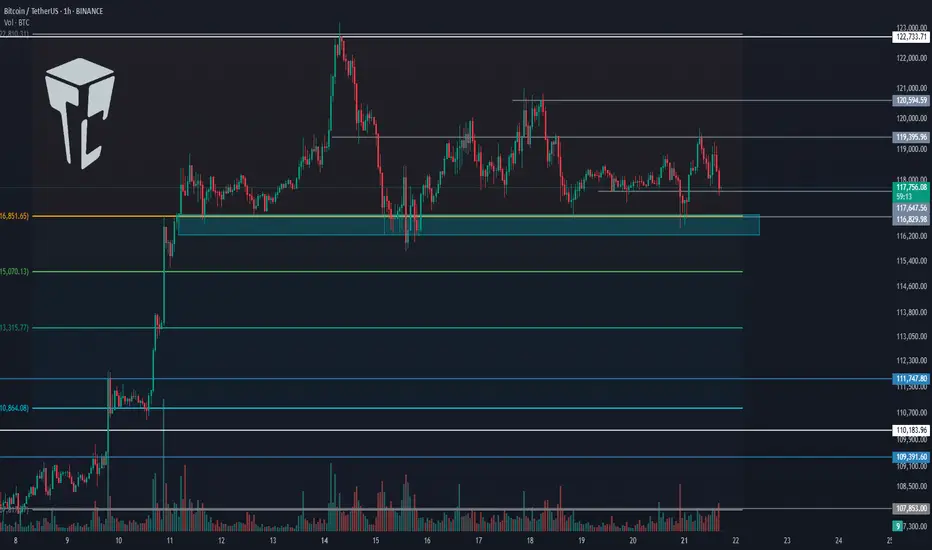
TradeCityPro | Bitcoin Daily Analysis #133👋 Welcome to TradeCity Pro!
Let's dive into the Bitcoin analysis and key crypto indexes. As usual, in this analysis, I’m going to review the triggers for the New York futures session.
⏳ 1-Hour timeframe
On the 1-hour timeframe, Bitcoin has once again dropped to the support area at 116829 and reacted to it. Currently, it is fluctuating above this level.
✨ If 119395 is broken, the price could move toward the highs at 120594 and 122733.
📈 So for a long position, we can enter on the breakout of 119395. Pay attention to Bitcoin dominance, because if it’s in a downtrend, Bitcoin setups might not be ideal, and altcoins may offer better opportunities.
✔️ If the price stabilizes below 117647, it will enter the box between 116829 and 117647, and this time the likelihood of breaking the 116829 bottom and heading toward lower supports for deeper corrections becomes very high.
👑 BTC.D Analysis
Now let’s look at Bitcoin Dominance. BTC.D is still falling and after breaking the 61.45 level, it has reached 60.46.
⭐ If this level breaks, the next bearish leg may begin. The trend is strongly bearish with no visible weakness, and we’ll have to see how long this continues.
📅 Total2 Analysis
Let’s move to Total2. This index has broken the 1.5 resistance and is moving toward 1.62.
💫 At the moment, I don’t have a trigger for it, and we need to wait until its structure gives us the next setup.
📅 USDT.D Analysis
Now let’s look at Tether Dominance. This index has stabilized below the 4.22 level and is now moving downward after a pullback to this area.
🧩 The next support is at 4.08, and the index has room to fall to that level. I still see the USDT Dominance trend as bearish for now.
ETH: Huge Reversal or Correction Still in the Horizon?The recent price action in Ethereum (ETH) has left market participants questioning its next major move. With volatility high and sentiment shifting, is ETH headed for a massive reversal, or is a correction still looming on the horizon?
Key Points to Consider
Macro Environment: Global markets are facing uncertainty from shifting interest rates and regulatory developments in crypto. These factors may spark continued volatility for ETH in the near term.
Technical Analysis: ETH has many analysts watching key support and resistance areas. A clean break above resistance could signal a reversal, while a failure to hold recent gains may suggest a correction is not over yet.
On-Chain Data: Activity on the Ethereum network, including DeFi usage and staking patterns, can offer clues as to whether accumulation or distribution is taking place.
Market Sentiment: Traders remain divided, with some calling the recent bounce a bull trap, and others anticipating renewed upside momentum.
My Take
While the case for a reversal is gaining strength, the possibility of a broader correction can’t be dismissed. It’s crucial for investors to stay alert, watch the charts, and position size accordingly. I'm not longing any crypto in the short run...As for the long run, extremely BULLISH!
*not investment advice*
#Ethereum #Crypto #Investing #MarketAnalysis #Web3 #crypto #bitcoin #trading

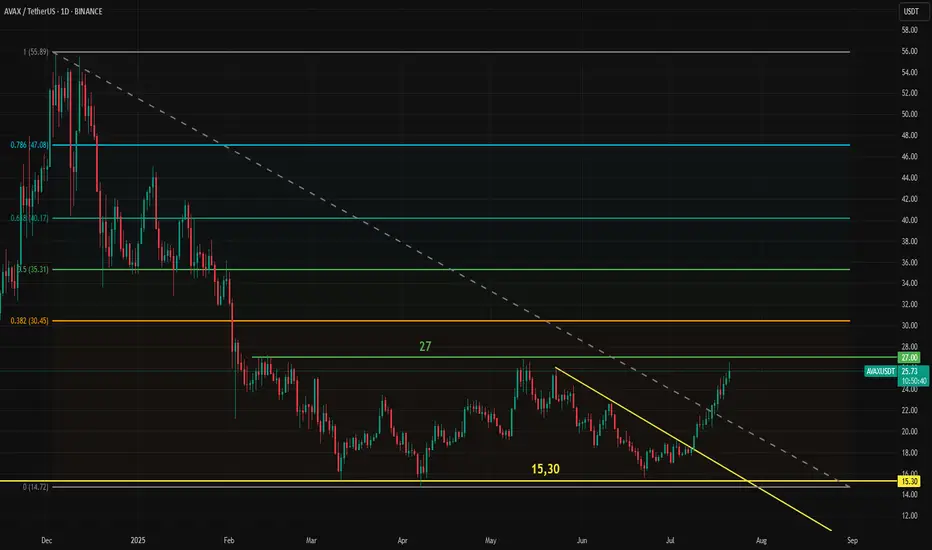
Avax Tests Key Resistance at 27 for the Third TimeAvax is once again testing the 27 resistance level. The first attempt lasted over a week, and the second one held for a couple of days, but in both cases, Avax failed to break through. This time, however, it has stronger support from market-wide momentum.
Bitcoin has reached 120,000, Ethereum is posting sharp gains, and most notably, Chainlink (LINK) has already broken through its own resistance. Avax and LINK have shown a high degree of correlation, nearly 89% over the past two months. This strong relationship, while occasionally fluctuating, has been in place for several years.
A breakout for Avax may take time, but it now has more momentum and supportive conditions behind it. Still, as long as the 27 resistance holds, bulls should approach with caution before entering long positions.
WARNING Bitcoin Dominance is about to reach support -ALTS
All the Cries of "ALT SEASON AT LAST" could be about to stumble if BTC.D finds support on the line of support shown in the chart , that has provided support previously.
There is no way of knowing if it will bounce or not but CAUTION IS A VERY GOOD IDEA
We will know soon enough

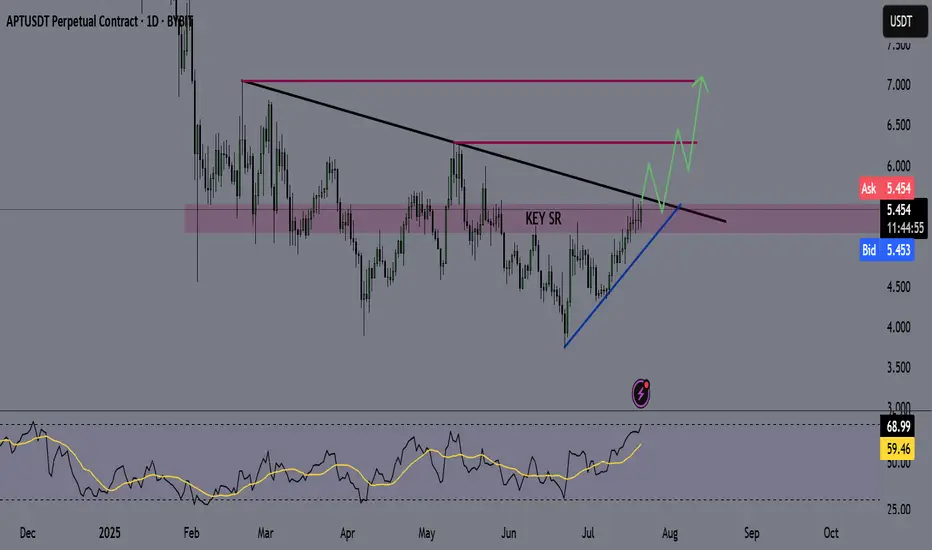
APT - APTOS Coin - Swing Long Idea📌 Fundamental Sentiment:
The entire crypto market is rallying, alongside other risk assets. This momentum is largely driven by U.S. policy expectations — specifically, Trump’s increasing pressure on Powell to resign and aggressively push for rate cuts from the Federal Reserve.
📌 Technical Analysis:
Price is currently testing the HTF supply zone with strong momentum. Additionally, it’s approaching a long-term bearish trendline that has dictated the downtrend since February 2025.
📌 Gameplan:
I want to see:
A clean breakout above the HTF supply zone with daily candle closure.
A confirmed break and close above the HTF bearish trendline on the daily timeframe.
If both confirmations align, I’ll start preparing for swing long setups, potentially riding into the early stages of a 2025 altseason.
—
🔔 Like & Follow for more daily updates. Feel free to drop your thoughts in the comments!
BNB LongI see a buy zone around 735 just after a significant FVG, and moreover, given the overall bullish strength of BNB, the pullback to happen next won't be a deep pullback but rather a light one. Confirming with the Fib retracement tool that zone sits well at the 38% pull back level, which is a good sign of a light bull back to continue the bullish move

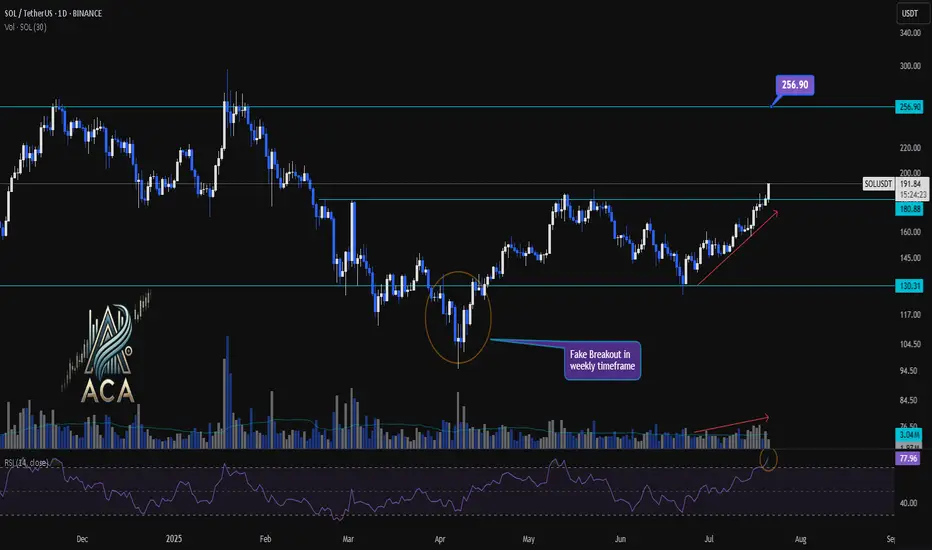
SOLUSDT 1D Chart Analysis | Accumulation Breakout Signals....SOLUSDT 1D Chart Analysis | Accumulation Breakout Signals Fresh Momentum
🔍 Let’s drill into the SOL/USDT daily chart, focusing on the recent breakout above the accumulation range, key support and resistance levels, RSI momentum, and volume confirmation for a robust bullish scenario.
⏳ Daily Overview
SOLUSDT has decisively broken out above a prolonged accumulation box, marking a significant shift in market structure. A daily close beyond this range now serves as a strong indicator for renewed bullish momentum. RSI is currently above 77, signaling that buyers are commanding momentum. Notably, volume has surged in tandem with price, confirming trader participation behind this breakout move.
📈 Technical Convergence and Trend Structure
- Accumulation Zone Break: After consolidating within a clear box for weeks, SOLUSDT closed above the upper boundary (around $180.88–$191.05), signaling a possible trend reversal or continuation.
- Daily Close Signal: A daily close outside the accumulation box offers high conviction for bullish continuation. This close acts as a potential entry signal for trend-followers.
- RSI Momentum: The RSI sits above 77—deep in the overbought territory. A close here not only confirms buyer strength but often precedes sustained uptrends when accompanied by price breakouts.
- Volume Surge: Volume has increased with the breakout, providing confirmation the move isn’t a false start, but likely fueled by real demand.
- Weekly Fake Breakout: There was a notable false breakout in the weekly timeframe, quickly reclaimed by bulls. This flip suggests buyers fended off downside attempts and now drive higher prices.
🔺 Bullish Setup & Targets
- First Target: $256.90 — marking the next major resistance on the chart and a logical upside objective for traders.
- Key Trigger: A confirmed daily (or weekly) close above the accumulation range with strong volume is essential for validating the upward trajectory.
📊 Key Highlights
- The breakdown of the accumulation box—now turned support—marks a pivotal structural change.
- RSI and price are making new local highs, solidifying the case for continued bullish momentum.
- Volume is climbing in sync with the move, offering real confirmation versus a potential fakeout.
- Recent fake breakout on the weekly chart, immediately negated, emphasizes that buyers are regaining—and likely maintaining—control.
🚨 Conclusion
SOLUSDT appears set for higher prices following the confirmed breakout above the accumulation range. Signs of trend health include an overbought RSI, volume confirmation, and the swift invalidation of a recent weekly fake breakout. As long as daily closes stay above the breakout level, the path remains clear for a rally toward $256.90. A strong daily close and continued volume will be your best signals for bullish continuation.
ALTSEAON CHART UPDATE OF CRYPTOCURRECIESthis is altcoins chart , braking through a bulling orderblock ,
its high prbable this gonna break ATH and the move to the new wealth making moves ,
investment is high risk and high rewarding

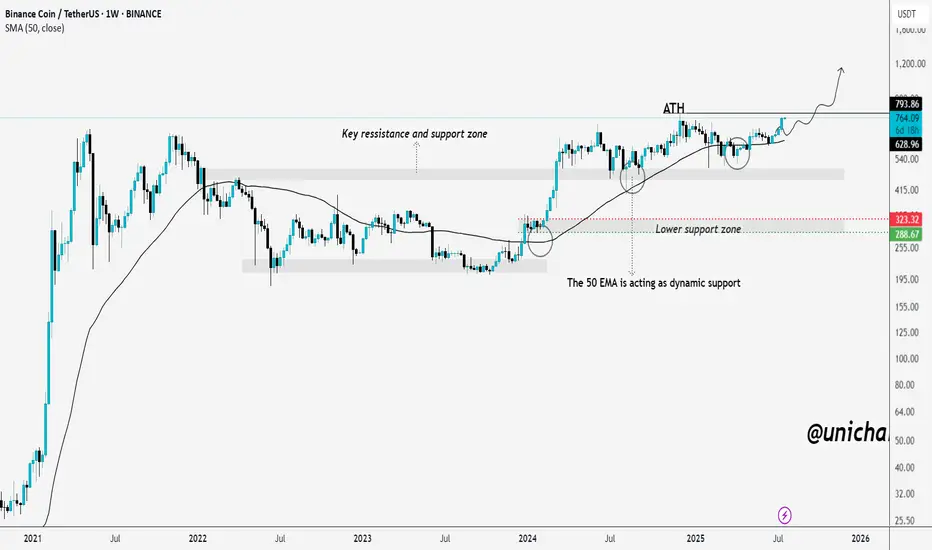
BNB on the Brink of a Breakout – ATH in Sight!We told you earlier — mark our words. BNB is now on the verge of breaking into a new all-time high, and the chart has been signaling this move for months.
The price has consistently respected the key support-resistance zone around $500–$540, and the 50-week EMA has acted as dynamic support throughout the uptrend.
Each dip into the lower support zone between $290–$320 was quickly bought up, showing strong buyer interest and demand. After several healthy consolidations and retests, BNB is once again approaching the previous ATH around $793.
If it breaks above with strong volume, we could enter price discovery mode. All the signs are aligning — and if you caught the early setups, you’re already in a great position. If not, it’s time to stay sharp and watch this breakout zone closely.
The momentum is real, and the fireworks might just be getting started.
THANKS
ETH/USD Breaking Higher, Can Fill The Gap? Hey traders,
Some of the altcoins are recovering very nicely today, with Ethereum being no exception. In fact, we’ve seen a pretty nice consolidation on ETH over the last three weeks, and it looks like it’s breaking to the upside right now. I wouldn’t be surprised to see more gains unfolding into wave five of a five-wave advance away from the April lows.
Targets around 3000 and even 3300 could be quite interesting, especially if we consider the big gap that dates back to February.
GH
