BTCUSD Market Breakdown – Liquidity Sweep Incoming?BTCUSD Market Breakdown – Liquidity Sweep Incoming?
🔍 Technical Analysis (July 29, 2025)
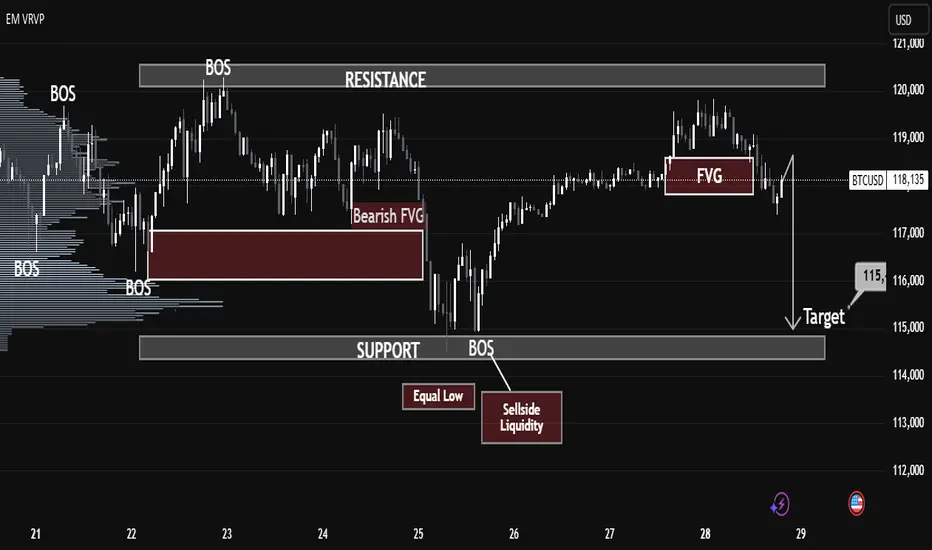
Chart Observations:
1. BOS (Break of Structure):
Multiple BOS events are identified, confirming key directional shifts in market structure. The last BOS near the support zone signals bearish intent.
2. Bearish Fair Value Gap (FVG):
A clean bearish FVG is left behind after a sharp drop on the 25th, indicating institutional imbalance and potential retracement area. Price rejected from that FVG later.
3. Equal Low & Sellside Liquidity:
The highlighted equal lows around July 25-26 mark areas of resting liquidity—prime targets for smart money manipulation.
4. New FVG Formed (July 28):
Another bearish FVG appears just before the projected breakdown, strengthening the case for a bearish continuation.
5. Support Zone Target – $115K:
A clean support zone (marked between 114,500–115,500) sits directly below the current market price. This is the likely liquidity target after sweeping equal lows.
6. Volume Profile (VRVP):
Low-volume nodes between the current price and support suggest minimal resistance to a sharp downward move.
⸻
🎯 Conclusion:
The structure, FVGs, and liquidity pools all point toward a liquidity raid below the equal lows, aiming for the support target near $115K. Traders should watch for a decisive break below the current range, especially if the FVG acts as resistance again.
Cryptonews
BITCOIN BULLYING Bitcoin hit take profit previously and now I will be looking at another buy within this trend and price action combined with patterns
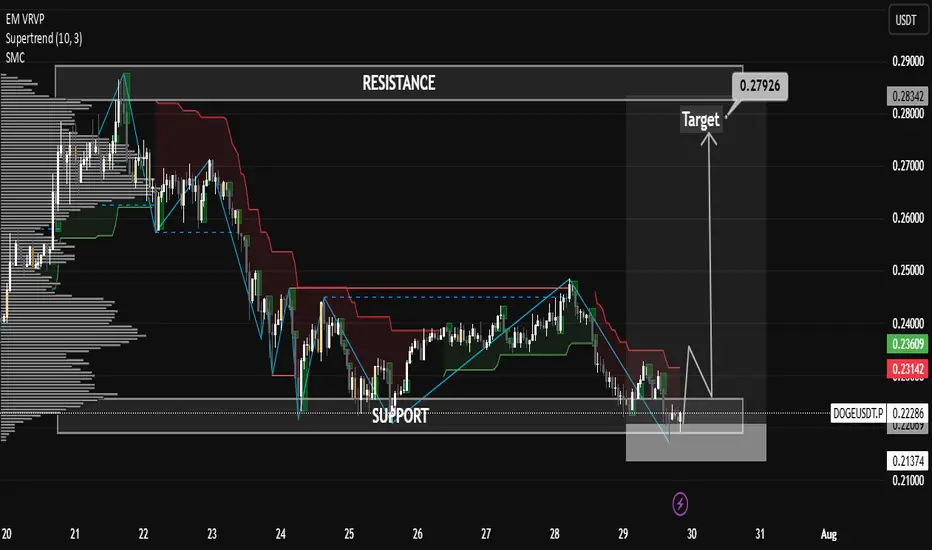
DOGE Looking Strong as Support HoldsDOGE Looking Strong as Support Holds
🔹 1. Support Zone Validated
The chart shows Dogecoin retested the lower boxed region around $0.221–$0.223, and bounced sharply from that zone. Given the heavy spike in volume during the retest, this suggests aggressive buying and accumulation—a hallmark of bullish conviction.
CryptoRank
The Tradable
🔹 2. Fibonacci 0.618 Support Bounce
On the 4‑hour timeframe, DOGE held firm above the critical Fibonacci 61.8% retracement level, and delivered a strong rebound—indicating technical significance and buyer interest at this level.
Blockchain News
🔹 3. Double-Bottom + Trendline Breakout
Analysts have identified a classic double-bottom formation, with price clearing the neckline (~$0.230–$0.231) and then retesting it successfully. Holding this retest confirms a breakout, suggesting more upside ahead.
Crypto Basic
🔹 4. Whale Activity & Accumulation
On-chain data shows $250 million in Dogecoin accumulation by whales, especially around the support zone—creating a structural demand base and reinforcing the bullish setup.
CoinCentral
🎯 Price Targets & Key Levels
Scenario Levels Rationale
Bullish continuation $0.239–$0.241 union resistance First resistance zone—price must reclaim to continue bullish momentum
$0.260–$0.280 Reclaiming $0.241 could open room toward mid‑channel resistance or prior highs
$0.300+ Potential target if momentum sustains and broader breakout occurs
Bearish invalidation $0.223 support Invalid break below suggests fading momentum—risk of correction to $0.215–$0.218
$0.215–$0.218 Secondary support zone if expansion of sell side continues
⚙️ Trade Setup for a Bullish Bias
Entry Focus: Consider entering long near $0.223 if price retests and holds, with a tight stop just below support.
Stop-Loss Zone: Slightly beneath $0.221 to account for volatility.
Targets: Scale out around $0.241, with larger targets at $0.260–$0.280, and possibly $0.30+ on sustained strength.
Confirmation: Watch for rising volume, break and close above resistance zones, and bullish indicator alignment.
⚡ Market Sentiment & Broader Themes
Momentum Shift: A bearish retrace reversed quickly amid accumulation, suggesting strong buyer commitment.
CryptoRank
The Tradable
AInvest
Double Bottom Status: Analyst commentary supports a reversal setup, with targets toward $0.310–$0.46 if the neckline holds.
Crypto Basic
AInvest
CryptoRank
Macro View: DOGE remains within a bullish channel; some forecasts project
Bitcoin & Altcoins: Technical Analysis and Market OutlookBitcoin (BTC) Analysis
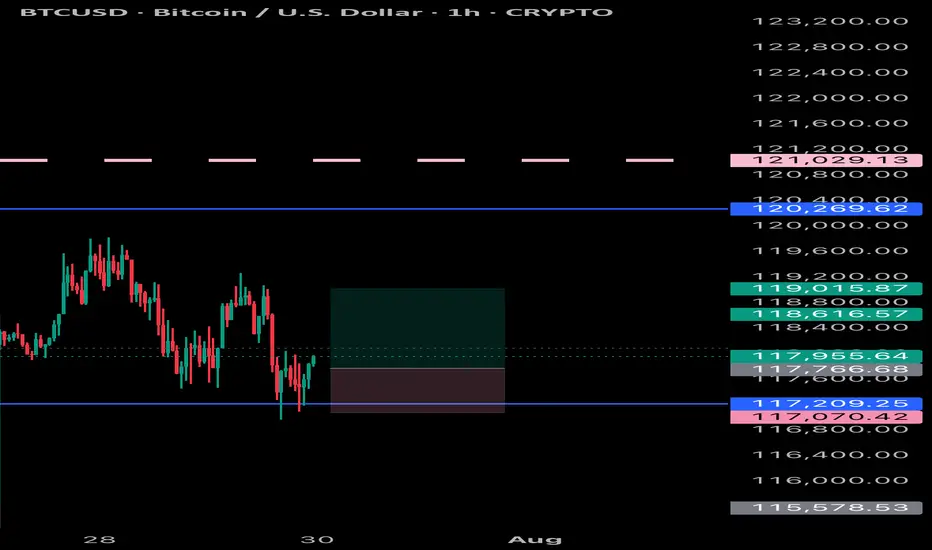
Bitcoin is currently forming a short-term bullish pennant within a larger long-term pattern, projecting a potential target around $135K.
Key Levels: BTC is consolidating between the lower zone at $117.3K and the upper zone at $119.7K.
Breakout Potential: A break above this pattern could propel BTC toward a new all-time high (ATH), surpassing the current ATH at $123K.
Macro Events This Week:
Wednesday: The Federal Reserve will announce its interest rate decision, with no changes expected.
Wednesday: ADP Employment Report, providing insights into potential future rate cuts.
Friday: Non-Farm Payrolls (NFP) data release, which could further influence market sentiment.
Ethereum (ETH) Breakout
Ethereum has decisively broken through its 4-year historical resistance around $3,725, closing the week above this level. This breakout signals a strong bullish outlook for ETH, with potential for further upside.
Altcoin Highlights
BNB: Has shattered its previous all-time highs, showcasing significant bullish momentum.
XRP: Reached approximately $3.64, reflecting strong gains and market interest.
Market Context
The crypto market is showing robust activity, with altcoins following Bitcoin and Ethereum's lead. Key macroeconomic events this week could introduce volatility, so traders should stay vigilant.
Disclaimer: This is not financial advice. Every trader is responsible for their own strategy and risk management.
Happy trading and good profits! 🚀

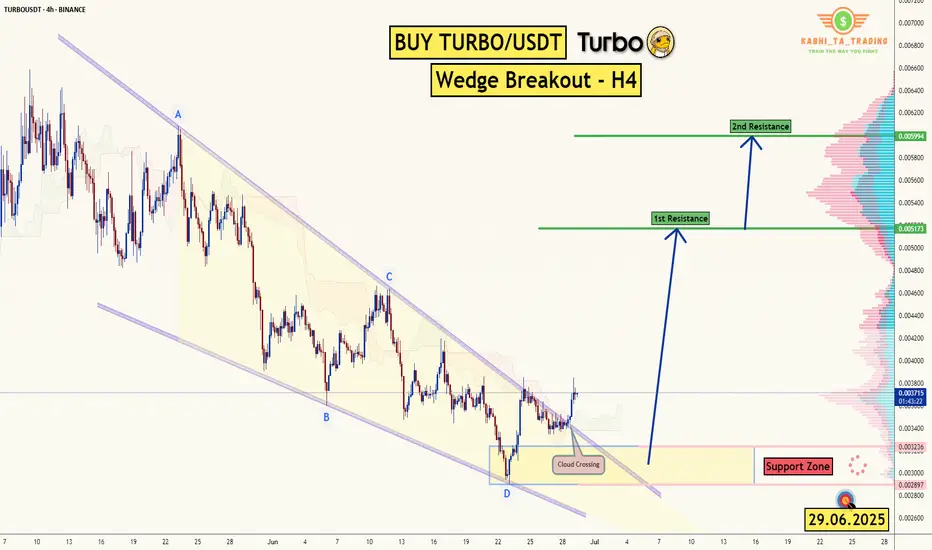
TURBO/USDT - H4 - Wedge Breakout (29.06.2025)The TURBO/USDT pair on the H4 timeframe presents a Potential Buying Opportunity due to a recent Formation of a Wedge Breakout Pattern. This suggests a shift in momentum towards the upside and a higher likelihood of further advances in the coming Days.
Possible Long Trade:
Entry: Consider Entering A Long Position around Trendline Of The Pattern.
Target Levels:
1st Resistance – 0.005173
2nd Resistance – 0.005994
🎁 Please hit the like button and
🎁 Leave a comment to support for My Post !
Your likes and comments are incredibly motivating and will encourage me to share more analysis with you.
Best Regards, KABHI_TA_TRADING
Thank you.
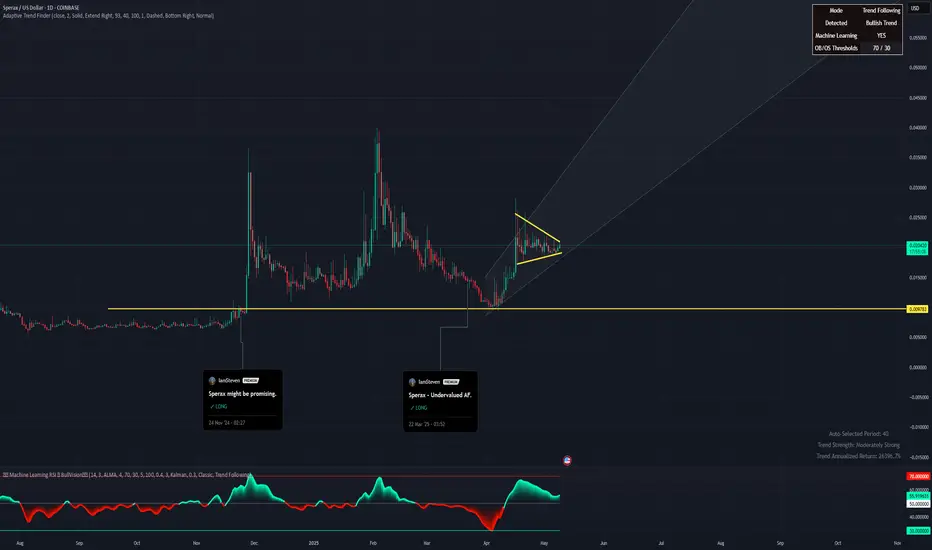
Sperax: Bullish pennant.Sperax is consolidating in a bullish pennant pattern after a strong recovery rally off the March lows. Price action has tightened between ascending support and descending resistance, forming a textbook continuation setup. Volume has decreased during this compression, which is often a precursor to explosive movement.
Fundamental Catalysts (Despite GENIUS Act Stalling):
Retail DeFi Narrative is Still Alive – While the GENIUS Act failed in the Senate, the momentum for regulatory clarity in the DeFi space continues. Future bills or executive actions could unlock capital flows to protocols like Sperax.
Deflationary Pressure —Over 13% of the total SPA supply has been burned, with more tokens locked and lost. The actual circulating supply is meaningfully lower than the total supply shown on aggregators.
SIP-70 has been passed , shifting SPA emissions from an automatic release model to a DAO-controlled emission schedule. This marks a significant milestone towards sustainable tokenomics and the preservation of long-term value.
Long-Term Accumulation – Wallet data and order books suggest that whales and long-term holders quietly accumulate during this sideways range.
Sperax remains a low-cap token with outsized potential in the next altseason if it secures even one meaningful partnership or fiat on-ramp.
Has Bitcoin Topped? Trump’s SBR Impact | Deep Dive Analysis🚨 Has COINBASE:BTCUSD topped? Even with Trump's Bitcoin Strategic Reserve? 🚨
In this deep dive, we analyze COINBASE:BTCUSD major factors that could point to a major reversal or breakout and to uncover whether a market top is forming.
We’ll cover:
Powerful Indicators
Bitcoin / BTC Trends
Price Action
EMA / SMA Trends
Volume Delta
Trend reversal / breakout
Bullish / Bearish / Confirmation from Indicators
order flow analysis
Timeframes (1W, 1D, 1m, 6M etc.)
Bullish and Bearish Sentiment
Strength Candles
👉 Like, comment below, and follow for more pro-level crypto insights.
MartyBoots here , I have been trading for 17 years and sharing my thoughts on COINBASE:BTCUSD .
Whether you're a short-term trader or long-term investor, this post provides the technical insight and edge to help you make better informed decisions.
📉 Stay ahead of the market. Watch the full breakdown and view charts to decide for yourself: Has Bitcoin really topped?
Watch video for more details and below I will show some powerful charts with descriptions.
Warning in near term - LARGE ORDERS
Consolidation in price with large orders above
The Red lines = LARGE ORDERS
Large orders can act as an magnet to price
Large orders can also be support and resistance
Price Above the white 100 moving average
Price strong above it
Price weak below it
Strength Candles
Still Bullish
Multiple timeframes still green
Sentiment Tool Still Bullish
Still Bullish
Multiple timeframes and settings still green
3 Drive Structure
Equal Measured moves
Implies Top Is Not In
Target = $126k
Bullish Engulfing Candle
Implies higher prices to come
👉 Like, comment below, and follow for more pro-level crypto insights.
#Bitcoin #Trump #BTC #CryptoTrading #TechnicalAnalysis #CryptoMarket #BitcoinTop #TradingView #StrategicBitcoinReserve

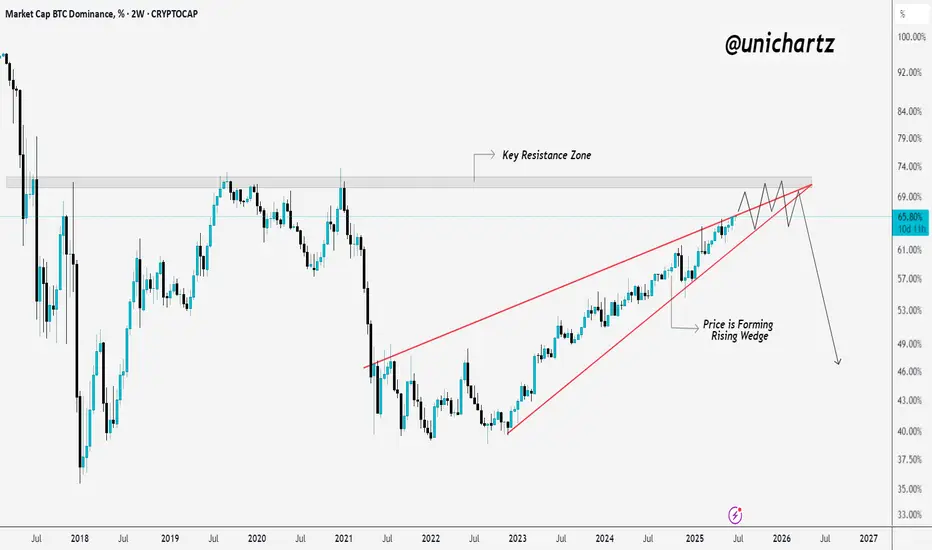
BTC Dominance Nearing Major Reversal Zone?Dominance has been grinding higher for months, but it's now walking into heavy resistance, and the structure looks like a rising wedge (not a great sign for bulls).
This setup often ends with a breakdown, which could be the spark altcoins are waiting for.
It’s not confirmed yet, but the chart’s starting to hint at a shift.
Watch closely, big moves usually follow tight squeezes.
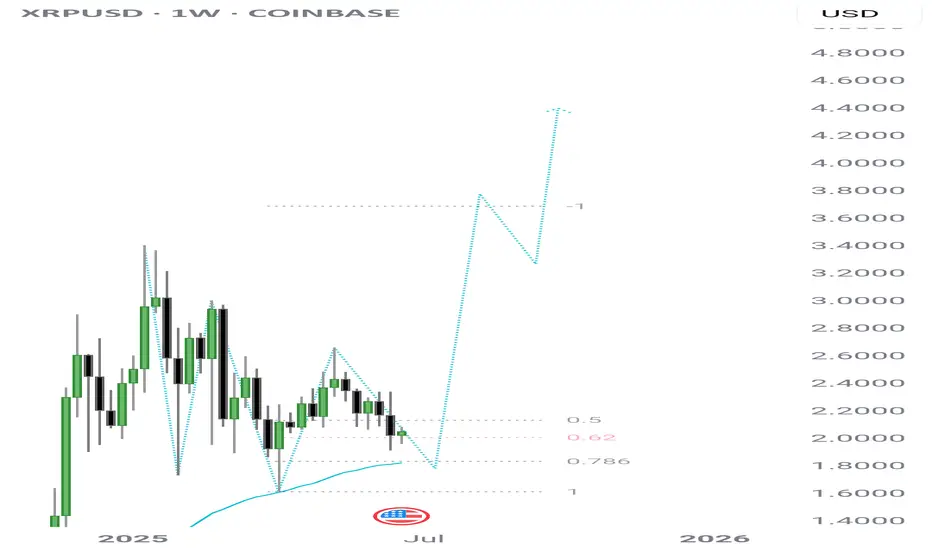
XRPI'm expecting a $1.80 tap before we take off.
We should begin moving up around the second week of July, after peace talks with Iran end. LOCK IN. 🔐
USA bombs IRAN - Bitcoin Falling!Operation Midnight Hammer was a major U.S. military strike carried out on June 21, 2025, targeting three of Iran’s key nuclear facilities: Fordow, Natanz, and Isfahan.
The operation involved seven B-2 Spirit bombers, each flying an 18-hour mission from Missouri, supported by over 125 aircraft, including refueling planes, fighter escorts, and surveillance assets.
To maintain the element of surprise, the U.S. used deception tactics, such as sending decoy aircraft westward over the Pacific while the actual strike force flew east toward Iran with minimal communications.
The bombers dropped Massive Ordnance Penetrators (MOPs)—30,000-pound bunker-busting bombs—on the fortified nuclear sites. Cruise missiles launched from a U.S. submarine struck additional infrastructure targets.
The Pentagon described the mission as the largest B-2 operational strike in U.S. history and the first known combat use of the MOP. Officials emphasized that the operation was aimed solely at nuclear infrastructure and not at Iranian civilians or military personnel

ETH / USDC Pool StakeSharp sell-off following the U.S. strike on Iran—ETH whale has entered. Set your liquidity pool range wide to capture a potential rebound. If the price continues to drop, no problem—full ETH position is anchored at the bottom of the range. Avoid swapping ETH to realize losses. Hold your original ETH and continue adjusting the range downward if needed. Your only real costs are minting and gas fees, so operate on a low-cost network like Arbitrum or Base to keep expenses minimal.
There is another Bearish BPR zone below the current price.BTC/USDT Market Update – Clear, Detailed, and Easy to Understand (Even for Beginners)
Let’s take a look at what’s happening with Bitcoin (BTC/USDT) right now explained in a way that even someone new to trading can follow along and understand.
Recently, Bitcoin hit a new high it was climbing up steadily. But then, due to negative global news related to war, the market took a hit and started dropping sharply.
Currently, BTC is trading at a (BPR) this is a technical area that often acts as a strong resistance zone, where the price tends to face rejection and reverse.
👉 Right now, Bitcoin is struggling to move higher and appears to be getting rejected from this BPR level.
But here’s where it gets more interesting:
🔻 There is another Bearish BPR zone below the current price, and the market has already touched that zone once before bouncing upward.
So what's the current situation?
📍 If Bitcoin is able to break above the current Bearish BPR (the level where it’s trading now) — it would be a bullish sign, and the market may start rising again.
📍 However, if BTC fails to break this resistance level, then we could see another strong move to the downside, possibly heading back to lower support zones.
🚨 Key Takeaway:
This level — the one BTC is currently interacting with — is very important.
📌 Traders should keep a close eye on it.
📌 Let the market reveal its direction before making any decisions.
Remember:
⚠️ This is not financial advice. Always Do Your Own Research (DYOR).

Ethereum Liquidity Pool RangeOn the ETH/USDC liquidity pool on the Base network, Ethereum’s volatility is beginning to stabilize, creating a favorable range for liquidity provision, as indicated by the horizontal red lines. There may be an opportunity to tighten this range further in the coming hours, but additional data is needed to confirm. For now, the concentrated range is being set slightly wider, given that we’re still relatively close to the significant volatility spike from earlier in the week.
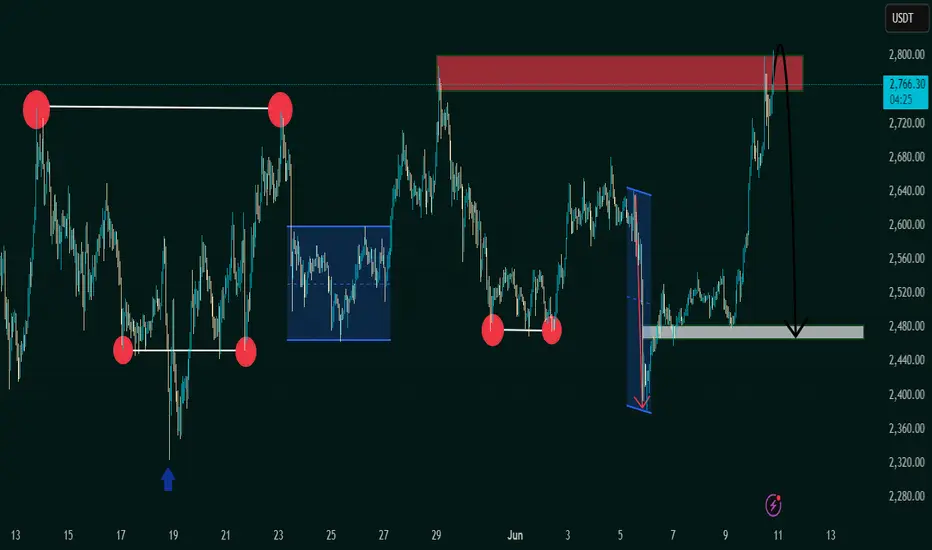
"Bearish Reversal Opportunity Following Supply Zone Rejection"1. Double Top Formation (Resistance Level Identified)
The chart displays a clear double top structure at the 2,760–2,800 USDT level.
This level has acted as a strong supply zone (highlighted in red), where price previously reversed, indicating heavy selling interest.
Current price action has retested this resistance zone and shown signs of rejection.
2. Liquidity Sweeps & False Breakouts
On the left side of the chart, an aggressive downward wick (marked with a blue arrow) suggests a liquidity sweep below a key low before strong bullish momentum returned.
This type of price action indicates smart money involvement, designed to remove weak hands before pushing price higher.
3. Accumulation Phases (Sideways Consolidation)
Multiple accumulation ranges are highlighted with blue rectangles.
These ranges show horizontal consolidation, where price builds up energy before breakout.
The most recent breakout led to a vertical rally toward the resistance zone, signaling an end of the accumulation and a start of distribution.
4. Double Bottom Support Structure
Identified near the 2,480 level, marked by red circles.
This level has historically acted as demand/support, evidenced by multiple bounces from this price zone.
Now highlighted with a grey zone, it is projected to act as the next key support area.
5. Bearish Projection
A large black arrow suggests a forecasted bearish move from the current high (~2,800) back to the support zone (~2,480).
This aligns with the idea of a mean reversion or pullback after a strong bullish impulse.
---
Conclusion & Trade Idea:
🔻 Bias: Bearish (Short-term)
The chart presents a classic reversal pattern with a double top at a well-defined supply zone.
Entry could be considered after confirmation of rejection from this level.
🧠 Trade Plan Suggestion:
Entry: Short near 2,780–2,800 after bearish confirmation (e.g., bearish engulfing candle or break of structure).
Target: 2,480 (support zone).
Stop Loss: Above 2,820 (recent high).
Risk-Reward: Approximately 1:2.5 or better depending on execution.
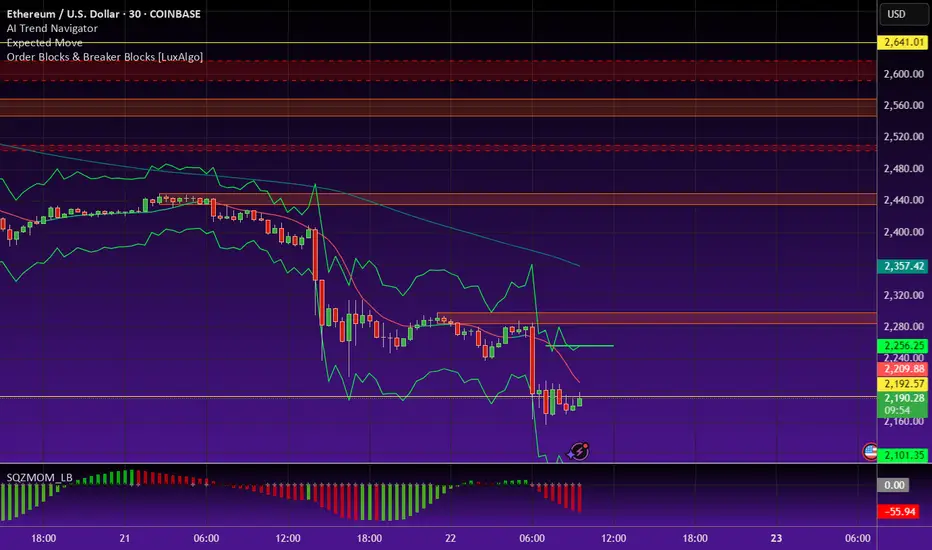
Ethereum (ETH/USDT) Breakout Watch ! Hello traders here is KingPro's analysis on Ethereum
📈ETH is at the critical resistance level strong closing above it could tiger a bullish move.
Current Price: $2,628
EMA 70 Support: Price is holding above the 70-period EMA ($2,577), showing bullish structure.
Support Zone: The area around $2,320–$2,400 is acting as a strong historical support, confirmed multiple times.
Supply Zone: Consolidation occurred near $2,570–$2,620, but price has broken above it — indicating accumulation.
Critical Resistance Area: Around $2,780–$2,800. This is a key level — a breakout above could lead to strong bullish continuation.
Next Target: $2,782.93 – price may retest this resistance as indicated by the projection arrow.
📊 Trade Idea:
If ETH sustains above $2,620 and breaks the short-term channel resistance, a move toward $2,782+ is likely.
🔒 Risk: A breakdown below the EMA or the supply zone (~$2,570) could invalidate the setup.

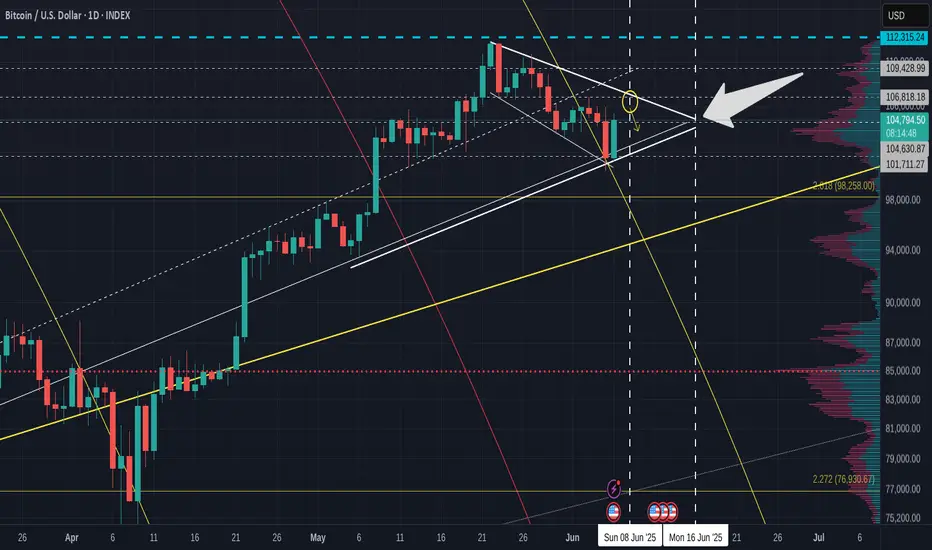
Bitcoin DAILY & 4 hour charts show possible push in 10 days ?
First of all SORRY for all the lines.
This is a working chart but they are all relevant to this post.
Main chart is DAILY and shows ua the Pennant that we appear to be printing with the descending channel inside. The diagonal line falling is the Fib Circle we recently broke through.
See how, once above the fib circle, we slid down the outside, using it as support, as we often do.
Then we hit another line of support and that created this recent push higher.
Should we continue, we will most likely go to the upper trendline, towards that circle. Circle center is around Sunday 6th.
While we are still on the daily, see that Pennant Apex...that is a Week on Sunday, the 15th.
99% of the time, PA reacts BEFORE the apex.
Should things continue, we can expect to see a rise till end of weekend, Rejection back to lower trend line and then a Rise and maybe a push Out of the pennant to new highs.....OR, and I think this is very probable, we go back to around the ATH line ( blue Dash) and Dip back down again.
It is worth remembering that we have inflation data being released in the USA next week.
People will likely wait to hear ths before making to many big moves.
The Daily MACD offers some guidence on this also
MACD nearly back on Neutral and could bounce. The Dashed line is this sunday.
MACD could continue to drop below neutral, we shall have to watch this closely.
As I mentioned, in the short term, BTC likely to reach for this circle in the 4 hour chart below.
I will admit, I expected PA to reach this point in a differnent way as posted earlier in the week, But, Hey, we still getting there..
Should we get rejected there, as I expect we will, then a revisit to 103K before a push back.
But given the inflation figures, things could get very volatile next week so CAUTION
We can see on the 4 hour MACD how we have already been rejected of Neutral once and we are heading there again
The potential to push through the neutral line exists but.......
I do expect some volatility and so we need to be aware things could change rapidly.
The inflation data is a key. Depending on if it is drooping, rising or flat, this WILL effect the situation with regard to the FED Rate decision later this month.
So, we wait, with caution and expectations
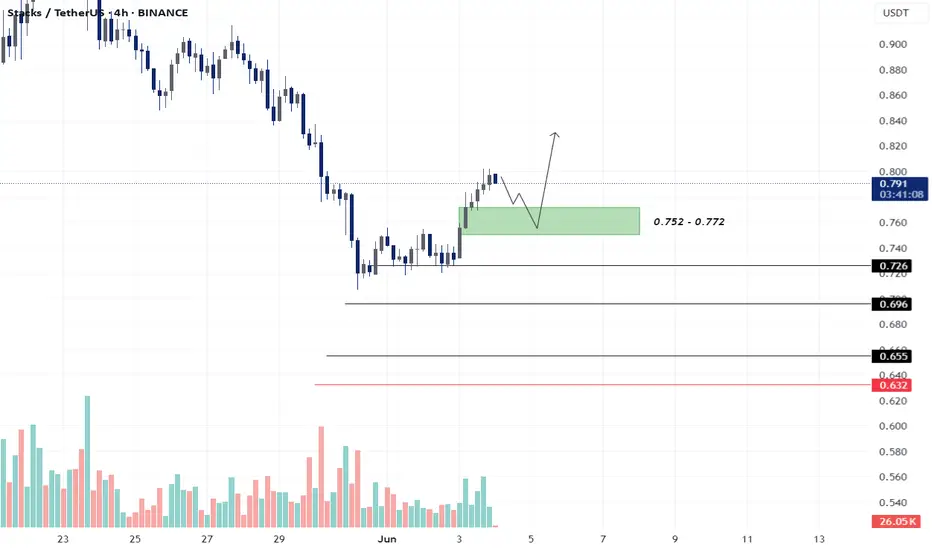
STX - LONG SET-UPBINANCE:STXUSDT
Green Zone (Demand Zone): 0.752 – 0.772
This is a bullish demand zone or entry zone where buyers previously stepped in.
Price may retest this zone before moving higher (as shown by the curved arrow).
Ideal area to deploy entries (25–50%) for a long position.
Acts as a support zone for potential reversal
Average Levels - 0.726 , 0.696 , 0.655
Stoploss - 0.632
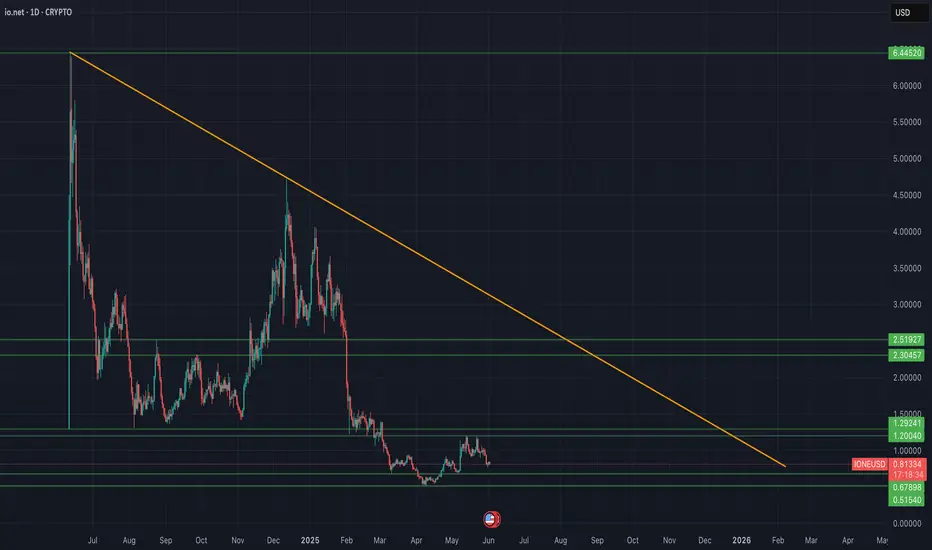
Decentralized AI Infrastructure in a trade war between US/ChinaThe AI revolution is real, but it has a critical weakness: GPU scarcity.
NVIDIA's H100s are sold out to specific countries around the world, serving as crucial hardware for AI development. Cloud costs are skyrocketing. Access to compute is being gatekept by Big Tech. Meanwhile, China is no longer allowed to purchase these GPUs from the US due to the ongoing trade war and the escalating AI arms race between the two countries.
Enter $CRYPTO: IONEUSD — a decentralized GPU network on Solana aiming to become the infrastructure layer for AI, machine learning, and high-performance computing.
Just like Helium tokenized wireless infrastructure, IO is tokenizing global compute power.
-AI is the fastest-growing sector globally, but compute remains the biggest bottleneck.
-Cloud GPU costs are 4–10x higher than decentralized alternatives.
-IO.Net positions itself at the intersection of AI, Web3, and tokenized infrastructure.
-IO is early in its growth curve, currently holding a market cap of $131 million.
I believe that IO.Net could represent a way for China to compete with the US in the AI race, offering a high-demand substitute for expensive and sanctioned chips — helping China stay competitive in AI development.
Because IO.Net is decentralized, it cannot be easily shut down. I believe IO.Net is here to stay and has strong potential to grow significantly from its current market cap of $131 million.
COINBASE:IOUSD
NASDAQ:NVDA
NASDAQ:AMD
NYSE:TSM
BITSTAMP:BTCUSD
BINANCE:SOLUSD
AMEX:SPY
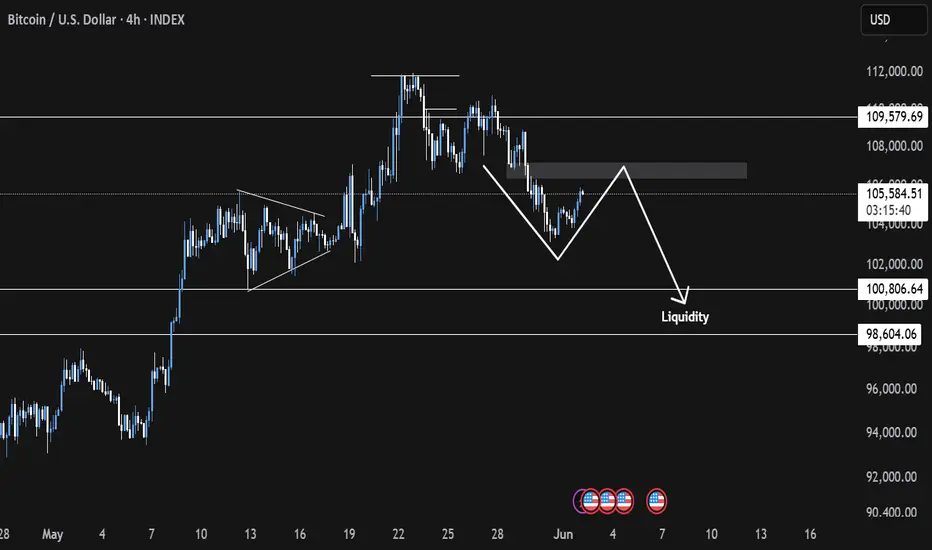
Bitcoin (BTC) Market Analysis1. Previous Analysis Validation
Our previous week's analysis played out perfectly, aligning well with the market movement.
2. Current Market Sentiment
The market remains bearish overall. However, we are seeing a short-term price pump, likely due to late short positions entering the market. This is resulting in a price move to trigger short liquidations. The recent 4H swing highs are acting as key stop-loss zones.
3. Imbalance & Rebalancing
The price is moving upward toward a daily imbalance area (highlighted in orange). We expect the market to rebalance in this zone, potentially leading to a price rejection and continuation of the downward trend.
4. Liquidity Zone
Our primary liquidity zone lies between \$100K and \$98K. We anticipate this area to be a key region for price reaction.
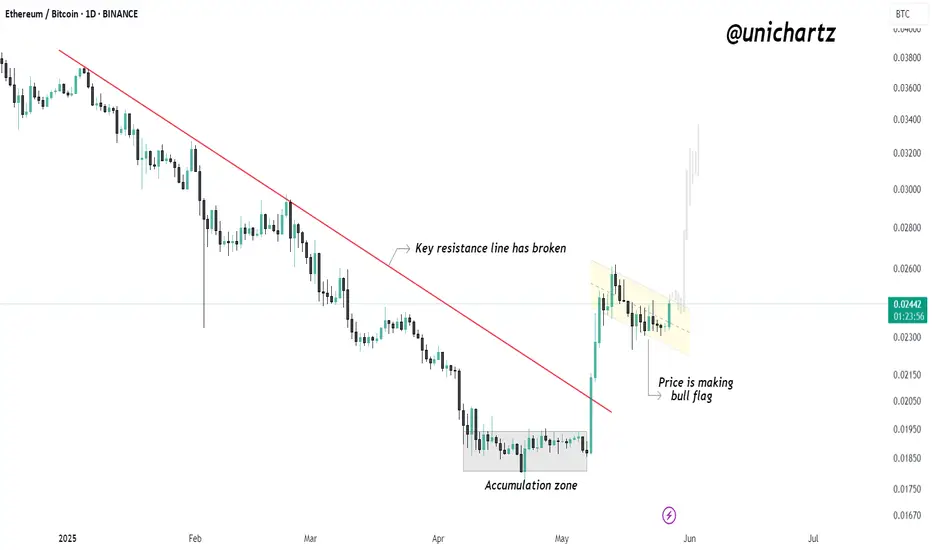
Bull Flag Forming on ETH/BTC – Altcoins About to Explode?$ETH/BTC just broke a key resistance line and is now forming a bullish flag — this is big for altcoins.
Why? Because when ETH starts gaining strength against BTC, it often signals the beginning of an altcoin rotation. Ethereum usually leads the pack — and when its BTC pair is bullish, altcoins tend to follow with strong momentum.
The breakout followed by a bull flag consolidation suggests continuation is likely. If ETH/BTC pushes higher from here, we could see capital flow from Bitcoin into altcoins, igniting the next leg of altseason.
Altcoins may be gearing up — stay sharp.
XRUSDT IDEAWe can see a consolidation on the daily time frame. Btc has reached to new highs but alternate coins have not moved along with same motivation. Why?

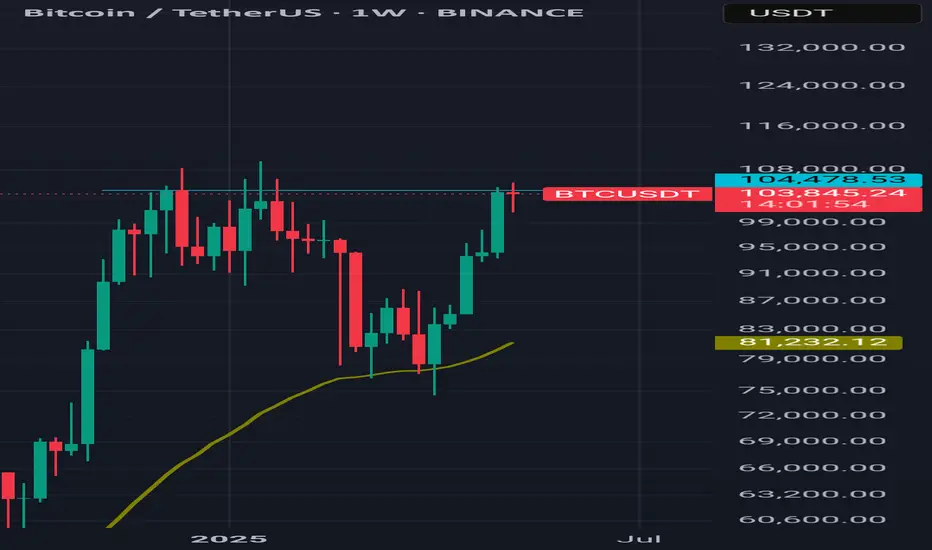
Bitcoin's weekly closeBitcoin's weekly close tonight is crucial. It's good if it closes above its all-time weekly high to continue the uptrend and form a new peak.